Liquidity Levels (Smart Swing Lows)Liquidity Levels — Smart Swing Low Detection
Efficient Liquidity Sweep Visualization for Smart Money Traders
This script automatically identifies and plots liquidity-rich swing lows based on pivot logic, filters them to remove redundant levels, and overlays daily highs/lows for added context — giving Smart Money Concept (SMC) traders a clean, actionable map of liquidity.
It’s designed to be minimal yet powerful: perfect for spotting potential liquidity grabs, mitigation zones, and sweep targets with zero chart clutter.
🔍 What This Script Does:
Detects Smart Swing Lows
Uses fixed pivot detection (left = 3, right = customizable) to identify structurally significant swing lows.
Filters out swing lows that are too close together using a percentage-based spacing threshold to reduce noise.
Mitigation Cleanup Logic
Tracks whether recent price action breaches past swing lows.
If breached, the swing level is automatically removed, keeping only relevant, unmitigated liquidity levels on your chart.
Plots Daily Highs and Lows
Each new trading day, horizontal rays mark the prior day’s high and low — useful for identifying resting liquidity and possible sweep zones.
Labeling and Style Customization
Optional labels for swing lows.
Full control over label size, color, and visibility to match any chart aesthetic.
Timeframe Filtering
Runs exclusively on 5m, 10m, and 15m charts to ensure optimal reliability and signal clarity.
⚙️ Customization Features:
Pivot sensitivity (Right side control)
Minimum distance between swing lows (in %)
Label visibility, size, and color
Line width and colors for both swing levels and daily highs/lows
Mitigation cleanup lookback length
💡 How to Use:
Add the script to a qualifying intraday chart (5–15m).
Use the swing low levels to monitor liquidity-rich zones.
Combine with your personal strategy to identify liquidity grabs, potential reversal zones, or entry points following a sweep.
Let the built-in cleanup logic remove any already-mitigated levels so you can focus on active targets.
🚀 What Makes It Unique:
This isn’t just another pivot plotter — it’s a smart, self-cleaning SMC tool designed for modern liquidity-based trading strategies.
A must-have for traders using concepts like liquidity grabs, mitigation blocks, or sweep-to-reverse trade models.
🔗 Best used in combination with:
✅ First FVG — Opening Range Fair Value Gap Detector: Pinpoint the day’s first imbalance zone for intraday setups.
✅ ICT SMC Liquidity Grabs + OB + Fibonacci OTE Levels: Confluence-based entries powered by liquidity logic, order blocks, and premium/discount zones.
Used together, these scripts form a complete Smart Money toolkit — helping you build high-probability setups with confidence, clarity, and clean charts.
Smcconcepts

ICT SMC Liquidity Grabs and OBsICT SMC Liquidity Grabs + OB + Fibonacci OTE Levels
Smart Money Concepts Trading Assistant
This script is built for traders who follow ICT (Inner Circle Trader) and Smart Money Concepts. It intelligently combines three critical components of SMC trading: Liquidity Grabs, Order Blocks, and Fibonacci-based Optimal Trade Entry (OTE) zones — giving traders visual cues for potential high-probability reversals and entry points.
🔍 What This Script Does:
Detects Liquidity Grabs
Identifies swing highs/lows where price sweeps liquidity, then immediately reverses.
Labels them with orange markers when price takes out previous highs/lows but closes back inside.
Draws Order Blocks
After a liquidity grab, the script looks for strong bullish or bearish candles and automatically highlights the OB zone.
These OB zones are visualized with transparent colored boxes extending several bars forward.
Plots Fibonacci OTE Levels
Uses recent swing high/low pivots to dynamically draw customizable OTE retracement levels (e.g., 62% and 75%) for both long and short setups.
Highlights Optimal Entry Zones
Marks valid OTE-based buy/sell opportunities only when:
Liquidity has been taken,
Price enters the OTE zone,
And a strong confirming candle appears.
Adds visual zones, trade labels, and optional alerts for each qualified entry.
Includes Take Profit Targets
Automatically calculates take-profit levels based on previous structure and risk-reward ratios.
TP1 is the previous swing, and TP2 is an extended R-multiple (customizable by user).
⚙️ Customization Options:
Toggle each feature (Liquidity Grabs, OBs, Fibonacci Levels)
Adjust Fibonacci levels (default: 62% and 75%)
Set lookback period for liquidity checks
Customize the R-multiple for TP2 levels
💡 How to Use:
Enable desired features from the input panel.
Watch for Buy/Sell OTE zones highlighted in green/red.
Confirm with liquidity sweep and OB support for stronger signals.
Use the automatically generated TP levels to manage risk.
🚀 What Makes It Unique:
Unlike other open-source mashups, this script synchronizes multiple SMC concepts into a single tool that:
Waits for high-confidence conditions (not just blind fib or OB detection)
Validates entries using multiple confluences
Visually marks actionable setups
Automates trade management zones
Whether you're trend-trading, scalping, or swing trading ICT-style, this tool offers a streamlined, smart-money-aligned workflow directly on your chart.

ICT Turtle Soup (Liquidity Reversal)ICT Turtle Soup — Liquidity Reversal Detection
Classic Liquidity Trap Reversal Strategy for Smart Money Traders
This indicator implements the ICT Turtle Soup concept — a classic liquidity-based reversal pattern — which occurs when price runs above or below a recent swing level to grab liquidity, then sharply reverses. This pattern is commonly used in Smart Money Concepts (SMC) and Inner Circle Trader (ICT) strategies to anticipate false breakouts and high-probability reversals.
🔍 What This Script Does:
Identifies Swing Highs & Lows
Detects recent swing highs and lows using a customizable lookback period.
Tracks Liquidity Grabs
A bearish Turtle Soup setup is triggered when price breaks above a recent swing high but closes back below it.
A bullish Turtle Soup setup is triggered when price breaks below a recent swing low but closes back above it.
These conditions often signal liquidity traps, where price sweeps resting orders before reversing.
Plots Signals Directly on the Chart
Turtle Soup setups are marked with 🐢🔻 (bearish) and 🐢🔺 (bullish) labels.
Optional full-text labels can also be displayed for clarity and journaling.
Includes Alert Conditions
Alerts can be enabled to notify you of bullish or bearish Turtle Soup reversals in real-time.
⚙️ Customization Features:
Adjustable swing lookback period
Enable/disable Turtle Soup labels
Set label font size
Choose your preferred bullish/bearish signal colors
💡 How to Use:
Add this script to your chart (ideally on intraday timeframes such as 5m–15m).
Wait for a Turtle Soup signal near a key swing high/low or liquidity zone.
Combine with other confirmation tools (e.g., FVGs, Order Blocks, OTE) for stronger setups.
Use alerts to stay ahead of fast-moving reversals.
🧠 Why It Works:
Turtle Soup setups are rooted in liquidity theory — they exploit the market’s tendency to sweep obvious swing levels before reversing. These moves often trap retail traders and mark the beginning of Smart Money entries.
🔗 Best Used With:
Maximize the edge by combining this with other SMC tools:
✅ First FVG — Opening Range Fair Value Gap Detector
✅ ICT SMC Liquidity Grabs + OB + Fibonacci OTE Levels
✅ Liquidity Levels — Smart Swing Lows
Together, they create a complete ecosystem for identifying, confirming, and executing liquidity-driven trade setups with precision.

ICT SMC Liquidity Grabs and OBsICT SMC Liquidity Grabs + OB + Fibonacci OTE Levels
Smart Money Concepts Trading Assistant
This script is built for traders who follow ICT (Inner Circle Trader) and Smart Money Concepts. It intelligently combines three critical components of SMC trading: Liquidity Grabs, Order Blocks, and Fibonacci-based Optimal Trade Entry (OTE) zones — giving traders visual cues for potential high-probability reversals and entry points.
🔍 What This Script Does:
Detects Liquidity Grabs
Identifies swing highs/lows where price sweeps liquidity, then immediately reverses.
Labels them with orange markers when price takes out previous highs/lows but closes back inside.
Draws Order Blocks
After a liquidity grab, the script looks for strong bullish or bearish candles and automatically highlights the OB zone.
These OB zones are visualized with transparent colored boxes extending several bars forward.
Plots Fibonacci OTE Levels
Uses recent swing high/low pivots to dynamically draw customizable OTE retracement levels (e.g., 62% and 75%) for both long and short setups.
Highlights Optimal Entry Zones
Marks valid OTE-based buy/sell opportunities only when:
Liquidity has been taken,
Price enters the OTE zone,
And a strong confirming candle appears.
Adds visual zones, trade labels, and optional alerts for each qualified entry.
Includes Take Profit Targets
Automatically calculates take-profit levels based on previous structure and risk-reward ratios.
TP1 is the previous swing, and TP2 is an extended R-multiple (customizable by user).
⚙️ Customization Options:
Toggle each feature (Liquidity Grabs, OBs, Fibonacci Levels)
Adjust Fibonacci levels (default: 62% and 75%)
Set lookback period for liquidity checks
Customize the R-multiple for TP2 levels
💡 How to Use:
Enable desired features from the input panel.
Watch for Buy/Sell OTE zones highlighted in green/red.
Confirm with liquidity sweep and OB support for stronger signals.
Use the automatically generated TP levels to manage risk.
🚀 What Makes It Unique:
Unlike other open-source mashups, this script synchronizes multiple SMC concepts into a single tool that:
Waits for high-confidence conditions (not just blind fib or OB detection)
Validates entries using multiple confluences
Visually marks actionable setups
Automates trade management zones
Whether you're trend-trading, scalping, or swing trading ICT-style, this tool offers a streamlined, smart-money-aligned workflow directly on your chart.

First FVG Custom Time RangeFirst FVG — Opening Range Fair Value Gap Detector
Smart Money Opening Imbalance Strategy Tool
This script automatically detects and highlights the first Fair Value Gap (FVG) that forms between 9:30 and 10:00 AM Eastern Time (New York session open) — a critical period often referred to as the Opening Range. It’s designed for Smart Money traders looking to isolate early-morning inefficiencies that may influence market behavior throughout the trading day.
🔍 What This Script Does:
Automatically Detects the First FVG in the Opening Range
Scans price action between 9:30 and 10:00 AM ET and identifies the first valid bullish or bearish FVG that forms.
Only one FVG is shown per day — ensuring a clean, focused view.
Draws a Visual Zone
Once detected, the FVG zone is extended forward on the chart (customizable duration).
A labeled zone helps users track how price reacts to it throughout the session.
Optional Retest Alerts
Alerts you when price re-enters the zone — a potential reaction point used by SMC traders.
Customization Options
Set your preferred session time window
Adjust zone duration (in bars)
Customize label font size, colors, and visibility
Enable/disable alert on retest
📈 Why the First FVG Matters:
Time-Sensitive Setup: The first FVG typically forms no earlier than 9:31 AM ET and represents a potential “time distortion” or imbalance zone created by aggressive market participants during the open.
Behavioral Study: Many traders journal how price behaves around this zone each day — whether it acts as support, resistance, or gets traded through later in the session.
Predictive Value: Observing how this zone is respected or broken can provide anticipatory insight into intraday price action, rather than reactive analysis.
Great for New Traders: This opening FVG is often recommended as a starting reference point for building trade models and understanding how institutional imbalances unfold.
🚀 What Makes It Unique:
This tool doesn’t spam your chart with every FVG. It laser-focuses on a single, time-bound zone backed by institutional logic — the first presented imbalance of the day during the opening range.
Use it to:
Monitor price behavior around early inefficiencies
Plan journal entries and pattern recognition
Align intraday setups with a high-probability SMC model
Whether you’re scalping, journaling market structure, or refining entries based on liquidity behavior — this script helps you make the first 30 minutes count.
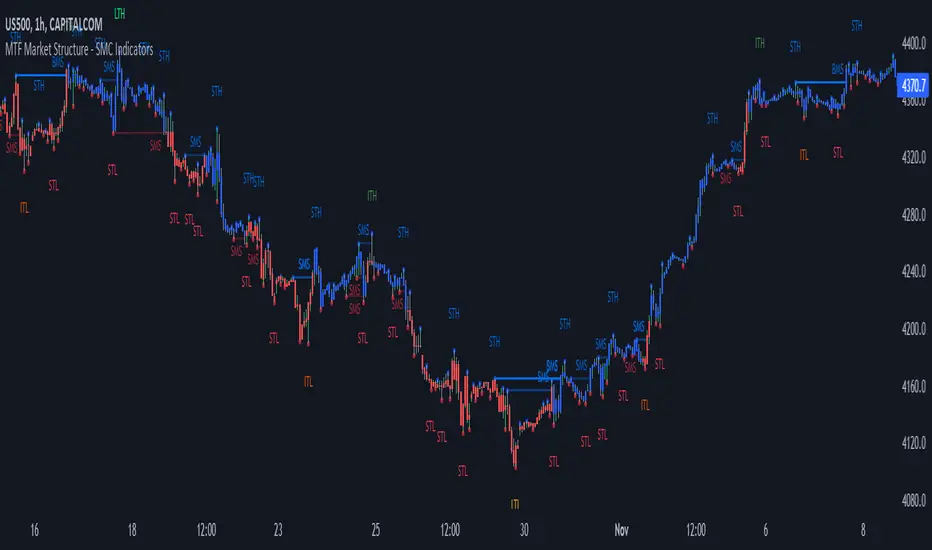
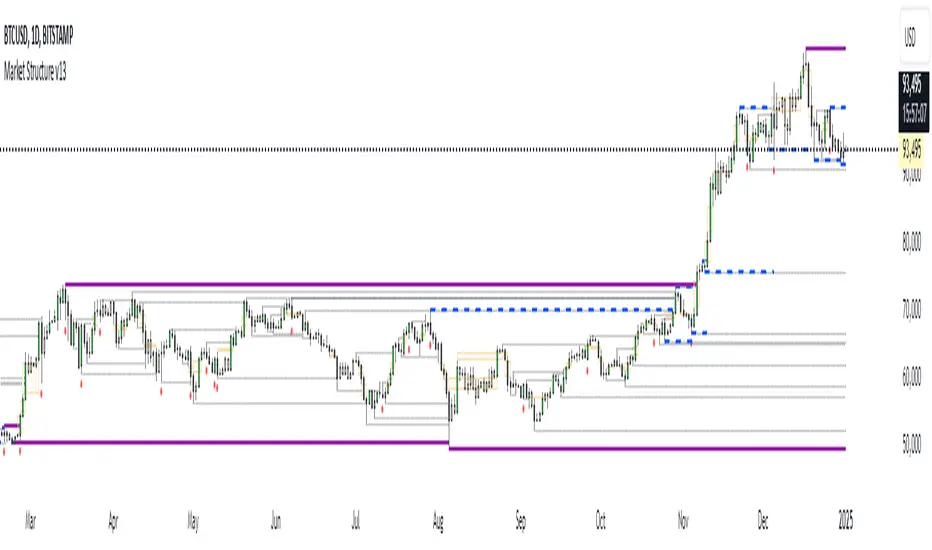
Market Structure [Truth Indie]Market Structure
Market structure is a crucial component of various trading methodologies. If you can accurately map the market structure, tailored to the volatility or assets you are trading, it helps you identify trends clearly and enhances the accuracy of your trading strategies.
This indicator facilitates easy and swift mapping of market structure for traders. The market structure in this indicator consists of 3 types:
1.Fractal structure
2.Internal structure
3.External structure
FRACTAL STRUCTURE MAPPING
-Wick breaks are sufficient for a Fractal break of structure.
-The precise moment when the price breaks a Fractal high or low confirms the break.
BULLISH & BEARISH FRACTAL STRUCTURE
Bullish Fractal Structure:
-A Fractal high is validated when the subsequent candle fails to surpass its high (fractal pullback).
-A Fractal higher low is validated once the price breaches the Fractal high (always identify the NEAREST Fractal low). This will be the most recent candle that was unable to exceed the high of the previous candle.
Bearish Fractal Structure:
-A Fractal low is validated when the following candle fails to break its low (fractal pullback).
-A Fractal lower high is validated once the price breaks the Fractal low (always identify the NEAREST Fractal high). This will be the most recent candle that was unable to surpass the low of the previous candle.
Settings
-Show or hide text and lines, including adjusting the color of text and lines.
-Adjust the size of text, and change the type of lines, including modifying text when there is a BoS and CHoCH.
-Mark swing when there is a valid pullback, adjust the size and color.
INTERNAL STRUCTURE MAPPING
Body breaks confirm an internal structure break.
BULLISH & BEARISH INTERNAL STRUCTURE
Bullish Internal Structure:
-An internal high is validated with 4 optional criteria.
-An internal higher low is validated when the internal high structure is broken. A higher low refers to the lowest price.
Bearish Internal Structure:
-An internal low is validated with 4 optional criteria.
-An internal lower high is validated when the internal high structure is broken. A lower high refers to the highest price.
Settings
-Show or hide text and lines, including adjusting the color of text and lines.
-Adjust the size of text, and change the type of lines, including modifying text when there is a BoS and CHoCH.
-Mark swing when there is a valid pullback, adjust the size and color.
Validation of pullback has 4 options for exploration, with the default value set to Fractal CHoCH 1 time:
1.Fractal CHoCH 1 time.
2.Fractal CHoCH and wait for Fractal BoS/Fractal CHoCH 3 times in a row.
3.PIP Rule, using PIP to determine the distance of a valid pullback.
-Show or hide lines and values. This option will only display results when you activate the PIP Rule. Change the style of lines and change the color of lines.
-In the PIP field, enter the PIP value you want to explore. In the 1 PIP Size field, enter the decimal places in the asset you are trading. For example, for the EUR/USD pair with decimals at position 4.
4.ATR Rule, utilizing ATR multiples to establish the range of a valid pullback.
-Show or hide lines and values. This option will only display results when you activate the ATR Rule. Change the style of lines and change the color of lines.
-ATR type allows you to choose from 5 ma types. ATR Period adjusts the backward-looking average value you want to explore. Multiple: Enter a multiplier value for ATR to match the volatility or asset you are trading.
If you choose only ATR Rule, the result is the validation of the pullback with ATR Rule only. If you choose more than 1 option, whichever condition is true, the validation pullback occurs immediately. If you don't choose anything, the default value is Internal CHoCH 1 time.
Swing internal structure
-Show or hide text and lines, including adjusting the color of text and lines.
-Adjust the size of text, and change the type of lines, including modifying text.
Equilibrium internal
-Show or hide text and lines, including adjusting the color of text and lines.
-Adjust the size of text, and change the type of lines, including modifying text.
-Adjust the percentage of Equilibrium.
EXTERNAL STRUCTURE MAPPING
Body breaks confirm an internal structure break.
BULLISH & BEARISH EXTERNAL STRUCTURE
Bullish external Structure:
-An external high is validated with 4 optional criteria.
-An external higher low is validated when the external high structure is broken. A higher low refers to the lowest price.
Bearish external Structure:
-An external low is validated with 4 optional criteria.
-An external lower high is validated when the external high structure is broken. A lower high refers to the highest price.
Settings
-Show or hide text and lines, including adjusting the color of text and lines.
-Adjust the size of text, and change the type of lines, including modifying text when there is a BoS and CHoCH.
-Mark swing when there is a valid pullback, adjust the size and color.
Validation of pullback has 4 options for exploration, with the default value set to Internal CHoCH 1 time:
1.Internal CHoCH 1 time.
2.Internal CHoCH and wait for Internal BoS/Internal CHoCH 3 times in a row.
3.PIP Rule, using PIP to determine the distance of a valid pullback.
-Show or hide lines and values. This option will only display results when you activate the PIP Rule. Change the style of lines and change the color of lines.
-In the PIP field, enter the PIP value you want to explore. In the 1 PIP Size field, enter the decimal places in the asset you are trading. For example, for the EUR/USD pair with decimals at position 4.
4.ATR Rule, utilizing ATR multiples to establish the range of a valid pullback.
-Show or hide lines and values. This option will only display results when you activate the ATR Rule. Change the style of lines and change the color of lines.
-ATR type allows you to choose from 5 ma types. ATR Period adjusts the backward-looking average value you want to explore. Multiple: Enter a multiplier value for ATR to match the volatility or asset you are trading.
If you choose only ATR Rule, the result is the validation of the pullback with ATR Rule only. If you choose more than 1 option, whichever condition is true, the validation pullback occurs immediately. If you don't choose anything, the default value is Internal CHoCH 1 time.
Swing external structure
-Show or hide text and lines, including adjusting the color of text and lines.
-Adjust the size of text, and change the type of lines, including modifying text.
Equilibrium external
-Show or hide text and lines, including adjusting the color of text and lines.
-Adjust the size of text, and change the type of lines, including modifying text.
-Adjust the percentage of Equilibrium.
The values of these 4 options are: 1. PIP Rule in the internal structure 2. ATR Rule in the internal structure 3. PIP Rule in the external structure 4. ATR Rule in the external structure
These 4 options will be displayed only when the rule is selected along with choosing to display the value.
DISCLAIMER
All investments involve risks. Profit or loss depends on your knowledge, understanding, and decisions.
My scripts/indicators/strategies are created for researching past price behavior only. They are not investment advice, and future results are not guaranteed.

ICT Turtle Soup Ultimate V2📜 ICT Turtle Soup Ultimate V2 — Advanced Liquidity Reversal System
Overview:
The ICT Turtle Soup Ultimate V2 is a next-generation liquidity reversal indicator built on the principles of smart money concepts (SMC) and the classic ICT Turtle Soup setup. It is designed to detect false breakouts (liquidity grabs) at key swing points, enhanced by proprietary logic that filters out low-quality signals using a combination of trend context, kill zone timing, candle wick behavior, and multi-timeframe imbalance zones.
This tool is ideal for intraday traders seeking high-probability entry signals near liquidity pools and imbalance zones — where smart money makes its move.
🔍 What This Script Does
🧠 Liquidity Grab Detection (Turtle Soup Core Logic)
The script scans for recent swing highs/lows using a user-defined lookback.
A signal is generated when price breaks above/below a previous swing level but closes back inside — indicating a liquidity run and likely reversal.
A special Wick Trap Mode enhances this logic by detecting long-wick fakeouts — where the wick grabs stops but the candle body closes opposite the breakout direction.
📉 Trend Filter with ATR Buffer
Optional trend filter uses a simple moving average (SMA) to gauge market direction.
Instead of hard filtering, it applies an ATR-based buffer to allow for entries near the trend line, reducing signal suppression from micro-fluctuations.
🕰️ Kill Zone Session Filtering
Only show signals during institutional trading hours:
London Session
New York AM
Or any custom user-defined session
Helps traders avoid low-volume hours and focus on where stop hunts and price expansions typically occur.
🧱 Multi-Timeframe FVG Confluence (Optional)
Signal validation is strengthened by checking if price is within a higher timeframe Fair Value Gap — commonly used to identify imbalances or inefficiencies.
Filters out setups that lack underlying displacement or order flow justification.
🎨 Visual Feedback
Plots 🔺 bullish and 🔻 bearish markers at signal candles.
Optionally displays:
Swing High/Low Labels (SH / SL)
Reversal distance labels
Background color shading on valid signals
Includes built-in alerts for automated trade notification.
🔑 Unique Benefits
Wick Trap Detection: A proprietary approach to detecting stop hunts via wick behavior, not just candle closes.
ATR-based trend filtering: Avoids unnecessary filtering while still maintaining directional bias.
All-in-one system: No need to stack multiple indicators — swing detection, reversal logic, session filtering, and imbalance confirmation are all integrated.
💡 How to Use
Enable Wick Trap Mode to detect stealthy liquidity grabs with strong wicks.
Use Kill Zone filters to trade only when institutions are active.
Optionally enable FVG confluence to improve confidence in reversal zones.
Watch for Bullish signals near SL levels and Bearish signals near SH levels.
Combine with your own execution strategy or other SMC tools for optimal results.
🔗 Best Used With:
Maximize your edge by combining this script with complementary SMC-based tools:
✅ First FVG — Opening Range Fair Value Gap Detector
✅ ICT SMC Liquidity Grabs + OB + Fibonacci OTE Levels
✅ Liquidity Levels — Smart Swing Highs and Lows with horizontal line projections

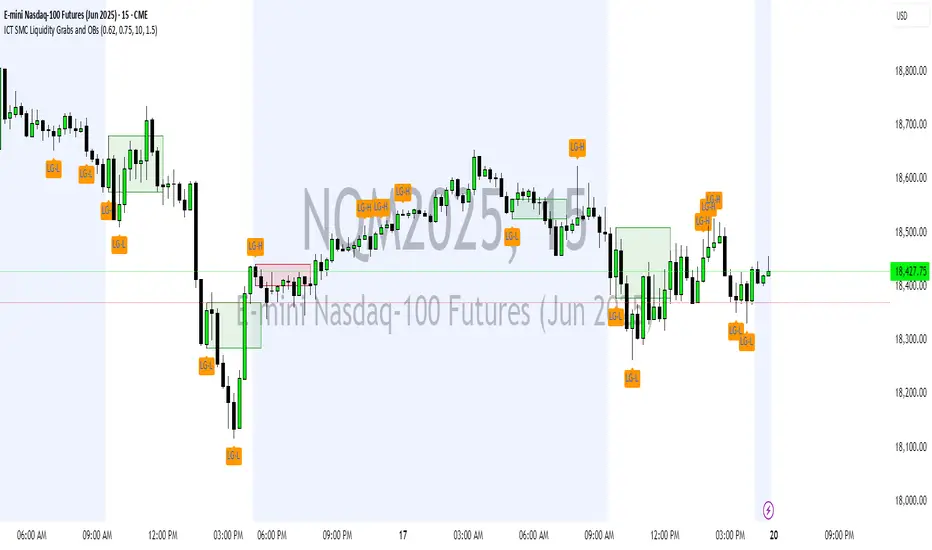
ICT SMC Liquidity Grabs and OBsICT SMC Liquidity Grabs + Order Blocks + Fibonacci OTE Levels
A High-Probability Entry Engine for Smart Money Concept Traders
This script combines three powerful Smart Money Concepts (SMC) into a single tool: Liquidity Grabs, Order Block Zones, and Fibonacci OTE Levels, allowing traders to identify institutional entry models with clean, rule-based visual signals.
It’s designed to simplify SMC trading by highlighting confluence zones where price is likely to reverse or continue — with clear visual zones, entry arrows, and take profit projections.
🔍 What This Script Does:
Detects Liquidity Grabs
Identifies when price sweeps above/below the highest high or lowest low within a user-defined lookback period and closes back inside.
Plots orange labels on the chart to signal potential liquidity events (LG-H / LG-L).
Plots Order Blocks After Liquidity Grabs
After a liquidity grab, the script looks for displacement candles (strong bullish or bearish moves) and draws highlighted OB zones extending several bars to the right.
These zones represent potential institutional footprints for price reversals.
Draws Fibonacci OTE Levels (Optimal Trade Entry)
Uses recent swing high and low pivots to automatically calculate OTE zones (default: 62% and 75% retracement levels).
Draws these retracement zones for both bullish and bearish setups.
Marks Valid OTE Entry Zones
Buy/Sell zones only trigger when:
A liquidity grab occurs,
Price enters the OTE zone,
And a strong confirming candle is present.
Plots green/red arrows for valid buy/sell OTE entries.
Auto-Draws Take Profit Zones
TP1 = Previous swing high/low
TP2 = Risk-based R-multiplied extension (e.g., 1.5R — customizable)
Alerts
Triggers alerts when valid buy or sell OTE setups are detected.
⚙️ Customization Features:
Toggle each feature: Liquidity Grabs, Order Blocks, Fibonacci OTE levels
Set Fibonacci retracement percentages (e.g., 0.62 / 0.75)
Adjust lookback window for liquidity detection
Customize the take-profit multiplier (R-based)
Full control over visuals: colors, labels, and lines
💡 How to Use:
Use this script to scan for high-confluence trade setups based on Smart Money principles.
Combine with session timing (e.g., New York open), major swing structure, or Kill Zone windows for maximum edge.
Look for arrows inside OB zones or OTE levels following liquidity sweeps for cleaner entries.
🔗 Works Best With:
✅ First FVG — Opening Range Fair Value Gap Detector: Identify early inefficiencies to set the narrative for the day.
✅ Liquidity Levels — Smart Swing Lows: Spot key structural lows that can fuel stop hunts and reversals.
✅ ICT Turtle Soup — Liquidity Reversal: Add a classic reversal pattern to your toolkit to catch fakeouts cleanly.
Together, these tools build a complete Smart Money ecosystem for entry precision, risk management, and price behavior forecasting.
02 SMC + BB Breakout (Improved)This strategy combines Smart Money Concepts (SMC) with Bollinger Band breakouts to identify potential trading opportunities. SMC focuses on identifying key price levels and market structure shifts, while Bollinger Bands help pinpoint overbought/oversold conditions and potential breakout points. The strategy also incorporates higher timeframe trend confirmation to filter out trades that go against the prevailing trend.
Key Components:
Bollinger Bands:
Calculated using a Simple Moving Average (SMA) of the closing price and a standard deviation multiplier.
The strategy uses the upper and lower bands to identify potential breakout points.
The SMA (basis) acts as a centerline and potential support/resistance level.
The fill between the upper and lower bands can be toggled by the user.
Higher Timeframe Trend Confirmation:
The strategy allows for optional confirmation of the current trend using a higher timeframe (e.g., daily).
It calculates the SMA of the higher timeframe's closing prices.
A bullish trend is confirmed if the higher timeframe's closing price is above its SMA.
This helps filter out trades that go against the prevailing long-term trend.
Smart Money Concepts (SMC):
Order Blocks:
Simplified as recent price clusters, identified by the highest high and lowest low over a specified lookback period.
These levels are considered potential areas of support or resistance.
Liquidity Zones (Swing Highs/Lows):
Identified by recent swing highs and lows, indicating areas where liquidity may be present.
The Swing highs and lows are calculated based on user defined lookback periods.
Market Structure Shift (MSS):
Identifies potential changes in market structure.
A bullish MSS occurs when the closing price breaks above a previous swing high.
A bearish MSS occurs when the closing price breaks below a previous swing low.
The swing high and low values used for the MSS are calculated based on the user defined swing length.
Entry Conditions:
Long Entry:
The closing price crosses above the upper Bollinger Band.
If higher timeframe confirmation is enabled, the higher timeframe trend must be bullish.
A bullish MSS must have occurred.
Short Entry:
The closing price crosses below the lower Bollinger Band.
If higher timeframe confirmation is enabled, the higher timeframe trend must be bearish.
A bearish MSS must have occurred.
Exit Conditions:
Long Exit:
The closing price crosses below the Bollinger Band basis.
Or the Closing price falls below 99% of the order block low.
Short Exit:
The closing price crosses above the Bollinger Band basis.
Or the closing price rises above 101% of the order block high.
Position Sizing:
The strategy calculates the position size based on a fixed percentage (5%) of the strategy's equity.
This helps manage risk by limiting the potential loss per trade.
Visualizations:
Bollinger Bands (upper, lower, and basis) are plotted on the chart.
SMC elements (order blocks, swing highs/lows) are plotted as lines, with user-adjustable visibility.
Entry and exit signals are plotted as shapes on the chart.
The Bollinger band fill opacity is adjustable by the user.
Trading Logic:
The strategy aims to capitalize on Bollinger Band breakouts that are confirmed by SMC signals and higher timeframe trend. It looks for breakouts that align with potential market structure shifts and key price levels (order blocks, swing highs/lows). The higher timeframe filter helps avoid trades that go against the overall trend.
In essence, the strategy attempts to identify high-probability breakout trades by combining momentum (Bollinger Bands) with structural analysis (SMC) and trend confirmation.
Key User-Adjustable Parameters:
Bollinger Bands Length
Standard Deviation Multiplier
Higher Timeframe
Higher Timeframe Confirmation (on/off)
SMC Elements Visibility (on/off)
Order block lookback length.
Swing lookback length.
Bollinger band fill opacity.
This detailed description should provide a comprehensive understanding of the strategy's logic and components.
***DISCLAIMER: This strategy is for educational purposes only. It is not financial advice. Past performance is not indicative of future results. Use at your own risk. Always perform thorough backtesting and forward testing before using any strategy in live trading.***

ICT SMT (fadi)The ICT SMT (fadi) Indicator is a powerful indicator inspired by the Inner Circle Trader (ICT) methodology, designed to identify Smart Money Technique (SMT) divergences between correlated assets. This indicator helps traders spot potential reversal points or trend shifts by comparing price action of a user-defined symbol (e.g., “ES1!” for E-mini S&P 500 futures) against the current chart’s price structure. Ideal for forex, indices, futures, and crypto markets, it highlights discrepancies in correlated asset behavior to enhance trading decisions.
These discrepancies occur when one asset shows signs of strength—such as holding support or rallying—while the other weakens or drops, signaling potential manipulation or a shift in smart money activity. This is relevant because it reveals where institutional traders may be accumulating or distributing positions, giving insight into impending trend changes. This indicator offers higher accuracy and detects nearly every SMT present on the chart by calculating multiple possibilities.
Features
• Smart Algorithmic detection of high probability SMTs
• Detect SMT with two other symbols
• Detect 2-Candle SMT as an additional configurable option
• Confirmation and Invalidation levels
• Expand or narrow the detection range by changing the number of pivots to use
• Raise alerts when SMT has been detected
Usage
1. Apply the indicator to your chart.
2. In the settings, input a correlated symbol (e.g., “NQ1!” for Nasdaq futures if charting “ES1!”, or “EURUSD” if analyzing “GBPUSD”).
3. Monitor the plotted markers and labels:
• Green markers for bullish divergences.
• Red markers for bearish divergences.
4. Combine with other ICT concepts (e.g., order blocks, liquidity zones) for higher-probability setups.
Best Practices
• Pair with strongly correlated assets (e.g., ES vs. NQ, EURUSD vs. GBPUSD) for reliable signals.
• Backtest on your chosen market to confirm effectiveness.
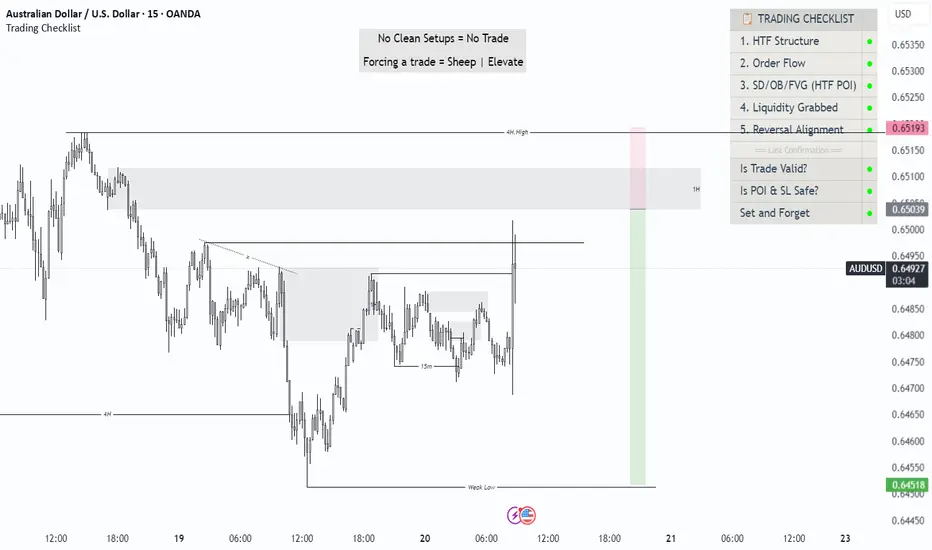
Trading ChecklistTrading Checklist Indicator - Your Trading Plan Companion
A clean and efficient visual checklist to maintain trading discipline and consistency. This indicator helps traders follow their trading plan systematically by providing an easy-to-use checklist of key confirmation points.
Features:
- Visual checklist with clear green/red status indicators
- Clean, non-intrusive interface
- Real-time status updates
- Easy toggle controls for each item
Key Checkpoints:
1. HTF Structure Analysis
2. Order Flow Confirmation
3. SD/OB/FVG (HTF POI) Identification
4. Liquidity Grab Verification
5. Reversal Alignment Check
Final Confirmations:
- Trade Validity Check
- POI & Stop Loss Safety
- Set and Forget Status
How to Use:
1. Add the indicator to your chart
2. Use the Settings panel to toggle each condition
3. Green dots indicate confirmed conditions
4. Red dots show pending confirmations
5. Verify all conditions before executing trades
Note: This indicator helps maintain trading discipline but should be used alongside proper technical and fundamental analysis.
Tags: #TradingChecklist #RiskManagement #TradingPlan #Trading #Technical #Strategy #Discipline
Easy SMT Panel [smart-money-indicators]This indicator is the ultimate tool for identifying divergences between two instruments.
This indicator does not provide entry or exit signals.
This indicator is a tool to mark key price areas.
This indicator is a tool to mark key time areas.
This indicator is particularly distinguished by its high customizability of tools,
setting it apart from the indicators currently available on the TradingView platform.
No more annoying switching between instruments across two layout windows! Depending on the instrument in the main window, specify which instrument should be displayed in the panel!
It's up to you to decide the criteria for determining divergences, as this indicator highlights the following key areas using lines and boxes:
Structure Breaks:
- Bearish Change of Character
- Bearish Break of Structure
- Bullish Change of Character
- Bullish Break of Structure
Premium / Discount Area:
- Premium / Discount area of the current range, since the last Change of Character or Break of Structure
Liquidity Areas:
- Asia Session (during or after the session)
- London Session (during or after the session)
- New York Session (during or after the session)
- London Close Session (during or after the session)
- Session Quarters
- Central Banks Dealer Range
How can I use or interpret these areas?
Structure Breaks:
- Has Instrument 1 experienced a structure break at a high/low, but Instrument 2 has not? This could indicate a divergence!
Liquidity Areas:
- Has Instrument 1 already broken a session high/low, but Instrument 2 has not? This could indicate a divergence!

Ultimate SMC [smart-money-indicators] This indicator is a tool to support the "SMC" strategy.
This indicator does not provide entry or exit signals.
This indicator is a tool to mark key price areas.
This indicator is a tool to mark key time areas.
This indicator is particularly distinguished by its high customizability of tools,
setting it apart from the indicators currently available on the TradingView platform.
Moreover, unlike other "SMC indicators," this one does NOT use pivot points to identify Change of Character (ChoCh) or Break of Structure (BoS).
The following key areas are marked with lines or boxes:
Structure Breaks:
- Bearish Change of Character
- Bearish Break of Structure
- Bullish Change of Character
- Bullish Break of Structure
Premium/Discount Zone:
- Premium/Discount area of the current range, since the last ChoCh or BoS
Potential Buy/Sell Zones (including historical or mitigated):
- Bullish orderblocks
- Bearish orderblocks
Momentum Indicators:
- Bullish Fair Value Gaps
- Bearish Fair Value Gaps
How can I use or interpret these areas?
Structure Breaks:
- If the indicator shows bullish structure breaks in the form of ChoCh or BoS, it indicates a bullish trend.
- If the indicator shows bearish structure breaks in the form of ChoCh or BoS, it indicates a bearish trend.
Premium/Discount Zone:
- If the price is in the premium zone, it indicates that the current price is "expensive," and you should look for sell signals.
- If the price is in the discount zone, it indicates that the current price is "cheap," and you should look for buy signals.
Order Blocks:
- Bearish order blocks indicate strong selling pressure in that area, and you can look for sell signals.
- Bullish order blocks indicate strong buying pressure in that area, and you can look for buy signals.
Momentum Indicators:
- Bullish Fair Value Gaps that form after the creation of an order block may indicate strong buying pressure and confirm a bullish trend.
- Bearish Fair Value Gaps that form after the creation of an order block may indicate strong selling pressure and confirm a bearish trend.

Smart Money Setup 07 [TradingFinder] Liquidity Hunts & Minor OB🔵 Introduction
The Smart Money Concept relies on analyzing market structure, tracking liquidity flows, and identifying order blocks. Research indicates that traders who apply these methods can improve their accuracy in predicting market movements by up to 30%.
These elements allow traders to understand the behavior of market makers, including banks and large financial institutions, which have the ability to influence price movements and shape major market trends. By recognizing how these entities operate, traders can align their strategies with Smart Money actions and better anticipate shifts in the market.
Smart Money typically enters the market at points of high liquidity where trading opportunities are more attractive. By following these liquidity flows, professional traders can position themselves at market reversal points, leading to profitable trades.
The Smart Money Setup 07 indicator has been specifically designed to detect these complex patterns. Using advanced algorithms, this indicator automatically identifies both bullish and bearish trading setups, assisting traders in discovering hidden market opportunities.
As a powerful technical analysis tool, the Smart Money Setup indicator helps predict the actions of major market participants and highlights optimal entry and exit points. Essentially, this tool enables traders to act like institutional investors and market makers, making the most of price fluctuations in their favor.
Ultimately, the Smart Money Setup 07 indicator transforms complex technical analysis into a simple and practical tool. By detecting order blocks and liquidity zones, this tool helps traders execute their strategies with greater precision, leading to more informed and successful trading decisions.
🟣 Bullish Setup
🟣 Bearish Setup
🔵 How to Use
One of the key strengths of the Smart Money Setup 07 indicator is its ability to accurately identify order blocks and analyze liquidity flows. Order blocks represent areas where large buy or sell orders are placed by Smart Money investors, which often indicate key reversal points in the market. Traders can use these order blocks to pinpoint potential entry and exit opportunities.
The Smart Money Setup indicator detects and visually displays these order blocks on the chart, helping traders identify the best zones to enter or exit trades. Since these zones are frequently used by large institutional investors, following these blocks allows traders to capitalize on price fluctuations and trade with confidence.
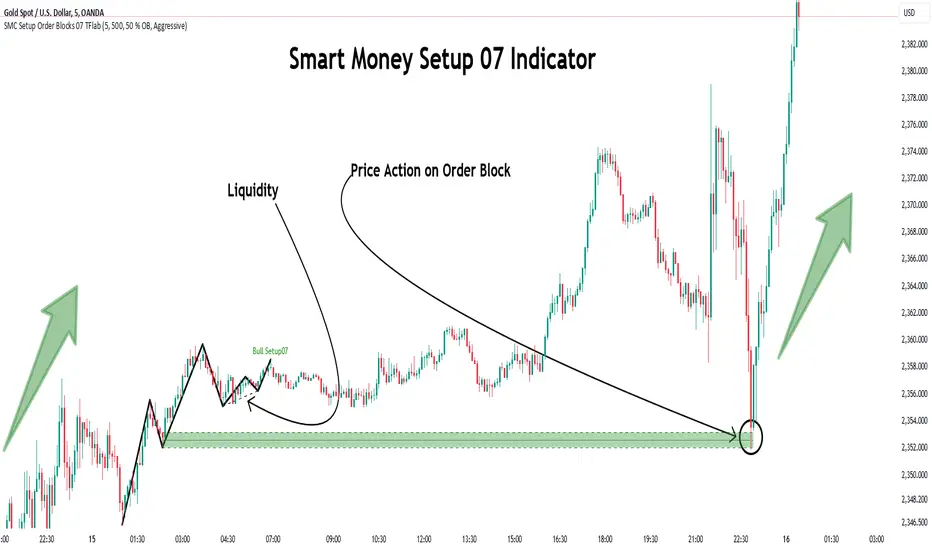
🟣 Bullish Smart Money Setup
A Bullish Smart Money Setup forms when the market creates Higher Lows and Higher Highs. In this situation, the indicator analyzes pivot points, liquidity flows, and order blocks to identify buy opportunities. Liquidity points in these setups indicate areas where Smart Money is likely to enter long positions.
In the bullish setup image, multiple Higher Lows and Higher Highs are formed. The green zone represents a Bullish Order Block, signaling traders to enter a long trade. The Smart Money Setup indicator displays a green arrow, indicating a high-probability upward price movement from this liquidity zone.
🟣 Bearish Smart Money Setup
A Bearish Smart Money Setup occurs when the market structure shows Lower Highs and Lower Lows, indicating weakness in price. The indicator identifies these patterns and highlights potential sell opportunities. Liquidity points in this setup mark areas where Smart Money enters sell positions.
In the bearish setup image, a Lower High is followed by a Lower Low, with the red liquidity zone acting as a Bearish Order Block. The Smart Money Setup indicator shows a red arrow, signaling a likely downward move, offering traders an opportunity to enter short positions.
🔵 Settings
Pivot Period : This setting determines how many candles are needed to form a pivot point. A default value of 2 is optimal for quickly identifying key pivot points in price action.
Order Block Validity Period : This parameter defines the lifespan of an order block. Traders can adjust how long each order block remains valid. For instance, setting it to 500 means that an order block will be valid for 500 bars after its formation.
Mitigation Level OB : This setting allows traders to select whether order blocks should be based on the "Proximal," "50% OB," or "Distal" levels, helping traders manage risk more effectively.
Order Block Refinement : Traders can refine the order blocks with precision. The indicator offers two refinement modes: Defensive and Aggressive. The Defensive mode identifies safer order blocks, while the Aggressive mode targets higher-risk blocks with the potential for larger reversals.
🔵 Conclusion
The Smart Money Setup 07 indicator is a powerful tool for identifying key Smart Money movements in the market. It provides traders with essential insights for making informed trading decisions, particularly when combined with technical analysis and liquidity flow analysis. This indicator allows traders to accurately pinpoint entry and exit points, helping them maximize profits and minimize risk.
By offering a range of customizable settings, the Smart Money Setup indicator adapts to different trading styles and strategies. Furthermore, its ability to detect order blocks and identify supply and demand zones makes it an indispensable tool for any trader looking to enhance their strategy.
In conclusion, the Smart Money Setup 07 is a crucial tool for traders aiming to optimize their trading performance. By utilizing the concepts of Smart Money in technical analysis, traders can make more precise decisions and take advantage of market fluctuations.
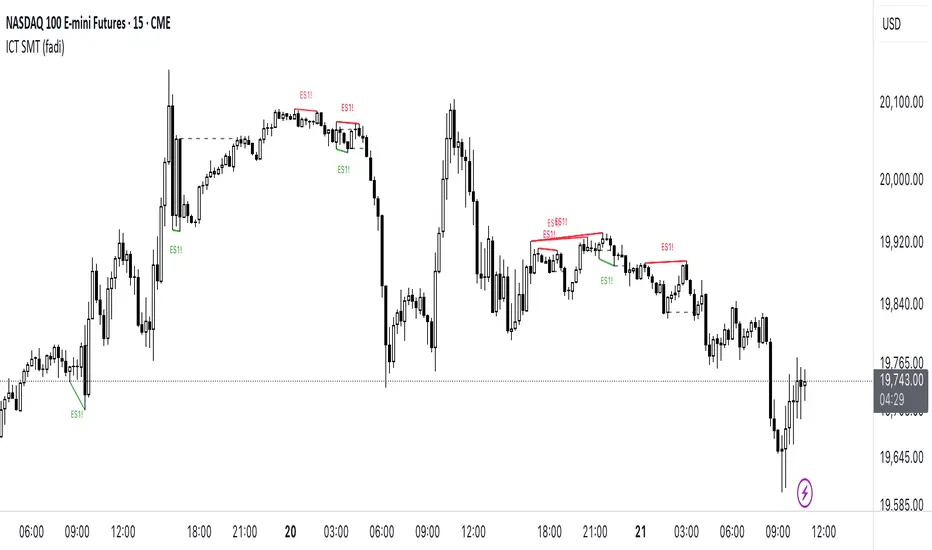
SMT Divergences [OutOfOptions]Smart Money Technique (SMT) Divergence is designed to identify discrepancies between correlated assets within the same timeframe. It occurs when two related assets exhibit opposing signals, such as one forming a higher low while the other forms a lower low. This technique is particularly useful for anticipating market shifts or reversals before they become evident through other Premium Discount (PD) Arrays.
This indicator works by identifying the highs and lows that have formed for an asset on the current chart and the correlated symbol defined in the settings. Once a pivot on either asset is formed, it checks if the pivot has taken liquidity as identified by the previous pivot in the same direction (i.e., a new high taking out a previous high). If this is the case and the corresponding asset has not taken a similar pivot, the condition is determined to be a potential valid divergence. The indicator will then filter out SMTs formed by adjacent candles, requiring at least one candle difference between the candles forming the SMT.
If the “Candle Direction Validation” setting is enabled, the indicator will further check both assets to ensure that for bullish SMTs, the last high on both assets was formed by down candle, and for bearish SMTs, the low was formed by an up candle. This check can often eliminate low-probability SMTs that are frequently broken.
The referenced chart shows divergence between Nasdaq (NQ) and S&P 500 (ES) futures, which are normally closely correlated assets that move in the same direction. The lines shown represent bullish and bearish divergences between the two when they are formed. As you can see from the chart, SMT Divergences may not always indicate a reversal, or a reversal might be just a short-term retrace. Therefore, SMT Divergences should not be used independently. However, in conjunction with other PD arrays, they can provide strong confirmation of a change in market direction.
Configurability:
Pivot strength - Indicates how many bars to the left/right of a high for pivot to be considered, recommended to keep at 1 for maximum detection speed
Candle Direction Validation - Additional SMT validation to filter out weak/low-probability SMTs be examining candle direction
Line Styling for Bullish/Bearish SMTs - Ability to customize line style, color & width for bullish/bearish SMTs
Label Control - Whether or not to show SMT label and if shown what font size & color should be used
What makes this indicator different:
Unlike other SMT indicators, this indicators has additional built-in controls to remove low-probability SMTs

Relative Equal Highs/LowsThis Pine script indicator is designed to create a visual representation of the relative equal highs & lows formed and automatically removed mitigated ones. Unlike indicators designed to show exact equal high/lows this indicator allows a small, configurable degree of variance between price to identify areas where price stops.
Relevance:
Relative Equal highs and lows can serve as valuable tools in identifying potential shifts in trend direction. They come into play when the price hits a support or resistance level and can’t advance further, signaling a possible reversal or pivot point. When the price sufficiently retreats from these levels, relative equal highs and lows can also indicate liquidity draws where buy/sell stops might be positioned, in accordance with SMC/ICT concepts.
How It Works:
The indicator tracks all unmitigated highs & lows within the chart’s present timeframe, limited to the user-defined max bars lookback for optimal performance. If the prices are within the configured variance they are marked as relatively equal and at that point are visually identified by a horizontal line, which connects the two (or more) points of price. Depending on configuration of the indicator, a line is rendered from the 1st, last or both values within the relatively equal range of price. A unique feature of this indicator is its ability to remove the line once the price mitigates the relative equal high/low by falling below the lows or rising above highs. This ensures the chart remains uncluttered and highlights only the currently relevant levels, setting it apart from other indicators providing similar functionality.
Configurability:
The indicator offers five style settings for complete customization of the lines that represent equal highs/lows. These settings include line style, color, and width, along with an option to extend the lines to the right of the chart for enhanced visibility of equal high/low levels. To optimize performance, the indicator allows users to configure the lookback length, determining how far back the price history should be examined. In most instances, the default setting of 500 bars proves more than adequate. Additionally, you can set thresholds via separate configs for stocks & indices that will determine if the price is relatively equal and lastly allow you to configure where the indicator line should be drawn, the first, last or all the values.
Additional notes:
This uses a different approach then my “equal highs/lows” indicator to identify price levels and because it focuses specifically on relative as opposed to exact values it is entirely different and may show “weaker”, but still important levels of liquidity. This indicator is more suited for analysis of stocks and indices or higher-timeframes where price-action rarely forms exact equal values instead more frequently forming almost equal values. My other indicator is more suited for smaller (15m or less) timeframe on indices where exact equal prices are often identical. Depending on situation different indicators should be used.

Equal Highs and LowsDescription:
The ‘Equal Highs and Lows’ indicator is a technical analysis tool that marks identical price levels on a trading chart using the current time-frame, assisting traders in identifying potential support and resistance zones or liquidity draws. It creates a horizontal line connecting points where the price has created equal highs and lows within a specified lookback period. Unique to this tool, it maintains a clean chart by removing the line once the price surpasses the equal highs or falls below the equal lows, ensuring only the currently relevant equal highs and lows are highlighted.
Features:
Customization Options: Users can adjust the appearance of the lines (color, width, and style) to match their chart setup or preferences. Users can also choose to extend the lines marking the equal highs/lows to the right of the chart making the equal high/low levels more easier to visualize.
User-Defined Lookback Length: The number of bars to look back for finding equal highs and lows can be set by the user, allowing for flexibility in different market conditions.
How It Works:
The indicator meticulously scans the chart over a user-specified lookback duration, identifying bars with matching high or low values that have not been mitigated on the current chat timeframe, thereby constructing an index of equal values. It subsequently connects these equal values on the chart with a line. While this intuitive indicator does not forecast future market trends, it emphasizes significant price levels derived from historical data.
Usage:
Identifying Support and Resistance: The lines drawn by the indicator can be used to identify potential support and resistance zones and/or draws of liquidity, which are crucial for making informed trading decisions.
Strategy Development: Traders can incorporate the visual cues provided by the indicator into their trading strategies, using them as one of the factors for entry or exit decisions.
Originality:
This indicator presents a distinctive method for pinpointing and illustrating equal highs and lows, granting traders a crucial insight into key price levels. It stands apart from conventional indicators by offering extensive personalization and employing a novel approach to augment chart analysis. Uniquely, it retains only unmitigated equal high/low levels on the chart, automatically discarding mitigated price levels once the price has reached that level.
Conclusion:
The "Equal Highs and Lows" indicator is a practical tool for traders looking to enhance their chart analysis with visual cues of significant price levels. Its customization options and innovative approach make it a valuable addition to the trading toolkit, suitable for various trading styles and strategies.

Smart Money Setup 06 [TradingFinder] Liquidity Sweeps + OB Swing🔵 Introduction
Smart Money, managed by large investors, injects significant capital into financial markets by entering real capital markets.
Capital entering the market by this group of individuals is called smart money. Traders can profit from financial markets by following such individuals.
Therefore, smart money can be considered one of the effective methods for analyzing financial markets.
Sometimes, before a market movement, fluctuation movements that create price movement cause many traders' "Stop Loss" to be triggered. These movements are created in various patterns.
One of these patterns is similar to an "Expanding Triangle", which touches the stop loss of individuals who have placed their stop loss in the cash area in the form of 5 consecutive openings.
To better understand this setup, pay attention to the images below.
Bullish Setup Details :
Bearish Setup Details :
🔵 How to Use
After adding the indicator to the chart, wait for trading opportunities to appear. By changing the "Time Frame" and "Pivot Period", you can see different trading positions.
In general, the smaller the "Time Frame" and "Pivot Period", the more likely trading opportunities will appear.
Bullish Setup Details on Chart :
Bearish Setup Details on Chart :
🔵 Settings
You have access to "Pivot Period", "Order Block Refine", and "Refine Mode" through settings.
By changing the "Pivot Period", you can change the range of zigzag that identifies the setup.
Through "Order Block Refine", you can specify whether you want to refine the width of the order blocks or not. It is set to "On" by default.
Through "Refine Mode", you can specify how to improve order blocks.
If you are "risk-averse", you should set it to "Defensive" mode because in this mode, the width of the order blocks decreases, the number of your trades decreases, and the "reward-to-risk ratio "increases.
If you are on the opposite side and are "risk-taker", you can set it to "Aggressive" mode. In this mode, the width of the order blocks increases, and the likelihood of losing positions decreases.

Market Structure (Range) & Internal Liquidity
This indicator will simplify the price-action reading of any trader/investor by decluttering his/her charts from un-important & confusing candles to highlight the true momentum candles which are usually formed by institutional buying/selling .
The indicator will be a good tool in the arsenal of the following styles of Trading/Investing
Smart Money / Liquidity Concepts
Price Action Concepts
Demand & Supply Concepts
Support & Resistance Concepts
UNIQUE FEATURES:
1. Market Structure - Range & Internal Liquidity:
Unlike other liquidity indicators, this indicator only highlights liquidity levels of significant importance. Not every intermediate high & low in a chart are worthy of noticing, hence by enabling the 'Swings' & 'Range (BoS)' feature in the indicator settings, the structure highs and lows (external liquidity) in a chart can be identified.
Any other liquidity levels within a market range (Range between structural High & Low) is known as internal liquidity which price targets to collect enough orders before heading towards the external liquidity levels.
2. Gaps (Fair Value Gaps / Imbalance):
Not every imbalance / gap between candles are important & trade-worthy. This feature of the indicator is different from the other widely available imbalance indicators & only highlights gaps formed by true momentum candles. Gaps between unimportant inside bars are not highlighted, as these bars occur in the absence of momentum.
3. True Price Action:
Looking at the two charts below, we can clearly observe the difference between price action of a confusing normal chart & the simplified price action highlighted by the indicator. This feature declutters the charts by only highlighting the candles a trader / investor should notice in a chart.
This feature when used in confluence with the liquidity levels feature & gap feature of the indicator, helps identify the true demand & supply zones (order blocks) in a chart.
Before
After
4. Zig Zag Lines:
This unique feature which is useful to Identify & Backtest different entry types taught by Smart Money Traders . This feature helps the trader understand the True Fractal Nature of price. This can also be seen as an alternate to the default line chart feature.
Examples of Entry Types taken by Smart Money Traders
ADDITIONAL FEATURES:
(These features are essential addons to trade liquidity. However, these are derived from publicly available indicators from the Tradingview library, but with a different interpretation for a better visualization of charts & or to time better trade entries without cluttering the charts)
a. Inside Bar & Outside Bars:
Identify not just a single Inside Bar as highlighted by other indicators, but to highlight a series of candles which are within a master candle range and are exhibiting unimportant sideways price action.
Outside Bars only relevant to momentum candles are highlighted, ignoring candles that occur within a master candle range. Highs & Lows of such Outside Bars are used by aggressive traders to identify liquidity levels in the charts.
b. Highs & Lows of previous Monthly / Weekly / Daily & Hourly Candles:
This feature draws Highs & Lows of previous Monthly / Weekly / Daily & Hourly Candles on the extreme right hand side of the chart to keep the charts clean.
Additionally for Hourly time frame, the indicator includes a setting to select the hourly candle time frame (60 min / 75 min / 240 min), which are personal and different for each trader.
UNDERLYING CONCEPT:
In the image below we see how a large majority of Traders / Investors incorrectly mark Structure markings, mistaking a raid of internal liquidity as a Break of Structure, thereby taking trades opposite to the broader trend of the markets
However, this indicator has a higher accuracy of identifying the correct price structure by only marking a structure high or low, when a subsequently opposite side liquidity is taken/raided. Further the broader trend of the markets can be easily identified by looking as to which side the Break of Structure has happened. (This is visible in the indicator in the form of 'Range' feature, so if a Range High is broken then it is understood to be in an uptrend & vice versa)
The underlying core functionality of the indicator is best displayed by the image below
USECASE OF THE INDICATOR:
Before taking any Buying/Selling position in the markets, a Trader / Investor must analyze the price action on the following parameters
HTF & LTF Trend Identification (To judge if trade is Pro-Trend or Counter-Trend)
Is Price at a High Probability Area of Interest?
Is Price satisfying the trade entry conditions?
Let us see how this indicator can be used as a complete trading system in itself and addresses each of the above parameters
Disclaimer: Illustrations shown below are just for understanding the features of the indicator & does not guarantee profitability. Every trader must back test their setups to arrive at a setup with an edge (positive expectancy) before they start actively trading the setup.
1. HTF & LTF Trend Identification (Pro-Trend / Counter-Trend) using 'Range (BoS)' feature of the indicator
Let's assume a Day Trader, uses hourly chart (75 min) to frame his Higher Time Frame (HTF) ideas & 15min charts (LTF) for trade entries
Looking at the chart below the Trader concludes that the HTF has most recently broken the structure to the downside and is considered Bearish till price action is below the range high of 48600 levels. It can also be concluded that the price is currently in a Bullish retracement.
The Trader can choose to take both Pro-Trend or Counter-Trend Trades, timing the trade entries using the LTF charts.
Looking at the LTF chart below, it is evident that price on LTF has also broken structure to the downside and is now aligned with the HTF Bearish Trend. The Trader will now look to get into short trades, to take trades both in line with HTF & LTF trend.
2. Let's identify if Price is at a High Probability Area of Interest, using either single or combination of the 'Swings' / 'Gaps' / 'Outside Bars' / 'HL of previous M,W,D, H candles' features of the indicator
Definition of High Probability Level / Area differs from each Traders perspective depending upon which of the Trading Styles (mentioned in the beginning) does one use.
Smart Money Traders
SMC Traders are known to get into trades early and their high R:R trades are taken mostly at a High Probability Area of Interest which are identified by them on HTF, by looking for candles with imbalance (gaps) & or candles which have taken out a previous liquidity and then having creating imbalance (gaps).
Also Turtle Soups is one of the favorite setups for SMC traders, where a trader enters a trade on LTF (typically 1 min/3min & 5min) after grabbing HTF liquidity lying at H/L of outside bar / previous monthly, weekly, daily or hourly candles.
Demand & Supply Traders
Some of the Best Demand & Supply Traders have the patience to wait for trades and take trades at the extreme Demand & Supply Zones within a market Range.
As illustrated below, the extreme hourly supply zone just below the structure high, which has the confluence of imbalance and Bearish HTF confirmation resulted in a good R:R trade.
Price Action Traders & Support & Resistance Traders
From the illustration below we can see how the 15 min Range breakdown confirms the breakdown of the Inverted Cup Pattern for Price Action Traders & Support & Resistance Traders using the same area of breakdown as the new Resistance to enter Short trades
3. Let's identify if Price is satisfying the Trade Entry Conditions using the 'Zig-Zag Lines' feature
Statistics say that majority (> 80%) of Traders blow up their accounts multiple times or completely give up and never achieve profitability.
One of the primary reasons for this is Traders punching trades randomly and without having proper Setup or rules for entering Trades.
Also in order to arrive at rules or execute the different entry models (couple of examples highlighted earlier) taught by different Trainers, a Trader needs to learn to visualize charts in a similar format to what the trainers are teaching.
The Zig-Zag lines feature is a form of line chart that joins the swing high points to the swing low points on the chart to represent the True Price action & a proper fractal nature of the markets, unlike the line chart which is formed by only by joining the closing value of each candle.
From the image below we can see that the Zig-Zag lines feature eliminates the randomness visible in the line chart and is a more smoother chart. Using this feature one can back test the various entry models widely available on the internet or arrive at a user specific model which he/she is comfortable with.
CONCLUSION:
Trading with a deeper understanding of Price Action allows a Trader/Investor to enter or exit trades with ease. Price Action trading allows individuals to keep their charts clean and stay away from the other lagging technical indicators and enter trades much earlier than other technical indicators.
This indicator attempts in simplifying the understanding of price action for every one and identify potential high probability areas / levels where one should enter / exit trades.
This indicator will be an important tool in the arsenal of any Trader / Investor to take better informed trades, however it does not guarantee profitability of a Trader, due to the randomness of the markets & external factors that influence each trader.
GET ACCESS:
Refer Author's instructions below to get access to the indicator
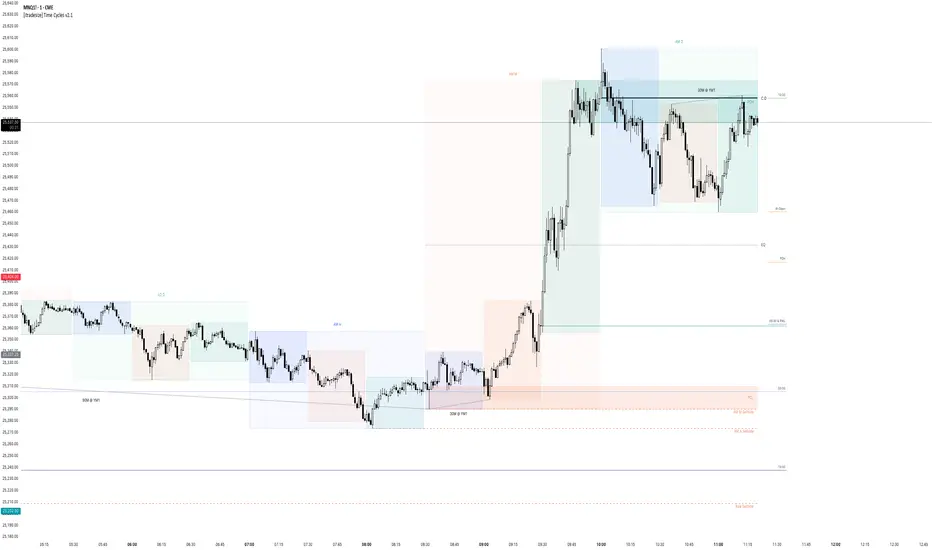
itradesize /\ Time Cycles x ZeussyI created this script based on Zeussy's & TOTK time cycle tweets.
The base 90-minute cycle starts at 2:30 AM NY time. For the best outcome, trade only during the New York AM & PM cycles. If you are a London trader, use mainly the Asian high and low instead of those 90-minute cycles as the algorithm mostly refers to them instead of the 90M cycles high or low.
In the current time cycle, we use the high and low of the previous cycle(s) to determine order flow.
During the current time cycle, IPDA refers to the previous cycle(s) as high or low. How the price reacts to these price levels is crucial for measuring order flow.
Every turning point in the market is timed and predetermined beforehand. The importance of timing can be seen by glancing at the history of the charts.
To measure order flow, we look for the following signs of reversal or continuation:
- If the price was bullish but does not find support at the previous cycle's high after breaking above it, it is the first warning sign that the order flow is potentially changing.
- If the price was bearish but does not find resistance at the previous cycle's low after breaking below it, it is the first warning sign that the order flow is potentially changing.
- If the price is bullish, then it should find support at the previous cycle's high after breaking above it.
- If the price is bearish, then it should find support at the previous cycle's low after breaking below it.
Each cycle has its Accumulation , Manipulation , and Distribution (AMD) characteristics within the larger sessions.
Even smaller cycles have these characteristics too. You can divide them further or add them up to get a more complex picture.
The indicator primarily shows the 90-minute cycles, but you can also view the multiples of 90-minute cycles to get a higher 270-minute picture. You can even divide them further into 30-minute cycles. (These 30-minute cycles can also be divided into 10-minute cycles.)
The AM sessions are from:
- 07:00 - 8:30
- 8:30 - 10:00
- 10:00 - 11:30
The PM sessions are from:
- 11:30 - 13:00
- 13:00 - 14:30
- 14:30 - 16:00
Regarding the features of the indicator, you can show the cycles as dividers or use boxes to highlight them.
The indicator also comes with a pivot high & low for the 90-minute cycles, which means the script automatically lengthens the high or low of the former 90-minute cycle until it's taken. If it has not been taken until the 90-minute cycle ends, it stops drawing.
Liquidity Finder🔵 Introduction
The concept of "liquidity pool" or simply "liquidity" in technical analysis price action refers to areas on the price chart where stop losses accumulate, and the market, by reaching those areas and collecting liquidity (Stop Hunt), provides the necessary energy to move the price. This concept is prominent in the "ICT" and "Smart Money" styles. Imagine, as depicted below, the price is at a support level. The general trader mentality is that there is "demand" for the asset at this price level, and this demand will outweigh "supply" as before. So, it is likely that the price will increase. As a result, they start buying and place their stop loss below the support area.
Stop Hunt areas are essentially traders' "stop loss" levels. These are the liquidity that institutional and large traders need to fill their orders. Consequently, they penetrate the price below support areas or above resistance areas to touch their stop loss and fill their orders, and then the price trend reverses.
Cash zones are generally located under "Swings Low" and above "Swings High." More specifically, they can be categorized as support levels or resistance levels, above Double Top and Triple Top patterns, below Double Bottom and Triple Bottom patterns, above Bearish Trend lines, and below Bullish Trend lines.
Double Top and Triple Top :
Double Bottom and Triple Bottom :
Bullish Trend line and Bearish Trend line :
🔵 How to Use
To optimally use this indicator, you can adjust the settings according to the symbol, time frame, and your needs. These settings include the "sensitivity" of the "liquidity finder" function and the swing periods related to static and dynamic liquidity lines.
"Statics Liquidity Line Sensitivity" is a number between 0 and 0.4. Increasing this number decreases the sensitivity of the "Statics Liquidity Line Detection" function and increases the number of lines identified. The default value is 0.3.
"Dynamics Liquidity Line Sensitivity" is a number between 0.4 and 1.95. Increasing this number increases the sensitivity of the "Dynamics Liquidity Line Detection" function and decreases the number of lines identified. The default value is 1.
"Statics Period Pivot" is set to 8 by default. By changing this number, you can specify the period for the static liquidity line pivots.
"Dynamics Period Pivot" is set to 3 by default. By changing this number, you can specify the period for the dynamic liquidity line pivots.
🔵 Settings
Access to adjust the inputs of Static Dynamic Liquidity Line Sensitivity, Dynamics Liquidity Line Sensitivity, Statics Period Pivot, and Dynamics Period Pivot is possible from this section.
Additionally, you can enable or disable liquidity lines as needed using the buttons for "Show Statics High Liquidity Line," "Show Statics Low Liquidity Line," "Show Dynamics High Liquidity Line," and "Show Dynamics Low Liquidity Line."

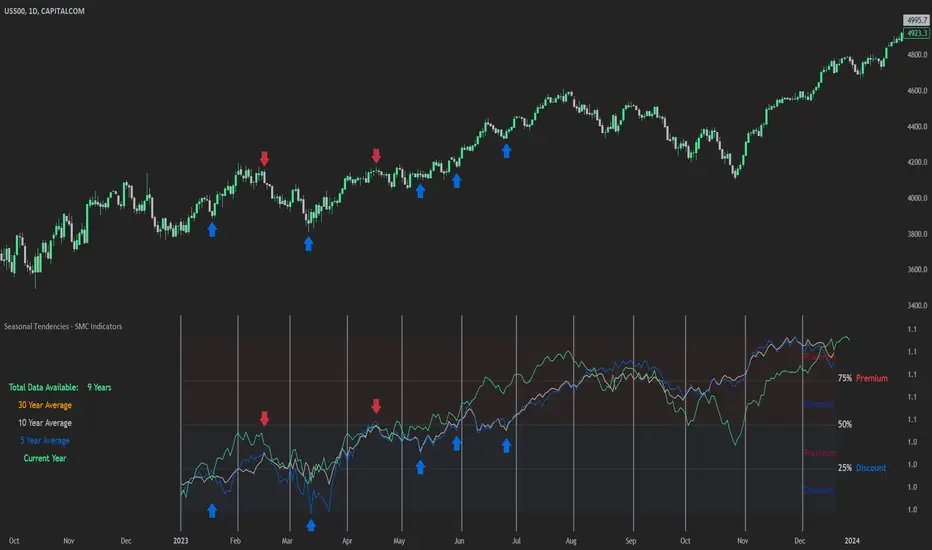
Seasonal Tendencies - SMC IndicatorsA Seasonal Tendency refers to a historical price action behaviour that tends to repeat during specific times of the year, month over month.
It's a roadmap to navigate price action on the daily chart to help determine the medium to long-term bias.
Seasonal Tendencies are NOT an exact prediction of future price action but rather serve as a guideline for spotting high-probability opportunities when combined with other elements of SMC Price Action analysis, such as Order Blocks, Fair Value Gaps, etc...
The Seasonal Tendencies Indicator has been tested to match what ICT has taught in his lectures. It can be applied to any Market or Asset. However, it's limited by the maximum number of years available on tradingview.
Traders can use this Seasonal Tendencies indicator to support their already existing analysis as an added confirmation tool. This indicator should not be used as a main reason to enter a trade idea.
The Seasonal Tendencies Indicator can be used in 2 ways:
1) To look for potential points of long-term reversals during specific times of the year.
2) To look for confirmation and align with an existing long-term trend.
So how does it work?
The Seasonal Tendencies Indicator takes the averages of the last 30, 10, and 5 years' prices by default and compares them to the current year's price action (Green Line).
However, the number of years chosen for the averages can be modified in the indicator's setting.
When looking at the historical price action lines, generally, the price tends to make the lows and highs during specific times of the year.
Note that we should not look at the exact dates these lows and highs form, but we take time periods conceptually instead.
In the example below, the SP500 5-year average made the low on 14 March, and the SP500 10-year average made the low on 23 March.
This gives us the idea that "generally" SP500 makes the low of the year around the 2nd to 3rd week of March every year.
So, IF the trader's analysis was pointing out that SP500 is Bullish, then we use the information that we derived from the Seasonal Tendencies Indicator to look for long setups around the 2nd to 3rd week of March for medium to long-term swing trades.
The Seasonal Tendencies Indicator can also be useful for day traders as it helps support their daily bias to look for trades within the direction of the higher timeframe trend.
How do we measure the strength of the Seasonal Tendencies?
When using the Seasonal Tendencies Indicator, it's important to look for periods where the averages converge and get closer to each other. This usually indicates that during those specific periods, there is a high probability for the price to behave in a certain way.
So the closer the averages are to each other, the more likely the price would respect the Seasonal Tendencies.
Bonus Feature
Premium Discount Range
As a bonus feature, split the Seasonal Tendencies Indicator's Range into 4 quarters to indicate when the price is at a Premium (above the 50% level in Red) and when the price is at a Discount (below the 50% level in blue).
Each Premium and Discount range is also split into 2 halves.
Those levels can also be used to identify potential turning points when comparing the Current Year's price positioning in the Yearly Range to historical price action.
As you can see from the example below, most major turning points happen at around key price levels.
Index Kill Zones - SMC IndicatorsWhat are Index Kill Zones?
Index Kill Zones are specific Time Windows of opportunity during the Session for Indices that have the potential for the highest volatility and where looking for trading opportunities is ideal.
The Index Kill Zone Indicator is specifically designed for the SP500, NQ100, and DJ30, Markets. What differentiates this script from other Kill Zones scripts is that this script is based on NY Midnight as the basis for the start of the day.
This is not the usual below-average Index Kill Zone indicator because this indicator does not only show the 3 main Kill Zones or Sessions, but it also offers extra Kill Zones within each session that are called "AM Session", "PM Session", the "Launch Hour", the "Silver Bullet for the London, AM, and PM Sessions", and the "Last Hour" for the London, AM, and PM sessions.
Another key differentiator of this indicator's functionality is that it shows the highs and lows of each Kill zone allowing SMC traders to monitor Time-Based Liquidity above the highs and lows of each trading session.
By splitting each trading day into AM and PM Sessions, we can identify 3 types of potential daily profiles. These daily profiles could be used as conceptual templates as to what to expect from the price during a certain day. The 6 templates are the following:
1. Two Sessions Up: Where the price would go in one direction higher during both the AM and PM Sessions.
2. Two Sessions Down: Where the price would go in one direction lower during both the AM and PM Sessions.
3. AM Rally, then PM Decline: The price would go higher during the AM session and then lower during the PM Session.
4. AM Decline, then PM Rally: The price would go lower during the AM session and then higher during the PM Session.
5. Consolidation, AM Rally, then PM Decline: Where the price would consolidate most of the AM Session, then go higher into the last hour, and then reverse and go lower during the PM Session.
5. Consolidation, AM Decline, then PM Rally: Where the price would consolidate most of the AM Session, then go lower into the last hour, and then reverse and go higher during the PM Session.
Within each AM and PM Session, there is a "Silver Bullet" that acts as a time window of opportunity to get into a continuation trade in the direction of the prevailing trend.
Also, within each AM and PM Session, there is a "Last Hour" that acts as a time window of opportunity to get into a trade in the direction of the potential trend if the price has not moved yet, or as a reversal trade opportunity if the price has already ran previous short-term highs or lows.
Finally, we have also incorporated a Notification function to remind the trader of the start of the trading Kill Zones to not miss out on potential trade opportunities.
Key Functionalities
Universal Time Reference
Every day starts at 00:00 NY Midnight, irrespective of the trader's local time, Instead of the Standard GMT Midnight. This allows all Index Kill Zones to be in line with the New York start of the day at Midnight, as taught by ICT.
Weekend Highlighter
This feature highlights time from Sunday Market Open at 5 PM NY Time to 00:00 NY Midnight.
It's useful for identifying the non-trading or the low volatility periods when trading should be avoided.
Features Breakdown
Lookback Period
Defaulted to 60 trading days, aligning with “IPDA Data Ranges”, which is ideal for backtesting.
It's adjustable for trading, and it's recommended to keep it at 20 trading days to focus on the most recent data only.
24-hour Daily Intervals
The 24-hour intervals are not the same as the usual daily candle. Instead, the start of each trading day is anchored to the 00:00 NY Midnight.
Highlights "Days of the Week" labels, "Weekend" Trading Time, and the daily high-low ranges based on the start of trading day mark being at 00:00 NY Midnight.
London Kill Zones (Green)
The Full London Session starts from 02:00 NY Time to 05:00 NY Time.
London Silver Bullet starts from 03:00 NY Time to 04:00 NY Time.
London Last Hour starts from 04:00 NY Time to 05:00 NY Time.
Highlights the high and low of the London Kill Zone to Identify Time-Based Liquidity above and below the London Kill Zone Range.
AM Session Kill Zone (Blue)
The full AM Session Starts from 09:30 NY time to 12:00 NY Time.
AM Session Silver Bullet starts from 10:00 NY Time to 11:00 NY Time.
AM Session Last Hour starts from 11:00 NY Time to 12:00 NY Time.
Highlight the high and low of the AM Session to Identify Time-Based Liquidity above and below the AM Session Range.
Highlights the time when there is the highest volatility during the AM Session.
PM Session Kill Zone (Orange)
The full PM Session Starts from 13:00 NY time to 16:00 NY Time.
PM Session Silver Bullet starts from 14:00 NY Time to 15:00 NY Time.
PM Session Last Hour starts from 15:00 NY Time to 16:00 NY Time.
Highlight the high and low of the PM Session to Identify Time-Based Liquidity above and below the PM Session Range.
Highlights the time when there is the highest volatility during the PM Session.
Bonus Features
Daily & Weekly Open Price Levels
The Open Price levels draw a horizontal line from the start of the trading day at 00:00 NY midnight, and it extends it towards the end of the trading day.
This is useful for understanding where the price is relative to the daily candle.
When Bullish, the trader should look for setups at or below the daily or weekly open price.
When Bearish, the trader should look for setups at or above the daily or weekly open price.
Whether to choose the Daily or Weekly open price depends on the trader's trading style. If the trader is day trading or scaling, then it's more appropriate to choose the Daily Open Price.
However, Day Traders can also use the Weekly candle to align with the Weekly Candle's expected range direction.
On the other hand, if the trader is a Swing Trader and wants to capitalise on the weekly candle's trend, then it's more appropriate to choose the Weekly Open Price.
However, Swing Traders can also use the Daily Open Price when looking to take a trade to time better entries with a high risk-to-reward ratio.
Daily Open Price Level (in Green) and Weekly Open Price Level (in White)
Kill Zones Open Price Level
This is useful if the trader is an intra-session trader and wants to treat the sessions as the daily candle. In this case, the trader can use the Kill Zones Open Price levels based on the same logic of the Daily Open Price, where the trade would look for buy opportunities below the Session's open price and look for sell opportunities above the Session's Open Price Level.
Notifications
The trader can also receive alerts as a reminder at the start of the desired session to ensure that he or she does not miss the start of the trading session.

MTF Market Structure - SMC IndicatorsThe Multi Timeframe Market Structure helps understand and identify bullish or bearish Market Structure by highlighting “KEY” Highs and Lows. It also identifies changes in market direction by identifying a “Shift in Market Structure” (See Point 2 below) or “Break in Market Structure” (See Point 3 Below).
What are Key Highs and Lows?
Not every high or low is a “Key” high or low. “Key” highs and lows are specific highs and lows that form the structure of the market and have significance in understanding the current trend in the market (see point 1 below).
The indicator identifies these “Key” highs and lows on multiple time frames, allowing the trader to keep a perspective of the Market Structure with multiple timeframes simultaneously (see point 5 below).
The key highs and lows identified by the indicator are as follows:
Key Lows : Identify significant Swing Lows, Short-term lows “STL”, Intermediate-Term Lows “ITL”, and Long-Term Lows “LTL”.
Key Highs : Identify significant Swing Highs, Short-term highs “STH”, Intermediate-Term Highs “ITH”, and Long-Term Highs “LTH”.
Significant Swing High : This is a price swing with one lower candle to the right and one lower candle to the left of it.
Significant Swing Low : This is a price swing with one higher candle to the right and one higher candle to the left of it.
Short-Term High “STH” is a price swing with one lower Significant Swing High to the right and one lower Significant Swing High to the left of it.
Short-Term Low “STL” is a price swing with one higher Significant Swing Low to the right and one higher Significant Swing Low to the left of it.
Intermediate-Term High “ITH” is a price swing with one lower STH to the right and one lower STH to the left of it.
Intermediate-Term Low “ITL” is a price swing with one higher STL to the right and one higher STL to the left of it.
Long-Term High “LTH” is a price swing with one lower ITH to the right and one lower ITH to the left of it.
Long-Term Low “ITL” is a price swing with one higher ITL to the right and one higher ITL to the left of it.
By identifying key highs and lows using the Market Structure Indicator, it can be used in multiple ways by using those reference points as follows:
1. Identifying Market Trends by Connecting Key Highs and Lows.
Bullish trend identification is when the indicator is making higher ITLs and ITHs.
Bearish Trend identification when the indicator is making lower ITLs and ITHs.
PS: it’s essential to understand the underlying market trend on multiple timeframes to use the next features correctly. Always use the Shifts and Breaks in Market Structures in line with the 1H or higher timeframes Market Trend for higher probability trade opportunities. This is because, generally, higher timeframes have more importance than lower timeframes.
2. Shift In Market Structure - SMS for Entries
A Shift in Market Structure “SMS” identifies potential reversal in short-term market trend relative to the timeframe where the SMS is identified.
This occurs after a run of any Significant Swing High or Low and then reversing, creating a Fair Value Gap “FVG”.
There can be Bullish and Bearish Market Structure Shifts.
When a Bullish Shift in Market Structure occurs, the indicator identifies an opportunity for the price to change from Bearish to Bullish, as seen in the image below.
When a Bearish Shift in Market Structure occurs, the indicator identifies an opportunity for the price to change from Bullish to Bearish.
3. Break In Market Structure - BMS for Entries
A Break in Market Structure “BMS” has a similar function to the Shift in Market Structure “SMS”; however, when it occurs, it identifies a potential longer-term trend reversal (compared to the SMS) relative to the timeframe where the BMS is identified.
Unlike “SMS”, the BMS occurs after a run only after a run on Key Highs or Lows.
Similar to the SMS, there can be Bullish and Bearish Breaks in Market Structure.
When a Bullish Break in Market Structure occurs, the indicator identifies an opportunity for a longer-term trend change from Bearish to Bullish, as seen in the image below.
The FVG must occur in the lower 50% of the impulse price leg (at Discount).
When a Bearish Break in Market Structure occurs, the indicator identifies an opportunity for a longer-term trend change from Bullish to Bearish.
The FVG must occur in the upper 50% of the impulse price leg (at Premium).
4. Inversion Break and Shift in Market Structure for Early Entries
Inversion “BMS” and “SMS” are similar to the normal SMS and BMS, but they occur:
Bullish: When the FVG of the Bearish BMS/SMS forms in the lower 50% of the impulse price leg (at Discount).
We use the FVG that forms from the Bearish SMS/BMS as an inversion FVG for potential entry after market trend change from Bearish to Bullish.
Bearish: When the FVG of the Bullish BMS/SMS forms in the upper 50% of the impulse price leg (at Premium).
We use the FVG that forms from the Bullish SMS/BMS as an inversion FVG for potential entry after market trend change from Bullish to Bearish.
5. Multi Time Frame analysis
The indicator allows multiple timeframe perspectives to be considered when using it.
The key Highs and Lows have significance not only on the current timeframe they are identified but also on lower or higher timeframes simultaneously.
This is because a ITL/ITH on the 1H means
It’s a LTL/LTH on one or more timeframes lower (15Min, 5M, and 1Min).
And at the same time, it’s a STL/STH on one timeframe higher (4H)
Also, it’s a Significant Low/High (marked with a dot) on two timeframes higher (Daily).
The same logic applies to all other Key Highs and Lows.
Another example is a Significant Low/High (swing marked with a dot below or above it) on the current timeframe (1D) means it’s a STL/STH on one timeframe lower (4H) and an ITL/ITH on two timeframes lower (1H) and a LTH/LTH on three timeframes lower or more (15M, 5M, 1Min, 30 Seconds, etc…).
This Multi-time frame analysis is a great way to help traders understand Market Structure and Market trend on multiple timeframes simultaneously, and it also assists in Top-down analysis.
PS: Note that this multi-timeframe analysis approach and logic can be applied to any timeframe and for any type of trading (swing trading, day trading, scalping, or short-term trading) because the price is fractal.
For example, if a trader is a swing trader, then it’s best to identify trader opportunities on the 1H or higher; however, lower timeframes Market Structure can still be used to help the traders refine their entries and target key highs and lows in the opposite direction.
If a trader is a day trader or a scalper, the trader could use Market Structure on 15M or lower to identify trader opportunities and target key highs and lows in the opposite direction.
6. Setting Targets
The indicator can also be used to identify potential targets after the SMS or BMS occurs. Targets can be chosen above Key Highs or Lows depending on the trade objective and timeframe where the trade idea is identified.
Bonus Features
Highlight Market Structure Trend
This feature is an excellent backtesting visual tool to look at changes in market trends highlighted in colours. These changes are based on the Shift or Break in of Market Structure depending on the selection option.
When "Shift/Break" in Market Structure" is selected, a Bullish trend is highlighted in blue when a Bullish Shift/Break in Market Structure Occurs and in Red when a Bearish Shift/Break in Market Structure Occurs.
Notifications
Sends notifications when there is a Shift or Break in Market Structure on the current timeframe of choice.