9 Seasons Rainbow Indicator PRO [GO8686]Trading on 5 minutes frame can be as reasonable as on 4H frame, use 9 Seasons Rainbow Indicator PRO for both.
5分钟维度的交易可以与4小时维度一样合理,请使用9季彩虹指标 PRO 。
Market is full of life, with seasons.
9 Seasons Rainbow Indicator displays 9 seasons of any trading instrument in multiple time frames, helping traders and investors understand the flow of price.
The combination of seasons in different time dimensions may give perfect trading signals, for instance: overbought in both small time frame and big time frame has high success probability of shorting trade.
Please install the indicator: Demo, PRO or STANDARD Version. Apply the indicator to your favorites trading instruments: indices, stocks, futures , forex or crypto currencies. Find your patterns that make money.
---------- 9 Seasons ----------
Bull(Green), evolves into BullRest, OverBought, Bear, or Neutral
Bull Rest(Light Green): a pullback or retracement, evolves into Bull or Bear
OverBought(Yellow): may have defined a top or resistance, can happen in range, evolves into CrazyBought or Bear
CrazyBought(Lime): going up in a high volatility , evolves into Bear, OverBought, or BullRest
Neutral(White): a wandering season without direction, evolves into Bull or Bear
Bear(Red), evolves into BearRest, OverSold, Bull or Neutral
Bear Rest(Light Red): a bounce, evolves into Bear or Bull
OverSold(Blue): may have defined a bottom or support, can happen in range, evolves into CrazySold or Bull
CrazySold(Fuchsia): going down in a high volatility , evolves into Bull, OverSold, or BearRest
---------- Some important evolutions of seasons ----------
OverBought -> CrazyBought: can happen with a breakout
CrazyBought -> OverBought or Bear: could mean fading of a breakout
CrazyBought -> BullRest: can happen after rising over a new level
OverSold -> CrazySold: can happen with a breakdown
CrazySold -> OverSold or Bear: could mean fading of a breakdown
CrazySold -> BearRest: can happen after dropping to a new level
---------- Rainbow Ribbons for multiple time frames ----------
Each ribbon of the rainbow represents a time frame,
The difference between two frames is 1.4142 fold (square root of 2), if level 1 is 15 M, level 2 is 15 * (square root of 2) M. level 3 is 15*2 M, level 4 is 30 * (square root of 2) M, level 5 is 30 * 2 m etc.
The uppermost ribbon represents the smallest time frame - current time period of the chart.
The lower ribbons represent bigger time frames, which work as context.
Examples for time frame rainbow:
For DEMO in 30M: 30M - 42M - 60M(1H) - 85M - 120M(2H) - 170M - 240M(4H) - 339M
For STANDARD in 15M: 15M - 21M - 30M - 42M - 60M(1H) - 85M - 120M(2H) - 170M
For PRO in 15M: 15M - 21M - 30M - 42M - 60M(1H) - 85M - 120M(2H) - 170M - 240M(4H) - 339M - 480M(8H) - 679M
---------- Versions Description ----------
The features may change later, please refer to latest update.
PRO:
PRO version of 9 Seasons Rainbow Indicator is invite-only, with the following advanced features:
12 Ribbon Rainbow lets you discover trading opportunities hidden in the 1.4142 fold time dimension while monitoring market conditions spanning 45 times.
Advanced alert sets allows you set alerts for Overbought, Crazybought, OverSold, CrazySold on low, medium, and high time frames.
Option to input different trading instrument to compare with the current ticker.
Full time periods access allows you to watch the market on broadest time dimensions.
More new features in updates.
STANDARD:
This is STANDARD version of 9 Seasons Rainbow Indicator, invite-only, with the following advanced features:
8 Ribbon Rainbow lets you discover trading opportunities hidden in the 1.4142 fold time dimension while monitoring market conditions spanning 11 times.
Advanced alert sets allows you set alerts for Overbought, Crazybought, OverSold, CrazySold on upper and lower time frames.
Broad time periods access allows you to watch the market on popular time dimensions from 15M - 1D,2D,3D,4D,5D,6D,1W.
More new features in updates.
DEMO:
A DEMO of Standard version for trial purpose, having most the functions except alert preset conditions.
It is applicable to a list of trading instruments and specific time periods(30m-1D), which may change later. please refer to latest updates.
---List of tickers applicable for Demo version.
Currency Index:AXY, BXY , CXY , DXY , EXY , JXY , SXY , ZXY ,
Stock Index:SPX,TSX, DAX , NI225 ,KOSPI,399001, SHCOMP , HSI , XJO , TAIEX , SX5E ,
Crypto:BTCUSD
Commodity:BCOUSD, GOLD
---------- Access to Indicators ----------
Please use DEMO version to taste the indicator.
Please contact the author for access to PRO or Standard versions.
---------- About Loading Time ----------
It may take up to 2 minutes for your browser to load a new setting, depending on the your computer and network speed.
---------- List of the author's Indicators ----------
tradingview.com/u/go8686/#published-scripts
---------- Disclaim ----------
By using or requesting access to this indicator, you acknowledge that you have read and accepted that this indicator is for study purposes only and it does NOT guarantee you will make money.
I am not financial adviser and I am NOT responsible for any profits or losses you may incur by using this indicator!
Users should make their own decisions, carefully assess risks and be responsible for investment and trading activities.
The latest updates override the previous description. Please check the updates.
9季彩虹指标 PRO
市场充满生机。
9季彩虹指标在多个时间维度上显示任何交易品种的9个季节交替,帮助交易者和投资者了解价格流动。
不同时间维度的季节组合可以给出完美的交易信号,例如:在小时间框架和大时间框架上同时出现超买具有很高的卖空交易成功概率。
请安装指标:DEMO,STANDARD 或者 PRO 版本. 应用指标到您的交易品种:证券,期货,外汇或者加密货币。找到属于您的盈利模式。
---------- 季节的定义 ----------
牛(绿色),可以演变到牛市回调,超买,熊 或者 中性
牛市回调(淡绿色):可以演变到牛或者熊
超买(黄色),可能刚刚定义了一个头部或者阻力区,可以发生在盘整期,可以演变到狂买或者熊
狂买(亮绿色):高波动性上涨,可以演变到熊,超买或者牛市回调
中性(白色): 没有方向的徘徊期,可以演变到牛或者熊
熊(红色),可以演变到熊市反弹,超卖,牛 或者 中性
熊市反弹(淡红色),可以演变到熊或者牛
超卖(蓝色),可能刚刚定义了一个底部或者支撑,可以发生在盘整期,可以演变到狂卖或者牛
狂卖(紫红色),高波动性下跌,可以演变到牛,超卖 或者熊市反弹
一些重要的季节交替
超买 -> 狂买:可能发生在向上突破时
狂买 -> 熊 或者 超买:可能发生在突破失败时
狂买 -> 牛市回调: 可能发生在上平台后
超卖 -> 狂卖:可能发生在向下突破时
狂卖 -> 牛 或者 超卖:可能发生在突破失败时
狂卖 -> 熊市回调: 可能发生在下平台后
---------- 色带彩虹所代表的时间维度 ----------
每条色带代表一个时间维度。
色带间隔1.4142倍(2的开方),如果第一维度是15分钟,第二维度是15*1.4142=21分钟,第三维度是15*2=30分钟,以此类推。
最上面的色带代表最小的时间维度,也就是目前图表的时间维度
最下面的色带代表最大的时间维度。
例子:
演示版: 30m-42m-60m(1H)-85m-120m(2H)-170m-240m(4H)-339m
标准版: 15m-21m-30m-42m-60m(1H)-85m-120m(2H)-170m
专业版: 15m-21m-30m-42m-60m(1H)-85m-120m(2H)-170m-240m(4H)-339m-480m(8H)-679m
---------- 不同版本功能描述 ----------
这些特征及功能可能会发生变化,以更新为准。
---专业版PRO高级特征
12色带彩虹让您发现隐藏在1.4142时间维度的交易机会,同时监控时间跨度达四十五倍的市场状态
高级警报功能:允许您在低,中,高时间帧上设置超买,狂买,超卖,狂卖的警报。
可以输入不同的交易品种用于指标,便于与当前交易品种进行比较。
全时间维度(分钟到日线级别)给您全视角观察市场
更新中的更多新功能。
---标准版STANDARD特征
8色带彩虹让您发现隐藏在1.4142时间维度的交易机会,同时监控时间跨度达十一倍的市场状态
高级警报功能:允许您在低,高时间层级上设置超买,狂买,超卖,狂卖的警报。
宽时间维度(15分钟到日线级别)让您从更宽阔的视角观察市场
更新中的更多新功能。
--演示版DEMO
演示版用于标准版的演示和试用,适用于特定的资产列表和时间维度(30M-1D),后续可能调整.
适用的品种列表
AXY , BXY , CXY , DXY , EXY , JXY , SXY , ZXY ,
SPX ,TSX, DAX , NI225 ,KOSPI,399001, SHCOMP , HSI , XJO , TAIEX , SX5E ,
BTCUSD , BCOUSD , GOLD
---------- 获得使用权 ----------
请使用演示版以初步了解指标的运行机理。
联系指标开发者以取得标准版和专业版的使用权
---------- 开发者的指标列表 ----------
tradingview.com/u/go8686/#published-scripts
---------- 加载时间 ----------
可能需要2分钟,取决于网络和电脑配置。
---------- 免责声明 ----------
在要求获得本指标使用权之前以及在使用本指标之前,用户认可已经完全了解和接受:本指标仅供研究目的, 它不提供任何赢利的可能性。
本指标的开发者并非专业投资顾问,因此不对用户的任何赢亏负责。
用户应独立判断,审慎评估并自负投资和交易风险!
最近的更新会覆盖之前的说明。 请参阅更新来查看指标的新特征和功能。
Timeframe

9 Seasons Rainbow Indicator STANDARD [GO8686]Market is full of life, with seasons.
9 Seasons Rainbow Indicator displays 9 seasons of any trading instrument in multiple time frames, helping traders and investors understand the flow of price.
The combination of seasons in different time dimensions may give perfect trading signals, for instance: overbought in both small time frame and big time frame has high success probability of shorting trade.
Please install the indicator: Demo, PRO or STANDARD Version. Apply the indicator to your favorites trading instruments: indices, stocks, futures , forex or crypto currencies. Find your patterns that make money.
---------- 9 Seasons ----------
Bull(Green), evolves into BullRest, OverBought, Bear, or Neutral
Bull Rest(Light Green): a pullback or retracement, evolves into Bull or Bear
OverBought(Yellow): may have defined a top or resistance, can happen in range, evolves into CrazyBought or Bear
CrazyBought(Lime): going up in a high volatility , evolves into Bear, OverBought, or BullRest
Neutral(White): a wandering season without direction, evolves into Bull or Bear
Bear(Red), evolves into BearRest, OverSold, Bull or Neutral
Bear Rest(Light Red): a bounce, evolves into Bear or Bull
OverSold(Blue): may have defined a bottom or support, can happen in range, evolves into CrazySold or Bull
CrazySold(Fuchsia): going down in a high volatility , evolves into Bull, OverSold, or BearRest
---------- Some important evolutions of seasons ----------
OverBought -> CrazyBought: can happen with a breakout
CrazyBought -> OverBought or Bear: could mean fading of a breakout
CrazyBought -> BullRest: can happen after rising over a new level
OverSold -> CrazySold: can happen with a breakdown
CrazySold -> OverSold or Bear: could mean fading of a breakdown
CrazySold -> BearRest: can happen after dropping to a new level
---------- Rainbow Ribbons for multiple time frames ----------
Each ribbon of the rainbow represents a time frame,
The difference between two frames is 1.4142 fold (square root of 2), if level 1 is 15 M, level 2 is 15 * (square root of 2) M. level 3 is 15*2 M, level 4 is 30 * (square root of 2) M, level 5 is 30 * 2 m etc.
The uppermost ribbon represents the smallest time frame - current time period of the chart.
The lower ribbons represent bigger time frames, which work as context.
Examples for time frame rainbow:
For DEMO in 30M: 30M - 42M - 60M(1H) - 85M - 120M(2H) - 170M - 240M(4H) - 339M
For STANDARD in 15M: 15M - 21M - 30M - 42M - 60M(1H) - 85M - 120M(2H) - 170M
For PRO in 15M: 15M - 21M - 30M - 42M - 60M(1H) - 85M - 120M(2H) - 170M - 240M(4H) - 339M - 480M(8H) - 679M
---------- Versions Description ----------
The features may change later, please refer to latest update.
STANDARD:
This is STANDARD version of 9 Seasons Rainbow Indicator, invite-only, with the following advanced features:
8 Ribbon Rainbow lets you discover trading opportunities hidden in the 1.4142 fold time dimension while monitoring market conditions spanning 11 times.
Advanced alert sets allows you set alerts for Overbought, Crazybought, OverSold, CrazySold on upper and lower time frames.
Broad time periods access allows you to watch the market on popular time dimensions from 15M - 1D,2D,3D,4D,5D,6D,1W.
More new features in updates.
PRO:
PRO version of 9 Seasons Rainbow Indicator is invite-only, with the following advanced features:
12 Ribbon Rainbow lets you discover trading opportunities hidden in the 1.4142 fold time dimension while monitoring market conditions spanning 45 times.
Advanced alert sets allows you set alerts for Overbought, Crazybought, OverSold, CrazySold on low, medium, and high time frames.
Option to input different trading instrument to compare with the current ticker.
Full time periods access allows you to watch the market on broadest time dimensions.
More new features in updates.
DEMO:
A DEMO of Standard version for trial purpose, having most the functions except alert preset conditions.
It is applicable to a list of trading instruments and specific time periods(30m-1D), which may change later. please refer to latest updates.
---List of tickers applicable for Demo version.
Currency Index:AXY, BXY , CXY , DXY , EXY , JXY , SXY , ZXY ,
Stock Index:SPX,TSX, DAX , NI225 ,KOSPI,399001, SHCOMP , HSI , XJO , TAIEX , SX5E ,
Crypto:BTCUSD
Commodity:BCOUSD, GOLD
---------- Access to Indicators ----------
Please contact the author for access to PRO or Standard versions.
---------- About Loading Time ----------
It may take up to 2 minutes for your browser to load a new setting, depending on the your computer and network speed.
---------- List of the author's Indicators ----------
tradingview.com/u/go8686/#published-scripts
---------- Disclaim ----------
By using or requesting access to this indicator, you acknowledge that you have read and accepted that this indicator is for study purposes only and it does NOT guarantee you will make money.
I am not financial adviser and I am NOT responsible for any profits or losses you may incur by using this indicator!
Users should make their own decisions, carefully assess risks and be responsible for investment and trading activities.
The latest updates override the previous description. Please check the updates.
9季彩虹指标 标准版 STANDARD
市场充满生机。
9季彩虹指标在多个时间维度上显示任何交易品种的9个季节交替,帮助交易者和投资者了解价格流动。
不同时间维度的季节组合可以给出完美的交易信号,例如:在小时间框架和大时间框架上同时出现超买具有很高的卖空交易成功概率。
请安装指标:DEMO,STANDARD 或者 PRO 版本. 应用指标到您的交易品种:证券,期货,外汇或者加密货币。找到属于您的盈利模式。
---------- 季节的定义 ----------
牛(绿色),可以演变到牛市回调,超买,熊 或者 中性
牛市回调(淡绿色):可以演变到牛或者熊
超买(黄色),可能刚刚定义了一个头部或者阻力区,可以发生在盘整期,可以演变到狂买或者熊
狂买(亮绿色):高波动性上涨,可以演变到熊,超买或者牛市回调
中性(白色): 没有方向的徘徊期,可以演变到牛或者熊
熊(红色),可以演变到熊市反弹,超卖,牛 或者 中性
熊市反弹(淡红色),可以演变到熊或者牛
超卖(蓝色),可能刚刚定义了一个底部或者支撑,可以发生在盘整期,可以演变到狂卖或者牛
狂卖(紫红色),高波动性下跌,可以演变到牛,超卖 或者熊市反弹
一些重要的季节交替
超买 -> 狂买:可能发生在向上突破时
狂买 -> 熊 或者 超买:可能发生在突破失败时
狂买 -> 牛市回调: 可能发生在上平台后
超卖 -> 狂卖:可能发生在向下突破时
狂卖 -> 牛 或者 超卖:可能发生在突破失败时
狂卖 -> 熊市回调: 可能发生在下平台后
---------- 色带彩虹所代表的时间维度 ----------
每条色带代表一个时间维度。
色带间隔1.4142倍(2的开方),如果第一维度是15分钟,第二维度是15*1.4142=21分钟,第三维度是15*2=30分钟,以此类推。
最上面的色带代表最小的时间维度,也就是目前图表的时间维度
最下面的色带代表最大的时间维度。
例子:
演示版: 30m-42m-60m(1H)-85m-120m(2H)-170m-240m(4H)-339m
标准版: 15m-21m-30m-42m-60m(1H)-85m-120m(2H)-170m
专业版: 15m-21m-30m-42m-60m(1H)-85m-120m(2H)-170m-240m(4H)-339m-480m(8H)-679m
---------- 不同版本功能描述 ----------
这些特征及功能可能会发生变化,以更新为准。
---标准版STANDARD特征
8色带彩虹让您发现隐藏在1.4142时间维度的交易机会,同时监控时间跨度达十一倍的市场状态
高级警报功能:允许您在低,高时间层级上设置超买,狂买,超卖,狂卖的警报。
宽时间维度(15分钟到日线级别)让您从更宽阔的视角观察市场
更新中的更多新功能。
---专业版PRO高级特征
12色带彩虹让您发现隐藏在1.4142时间维度的交易机会,同时监控时间跨度达四十五倍的市场状态
高级警报功能:允许您在低,中,高时间帧上设置超买,狂买,超卖,狂卖的警报。
可以输入不同的交易品种用于指标,便于与当前交易品种进行比较。
全时间维度(分钟到日线级别)给您全视角观察市场
更新中的更多新功能。
--演示版DEMO
演示版用于标准版的演示和试用,适用于特定的资产列表和时间维度(30M-1D),后续可能调整.
适用的品种列表
AXY , BXY , CXY , DXY , EXY , JXY , SXY , ZXY ,
SPX ,TSX, DAX , NI225 ,KOSPI,399001, SHCOMP , HSI , XJO , TAIEX , SX5E ,
BTCUSD , BCOUSD , GOLD
---------- 获得使用权 ----------
联系指标开发者以取得标准版和专业版的使用权
---------- 开发者的指标列表 ----------
tradingview.com/u/go8686/#published-scripts
---------- 加载时间 ----------
可能需要2分钟,取决于网络和电脑配置。
---------- 免责声明 ----------
在要求获得本指标使用权之前以及在使用本指标之前,用户认可已经完全了解和接受:本指标仅供研究目的, 它不提供任何赢利的可能性。
本指标的开发者并非专业投资顾问,因此不对用户的任何赢亏负责。
用户应独立判断,审慎评估并自负投资和交易风险!
最近的更新会覆盖之前的说明。 请参阅更新来查看指标的新特征和功能。

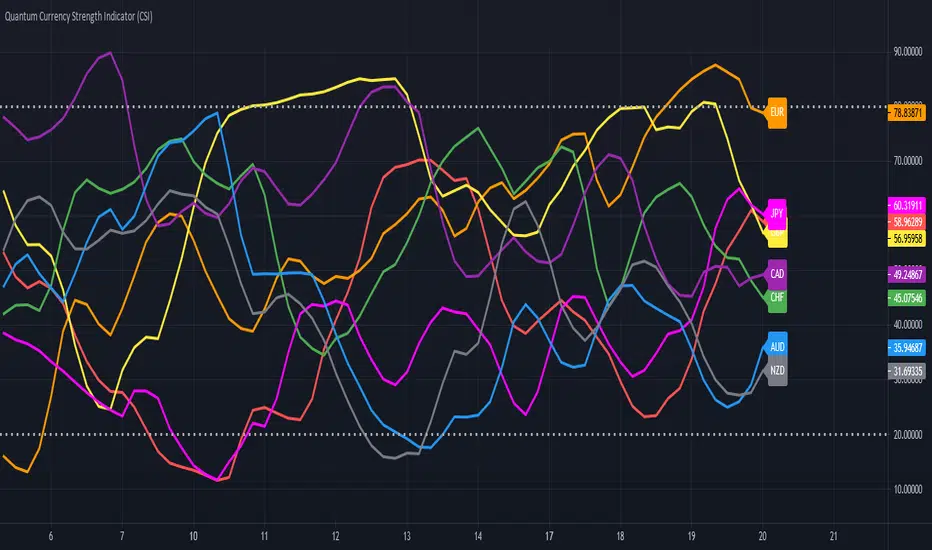
Quantum Currency Strength Indicator (CSI)If there is only one TradingView indicator you ever buy for trading forex – this has to be it.
Your success as a forex trader depends on being able to identify when a currency or currency pair is oversold or overbought. If it is strong or weak. It is this concept which lies at the heart of forex trading. Without the Quantum Currency Strength indicator, it’s almost impossible. There are simply too many currencies and too many pairs to do this quickly and easily yourself. You need help. The Quantum Currency Strenght indicator breaks this complex market down into the building blocks, the currencies themselves, from which you can then identify quickly, clearly and easily those pairs offering the best opportunities, which to ignore for the time being, and which to add to your watchlist. It’s your radar on the currency market.
The Quantum Currency Strength indicator has been designed with one simple objective in mind. To give you a bird’s eye view of the eight major currencies. To show you in a simple, quick and easy way, when a currency is either oversold or overbought, rising or falling strongly, or just going nowhere.
To help you, the indicator defines the overbought and oversold regions for you, with a simple horizontal line. One near the top at 80, and the other near the bottom at 20. When a currency reaches the upper grey line, it’s approaching an overbought state, and when a currency touches the lower grey line, conversely it’s approaching an oversold state.
It is at these points a trend is likely to reverse, offering you low-risk trading opportunities. Something you could never do quickly or easily yourself.
It displays the eight currencies individually, giving you endless combinations of trading opportunities from scalping to swing and trend trading in all the various currency pairs and in every timeframe.
US dollar – red
Euro – orange
British pound – yellow
Swiss franc – green
Japanese yen – magenta
Canadian dollar – purple
Australian dollar – blue
New Zealand dollar – white
Whilst this concept is simple, its use is sophisticated, and one which you can apply in a variety of ways. In fact four very different, but equally powerful ways, all of which will help you make money, confidently and without emotion:
First – the indicator tells you when an individual currency is overbought or oversold. Strong or weak. Unlike some assets, currencies never go to zero. It is when they reach these extreme points, that currencies offer the lowest risk trading opportunities. These are the regions at which a currency is likely to reverse from a previous trend, giving you the potential to get into a low-risk trading position early.
Second – the indicator will also tell you when it’s time to exit. After all, if it’s good enough to get you in, it’s good enough to get you out as well.
Third – when the currencies are all bunched together in the middle of the indicator – guess what. It’s time to sit on the sidelines and wait.
Finally, take your trading to another level using multiple timeframes. After all, if a currency is moving higher, or lower, across three timeframes, then even more reason to take a low-risk trade, so using the indicator in multiple timeframes is key.
And if this wasn’t enough. There is even more!
You can configure the indicator to your own personal trading style. Think of it like the volume control on your radio. You adjust it to your own personal preference. Well it’s the same here. If you are a scalping trader, simply adjust one of the indicator settings to speed up the indicator. If you are a swing or trend trader, tweak the controls to slow it down a little – the choice is yours. More control means one thing – more consistency and greater profits.
After all, why buy an indicator that you cannot match to your trading style? It would be like buying a radio with no volume control.
That’s why we call them the next generation of trading indicators for TradingView.
The Quantum Currency Strength indicator works in all timeframes from seconds and ticks to minutes and months, and the colour of each currency line on the indicator can be changed to your own personal preferences.
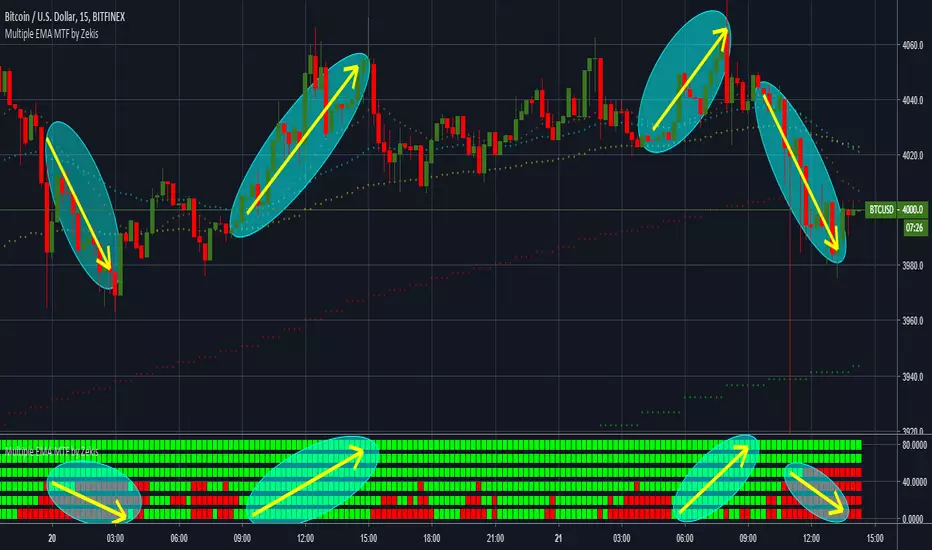
Multiple EMA MTF by ZekisA simple but effective strategy with multiple time frames for EMA.
Very useful so you don't have to change chart resolution to check it, you have direct confirmation.
I put 6 time frames for one EMA as bricks, sometimes is hard to see if a line is above or below the price and you need to zoom and zoom, so with this way of view, it will be easier.
Green = EMA is below price = bullish
Red = EMA is above price = bearish
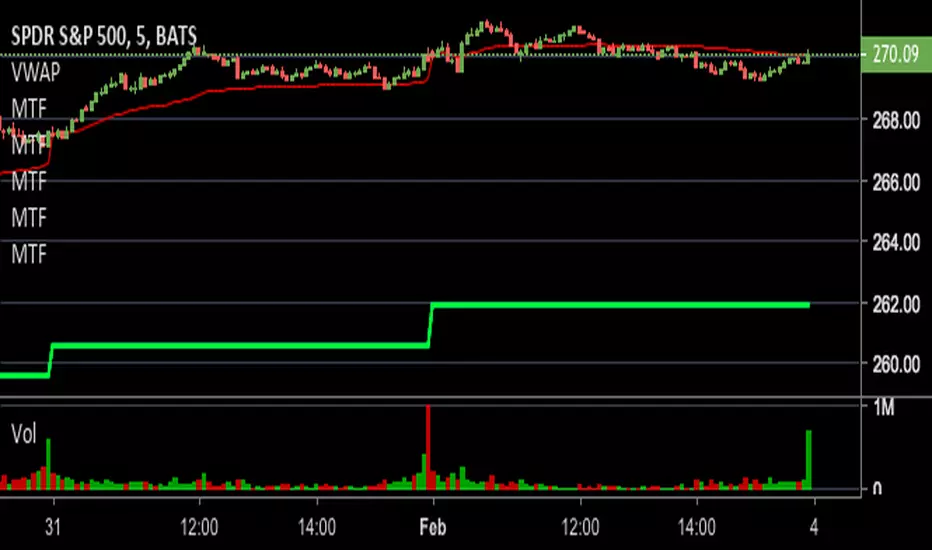
Multi time frames as default (you can change it for your needs) - 5m, 15m, 30m, 1H, 2H and 4H.
Enjoy!
@Zekis
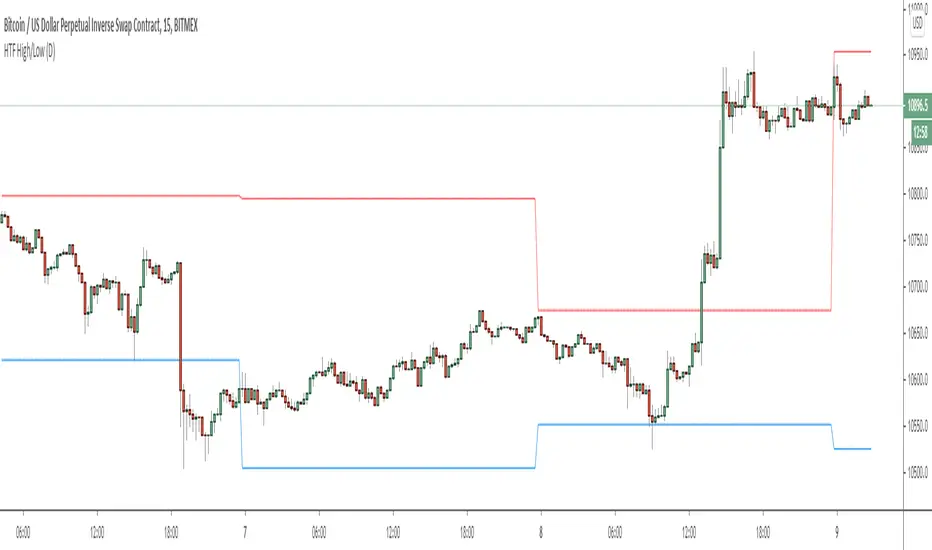
HTF High/LowThis simple script draws the previous higher timeframe candle high/low to your chart.
You can also make the script paint the zone between the low/open and the high/close.
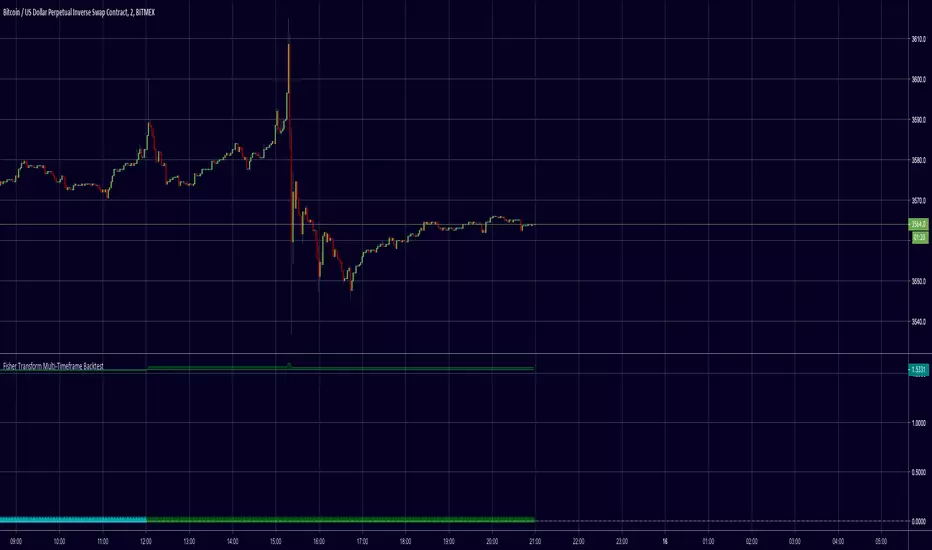
Fisher Transform Multi-Timeframe (Backtest)This is the Backtest Strategy for mortdiggiddy's "Fisher Transform Multi-Timeframe"
For more details check his study:
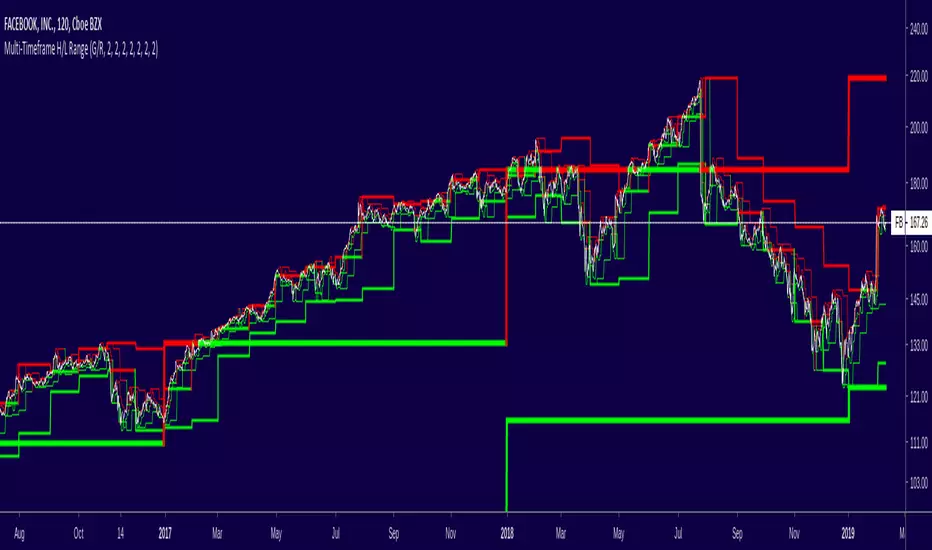
MTF H/L RangeThis indicator will let you have multiple timeframe support and resistance levels on any timeframe!
Super Tunnel by JP Goswami
One of the most accurate trend following indicator I have used till now. You yourself can test it by using on multiple charts and time frame. However, I have found it more accurate on intraday charts, may be 5 min & 15 min TF.
Highlights are:
> High Prediction rates
> Non repainting
> Can be used on MTF
> Simplicity
> Give stoploss levels
Disadvantage:
> Just like any other trend following indicator, volatility and spikes are enemy of this indicator
How to Use
Long:
When Price closes above the tunnel & background is Lime
Stoploss: Just below lower line of the tunnel
Short: When price closes below the tunnel & background is yellow
Stoploss: Just above upper line of the tunnel
No trades: When background doesn't have any colors
Reentry: if Price moves back to long and short rules
All the best
© JP Goswami

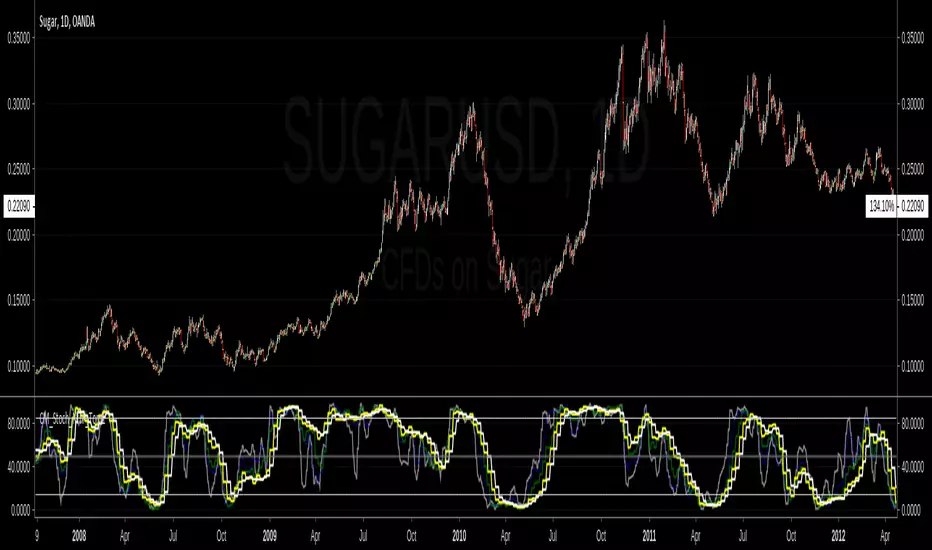
Multi-Timeframe Stochs by Tom L.I find it really usefull. Can put 4 different timeframes.
Thanks again to Tom !
PMA4LIFE
RAF3x
Multi-Timeframes(simplified)Its a simplified version of the script "Ultimate Moving Average Multi-Timeframes" by Chris Moody.
Ive removed the second MA, removed the change colors feature and added the option to change the line width of the indicator
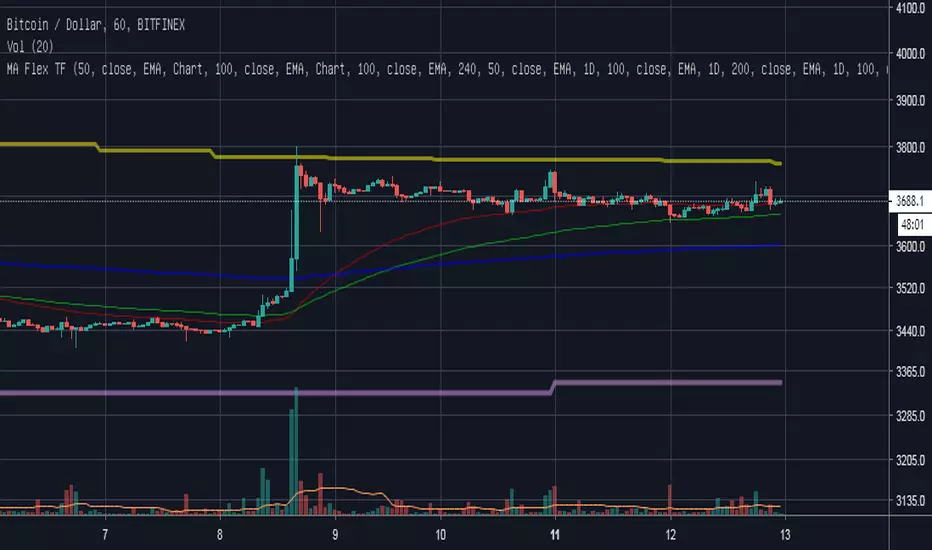
3xBB multi flex TF4 independent 3x Bollinger Bands
each of them hast the following parameterset (user inputs):
- Show/enable true/false: to de-/activate the 3xBB
- 3 diff Multiplier (set some of them to same values or disable some in style-menu to get a better overview)
- Length
- Source
- Timeframe/Resolution: "5","15","30","60", "240","360","720", "1D", "1W", "1M", "Chart"
To use the native chart time resolution select "Chart" as TimeFrame
Without any guarantee / warranty!
Please report bugs in comment section.

MTF BB Meow Mix [acatwithcharts]This script adds multi-timeframe support to full BB Meow Mix, with the full set of various moving average and stdev calculation types.
There is a tradeoff in that there is, to the best of my knowledge, no way to support both MTF and the default band settings menu in the same script, because the security() function in Pinescipt doesn't support variable lookback lengths and trying to plot everything independently instead maxes out the number of plots allowed per script. So, this version of the script doesn't include a menu of defaults.
My volatility indicators are available by subscription in several packages through SharkCharts.live.
Current pricing and subscription details will be kept up-to-date on SharkCharts.live

MTF BB Meow Mix (Lite) [acatwithcharts]This script adds multi-timeframe support to BB Meow Mix (Lite).
There is a tradeoff in that there is, to the best of my knowledge, no way to support both MTF and the default band settings menu in the same script, because the security() function in Pinescipt doesn't support variable lookback lengths and trying to plot everything independently instead maxes out the number of plots allowed per script. So, this version of the script doesn't include a menu of defaults.
My volatility indicators are available by subscription in several packages through SharkCharts.live.
Current pricing and subscription details will be kept up-to-date on SharkCharts.live

Multiple customizable MA own timeresolution own MA-typeMultiple (8) customizable MA
Features:
Set MA-Type/Smoothing: "RMA", "SMA", "EMA", "WMA", "VWMA"
Set Timeframe/Resolution: "60", "240", "1D", "1W", "1M", "Chart"
To use the native chart time resolution select "Chart" as TimeFrame
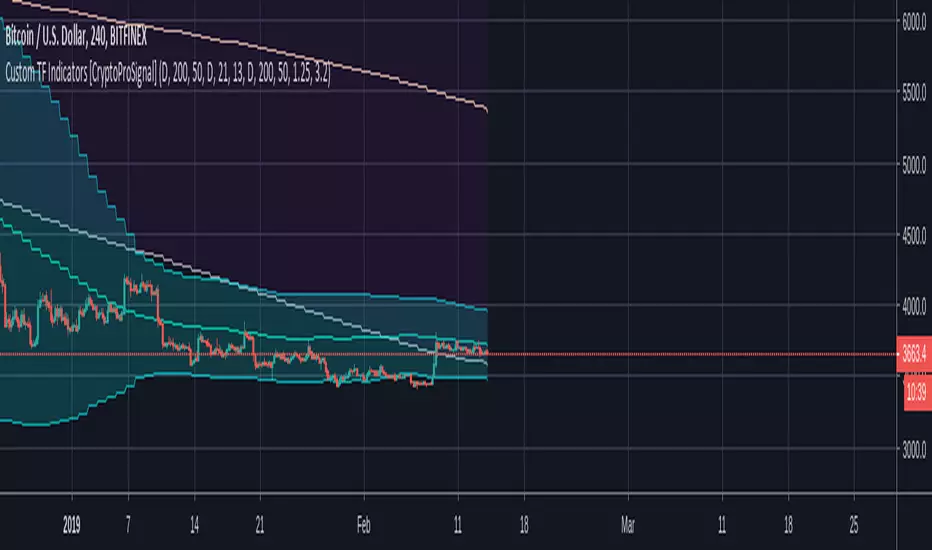
Custom Timeframe Indicators(MA,EMA,BB) [CryptoProSignal]This is a combination of 3 types of indicators :
1) Simple Moving Average
2) Exponential Moving Average
3) Bollinger Band
Idea is to plot any of the above indicator with a particular period length from a different timeframe to the timeframe on which you are currently working.
eg : As shown in the chart we have indicator plots from daily timeframe plotted/shown on the current 4hr time frame .
Similarly, you can have indicator plots from 4hr timeframe to be shown on any other timeframe and so on.
Basically you can select plots from any timeframe to work with on any other timeframe of your liking .
Not a rocket science, just play around with it and you will understand :)
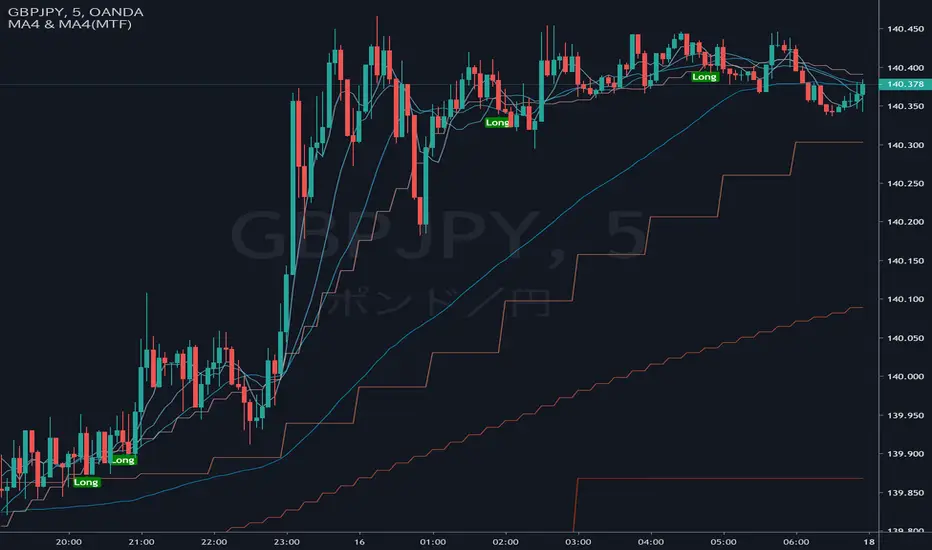
Moving Average 8 lines (multi timeframe 4 lines)moving average 8 lines
(multi timeframe moving average 4 lines)
and entry sign
default : for 5 minute chart
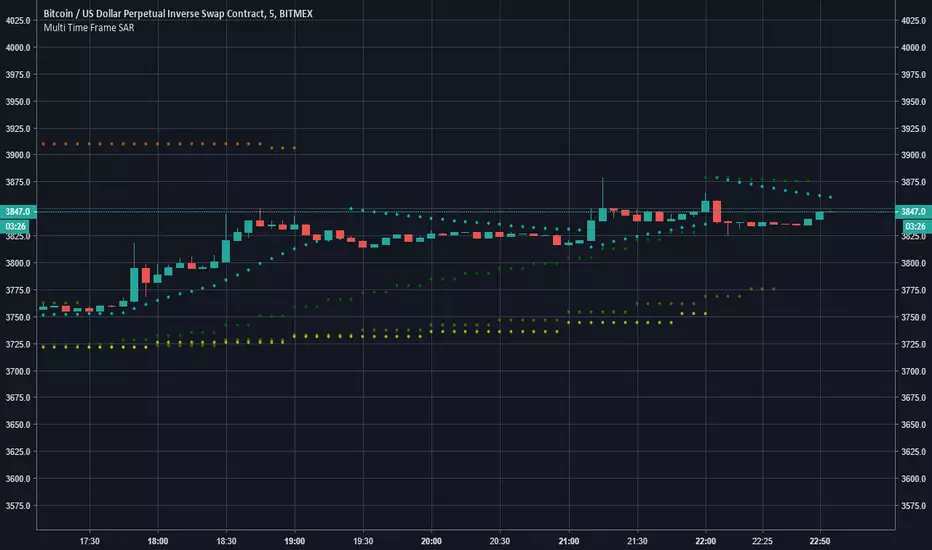
Multi Time Frame SARThis Indicator plots 5 differents time frame SAR in the same graphic.
It must be used in 5 minutes Time Frame.
Plots 5 minutes SAR, 15 minutes, 30 minutes, 1 Hour and 4 Hours.
If you need it to use in other time frame, you can send me a message to evaluate the development of a new version.
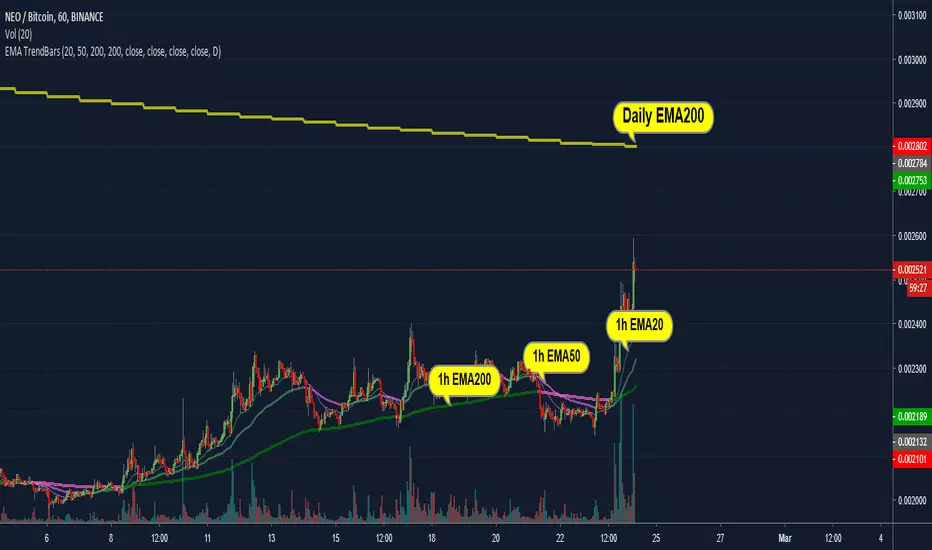
Higher Timeframe EMAThis script plots a higher timeframe EMA to your chart.
You can specify the timeframe and the length of the EMA in the settings.
This chart demonstrates the 5-minute 50EMA (black) combined with the 1-hour 50EMA (colored) on the 1 minute timeframe.

Multi Timeframe EMAs (Fib@MWD)plot fibonacci EMAs 21,55,233 on the timeframes monthly, weekly and daily.

Multi Timeframe EMAs (Round@MWD)plot round number EMAs 20,50,200 on the timeframes monthly, weekly and daily.

Multiple Time Frame Candles - RyanLeeFX.comMultiple Time Frame Candles is a unique script that allows traders to quickly and easily analyze price action candles across multiple time frames all from one chart. Multiple Time Frame Candles eliminates the need for price action traders to change chart time frames when trying to analyze multiple time frames. With this script, traders can easily see the candles from a lower time frame inside candles from a higher time frame.
For example, traders can see 1 Hour candles inside Daily candles. Or 5 Min candles inside Hourly candles. Or Daily candles inside Weekly candles. Or Hourly candles inside Daily candles inside Weekly candles. The options for comparing multiple time frame candles on one screen are almost limitless.
This script differs from other Multiple Time Frame Candle scripts by displaying the open, high, low and close of the larger time frame candle as well as highlighting the close price due to its proven importance.
The ability to quickly analyze multiple time frames from a single chart will make you more confident in your trades as well as save you valuable time during your analysis.
Multiple Time Frame Candles is also an amazing script to help beginning to experienced traders better visualize price movement across multiple time frames all from a single chart. Happy Trading!!

SadLittleThings Price Compare With Offset MTF by RRBSadLittleThings Price Compare With Offset MTF by RagingRocketBull 2018
Version 1.0
This indicator lets you compare multiple assets across different timeframes, supports offsets and alpha multipliers.
Standard TradingView Compare doesn't have Offset/Timeframe/Multiplier options, hence this indicator.
Features:
- compare current asset's price with 2 custom ext OHLC sources
- plot sources as lines/bars/candles
- use offset:
- for lines - both positive/negative offsets, unlimited
- for bars/candles - only positive offsets <= 5000
- specify timeframe for each source
- uses timeframe textbox instead of input resolution dropdown to allow for 240 120 and other custom TFs
- support for timeframes in H: H, 2H, 4H etc
- show/hide sources
- colorize sources
- convert source price to 1000s, mlns, or blns using alpha multiplier
- total bars counter
Notes on using offsets:
- Max offset is defined by study max_bars_back which is limited to 5000 for free accounts. This variable specifies the number of history bars an indicator can access.
- if you see the 'internal server study error' => one of the indexes of ohlc series is out of bounds (i.e. close ) => decrease the offset <= 5000 or switch to line type
- you will be limited only by the total number of bars in history (n) +/- 1 full screen of empty bars
- you can't scroll past the beginning of history - 1 empty screen and past the end of history + 1 empty screen to be able to still see the line with applied offset
- before applying a large offset, scroll back long enough to make sure you have enough history loaded
- if you have a long history the indicator will get slower, its UI less responsive. Reloading the page may fix that.
- you will not see source's history past the beginning of the current asset - open the chart with the longest history first (i.e. BLX, not COINBASE)
- Make sure that the Left Price Scale shows up with Auto Fit Data enabled. You can reattach the indicator to a different scale in Style.
- you may not be able to plot intraday TFs < current TF, because free accounts are limited to TFs >= D1 (i.e. D, 2D, 3D, W), but you can still plot, say, H4+ on a lower TF H1 chart
1. uses plot*, security, change

Daily Moving AveragesPlots the 20, 50, 100 & 200 daily moving averages on any lower timeframe, but it uses a custom function to calculate the plots rather than using the security() function, so the lines are smooth rather than jagged.