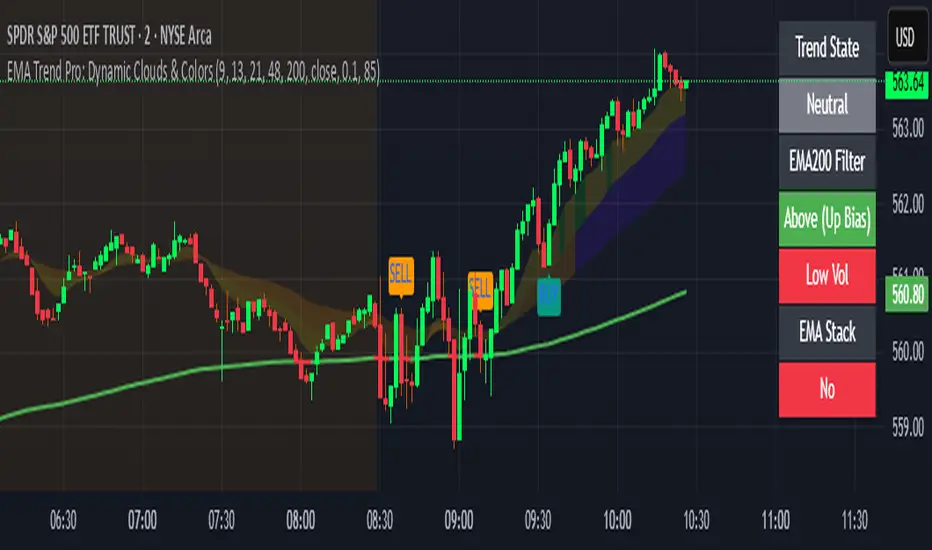
EMA Trend Pro: Dynamic Clouds & ColorsEMA Trend Pro is your ultimate trend companion, built for traders who want clarity, precision, and confidence in their entries.
This script fuses dynamic EMA cloud zones with breakout and pullback signals — giving you real-time insights into market structure and momentum. Whether you're trading crypto, forex, stocks, or futures, EMA Trend Pro adapts to your style.
🔧 Key Features:
✅ EMA Stack Clouds with Folding Sensitivity (9/21/48/200)
✅ Bullish / Bearish trend labels with real-time dashboard
✅ Volume strength analysis (High, Normal, Low)
✅ Breakout signal alerts (momentum-based)
✅ Pullback signal alerts (trend resumption)
✅ Fully customizable: EMA lengths, signal visibility, cloud opacity
✅ Works across all assets and timeframes
🛠️ Designed for scalping, swing trading, and intraday setups.
🔔 Built-in alerts make automation seamless — no guesswork.
💡 Usage Tips:
Use clouds and trend labels to identify structure and bias
Trade breakouts when EMAs align and volume confirms
Look for pullbacks into the EMA zone and enter on resumption
📅 Market Hours Filter: Keeps signals relevant during core trading hours (9:30 AM–4 PM ET).
👤 Developed by @glapougbaegarmondeh
🧠 Version 1.0 | 📆 Released: April 24, 2025
Trend Analysis
ORB PRO | Buy & Sell | Dutch RoyalORB PRO | Buy & Sell
A turnkey Opening-Range Breakout solution that gives you breakout entries, multi-level exits, risk controls, on-chart analytics and instant backtesting—all configurable through easy dropdowns and sliders.
What You Get
Automatic Opening-Range Detection
Pick your “ORB” window (from 15 min up to 4 hr) and the indicator draws the high/low lines and shaded box for you.
Smart Breakout & Entry Logic
Choose whether to use the raw close price or an EMA for your breakout trigger.
Specify how many false–breakout retests to ignore before taking your signal.
Watch a “Buy” or “Sell” label appear exactly where your entry fires.
Three-Tier Take-Profits
Dynamic Mode: First TP at X % move; TP 2 and TP 3 at additional Y % increments.
ATR Mode: TP levels at configurable multiples of current ATR (e.g. 0.75×, 1.5×, 2.25×).
Flexible Stop-Loss Options
None (no stop at all)
Fixed % below/above entry
Safer, Balanced, or Risky price levels based on your opening range geometry
Adaptive SL toggle: automatically move your stop to breakeven once TP 1 hits
Clean Visual Controls
Turn the ORB box, historical zones, and EMA line on or off
Customize all colors and transparency with built-in pickers
No extra drawing tools required—everything lives in one indicator
Live On-Chart Dashboard
A small, movable table shows your current signal (Bullish/Bearish), entry price, real-time profit %, plus the next TP & SL levels
Perfect for seeing exactly where you stand without manual math
Instant Backtesting Summary
View total sessions, win/loss counts, win-rate, average & total profit %
Choose how much capital you “allocate” to each TP level with preset exit-ratio options (e.g. 90 %→TP 1, 5 %→TP 2, 5 %→TP 3)
Alert-Ready
Built-in alert conditions for Entry, Take-Profit, and Stop-Loss make it trivial to hook into emails, webhooks or automated execution.
How to Configure
Once you add ORB PRO to your chart, open its Inputs pane. You’ll find logically grouped controls:
Trading Logic: ORB duration, breakout source (Close/EMA), retest count, EMA length, TP style (Dynamic/ATR), SL style (None/Fixed/Safer/Balanced/Risky), Adaptive SL.
TP / SL Values: percentage thresholds or ATR multipliers for each TP, plus your fixed-SL percentage if you choose it.
Visuals: toggles for drawing the ORB box, past zones, EMA; plus color & opacity selectors.
Analytics Tables: enable and position both the live dashboard and the backtesting summary, and pick your exit-ratio breakdown for historical P&L.
ORB PRO | Buy & Sell | Dutch Royal is a technical analysis tool provided for educational and informational purposes only. It does not constitute financial, investment, or trading advice. Past performance and backtesting results are not indicative of future outcomes, and all trading involves risk—including the possible loss of capital. Always do your own due diligence, consider your personal financial situation, and consult a qualified professional before placing any trades. By using this indicator you acknowledge that you alone are responsible for your trading decisions and results.

Elliott Wave + Fibonacci Strategy (Long Only)This closed-source long-only swing strategy combines Elliott Wave principles with Fibonacci-based price projections and RSI momentum confirmation. It is designed to capture impulsive upward trends by identifying potential Wave 3 and Wave 5 setups within the Elliott Wave cycle. The strategy is both educational and practical for traders interested in systematic wave-based trading.
Core Logic Overview:
Wave Structure Detection
The script dynamically identifies potential Wave 1 lows and tracks Wave 2 retracements using pivot logic based on a configurable lookback (waveLen). It uses Fibonacci retracement ratios (default: 61.8%) to estimate the ideal Wave 2 correction.
Wave 3 Entry Signal
A Wave 3 Long entry is triggered when the price exceeds both the Wave 2 high and a Fibonacci-based Wave 3 target extension (default: 1.618x the Wave 2 range), provided RSI is above 50 to confirm bullish momentum.
Wave 5 Entry Logic
After Wave 3, a second entry may trigger when the price surpasses the Wave 3 target by an additional 2%, and RSI is above 60 — suggesting a possible Wave 5 extension.
Exit Conditions
A potential ABC correction is detected when price drops below the Wave 3 target and RSI dips under 50, prompting exits.
Additional risk control exits occur if RSI exceeds 70 after entry, suggesting overbought conditions.
User Inputs:
Swing Pivot Lookback (waveLen) – Number of bars to consider for pivot detection (default: 10)
Fib Retracement (fibRetrace) – Controls the Wave 2 retracement level (default: 0.618)
Wave 3 Extension Target (fibExtension) – Projects the Wave 3 price target (default: 1.618)
RSI Period – Used for momentum confirmation (default: 14)
Backtest Conditions:
Account size: $10,000
Risk per trade: 10% of equity
Commission: 0.1%
Slippage: 1 tick
Backtest duration: 2 years
Sample size: 100+ trades depending on market conditions and timeframe used
Best Use Case:
Optimized for 1H to Daily charts in trending markets
Works best on assets showing clear impulsive structures (e.g., crypto, indices)
This strategy is intended to help traders learn and apply Elliott Wave theory in a structured and rule-based format. It avoids repainting by using confirmed swing highs/lows and gives clear visual signals for entries, exits, and targets.

SynchroTrend Oscillator (STO) [PhenLabs]📊 SynchroTrend Oscillator
Version: PineScript™ v5
📌 Description
The SynchroTrend Oscillator (STO) is a multi-timeframe synchronization tool that combines trend information from three distinct timeframes into a single, easy-to-interpret oscillator ranging from -100 to +100.
This indicator solves the common problem of having to analyze multiple timeframe charts separately by consolidating trend direction and strength across different time horizons. The STO helps traders identify when markets are truly synchronized across timeframes, potentially indicating stronger trend conditions and higher probability trading opportunities.
Using either Moving Average crossovers or RSI analysis as the trend definition metric, the STO provides a comprehensive view of market structure that adapts to various trading strategies and market conditions.
🚀 Points of Innovation
Triple-timeframe synchronization in a single view eliminates chart switching
Dual trend detection methods (MA vs Price or RSI) for flexibility across different markets
Dynamic color intensity that automatically increases with signal strength
Scaled oscillator format (-100 to +100) for intuitive trend strength interpretation
Customizable signal thresholds to match your risk tolerance and trading style
Visual alerts when markets reach full synchronization states
🔧 Core Components
Trend Scoring System: Calculates a binary score (+1, -1, or 0) for each timeframe based on selected metrics, providing clear trend direction
Multi-Timeframe Synchronization: Combines and scales trend scores from all three timeframes into a single oscillator
Dynamic Visualization: Adjusts color transparency based on signal strength, creating an intuitive visual guide
Threshold System: Provides customizable levels for identifying potentially significant trading opportunities
🔥 Key Features
Triple Timeframe Analysis: Synchronizes three user-defined timeframes (default: 60min, 15min, 5min) into one view
Dual Trend Detection Methods: Choose between Moving Average vs Price or RSI-based trend determination
Adjustable Signal Smoothing: Apply EMA, SMA, or no smoothing to the oscillator output for your preferred signal responsiveness
Dynamic Color Intensity: Colors become more vibrant as signal strength increases, helping identify strongest setups
Customizable Thresholds: Set your own buy/sell threshold levels to match your trading strategy
Comprehensive Alerts: Six different alert conditions for crossing thresholds, zero line, and full synchronization states
🎨 Visualization
Oscillator Line: The main line showing the synchronized trend value from -100 to +100
Dynamic Fill: Area between oscillator and zero line changes transparency based on signal strength
Threshold Lines: Optional dotted lines indicating buy/sell thresholds for visual reference
Color Coding: Green for bullish synchronization, red for bearish synchronization
📖 Usage Guidelines
Timeframe Settings
Timeframe 1: Default: 60 (1 hour) - Primary higher timeframe for trend definition
Timeframe 2: Default: 15 (15 minutes) - Intermediate timeframe for trend definition
Timeframe 3: Default: 5 (5 minutes) - Lower timeframe for trend definition
Trend Calculation Settings
Trend Definition Metric: Default: “MA vs Price” - Method used to determine trend on each timeframe
MA Type: Default: EMA - Moving Average type when using MA vs Price method
MA Length: Default: 21 - Moving Average period when using MA vs Price method
RSI Length: Default: 14 - RSI period when using RSI method
RSI Source: Default: close - Price data source for RSI calculation
Oscillator Settings
Smoothing Type: Default: SMA - Applies smoothing to the final oscillator
Smoothing Length: Default: 5 - Period for the smoothing function
Visual & Threshold Settings
Up/Down Colors: Customize colors for bullish and bearish signals
Transparency Range: Control how transparency changes with signal strength
Line Width: Adjust oscillator line thickness
Buy/Sell Thresholds: Set levels for potential entry/exit signals
✅ Best Use Cases
Trend confirmation across multiple timeframes
Finding high-probability entry points when all timeframes align
Early detection of potential trend reversals
Filtering trade signals from other indicators
Market structure analysis
Identifying potential divergences between timeframes
⚠️ Limitations
Like all indicators, can produce false signals during choppy or ranging markets
Works best in trending market conditions
Should not be used in isolation for trading decisions
Past performance is not indicative of future results
May require different settings for different markets or instruments
💡 What Makes This Unique
Combines three timeframes in a single visualization without requiring multiple chart windows
Dynamic transparency feature that automatically emphasizes stronger signals
Flexible trend definition methods suitable for different market conditions
Visual system that makes multi-timeframe analysis intuitive and accessible
🔬 How It Works
1. Trend Evaluation:
For each timeframe, the indicator calculates a trend score (+1, -1, or 0) using either:
MA vs Price: Comparing close price to a moving average
RSI: Determining if RSI is above or below 50
2. Score Aggregation:
The three trend scores are combined and then scaled to a range of -100 to +100
A value of +100 indicates all timeframes show bullish conditions
A value of -100 indicates all timeframes show bearish conditions
Values in between indicate varying degrees of alignment
3. Signal Processing:
The raw oscillator value can be smoothed using EMA, SMA, or left unsmoothed
The final value determines line color, fill color, and transparency settings
Threshold levels are applied to identify potential trading opportunities
💡 Note:
The SynchroTrend Oscillator is most effective when used as part of a comprehensive trading strategy that includes proper risk management techniques. For best results, consider using the oscillator in conjunction with support/resistance levels, price action analysis, and other complementary indicators that align with your trading style.

The One StocksThe One – Stocks is a high-performance algorithm designed for serious traders seeking precision signals on major U.S. equities like SPY, QQQ, AAPL, and TSLA.
This strategy provides real-time buy/sell alerts, auto-generated stop loss & take profit levels, and integrates seamlessly with TradingView alerts.
✅ Optimized for 15m–4H charts
✅ Proven entries on trending markets
✅ Ideal for both scalping and swing trading
Key Rule: If a buy signal occurs at a higher high, wait for a retest of the signal level before entering. This increases precision and avoids chasing price.
🔒 This is an invite-only indicator.
🚀 Join the free trial and gain access: theonealgo.com

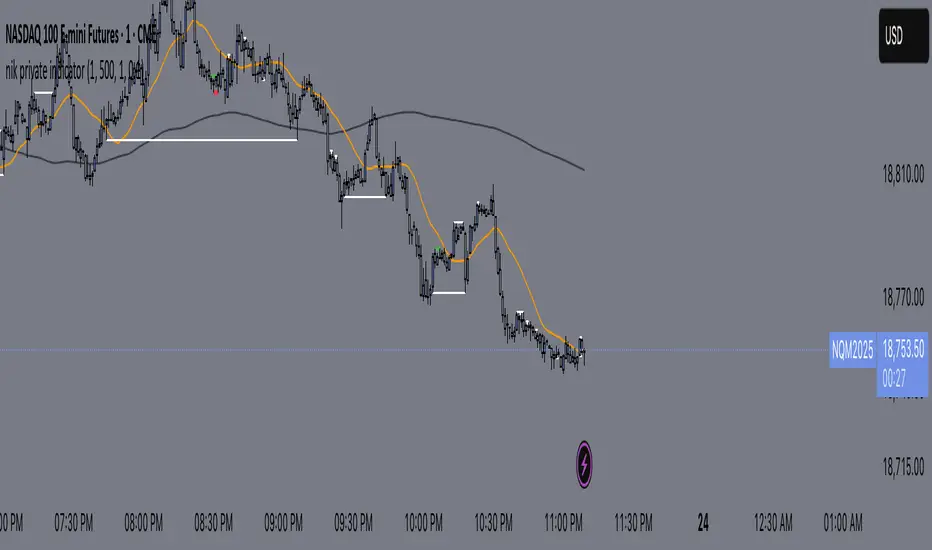
nik private indicatorlol eqx go brrr, this indicator helps mark out equal highs and lows, while alerting you, allowing for you to trade without watching the charts all session.
Ray’s Eye – ORB Strategy (Clean Lines)Marks the first high and low of the 15-minute candle. You would look for a trade upon the break and retest.

[Tradevietstock] Market Trend Detector_Pulse CrafterBest technical indicator to detect market trend- Pulse Crafter
Hello folks, it's Tradevietstock again! Today, I will introduce you to Pulse Crafter Indicator , which can help you identify market cycle and find your best entry/exit effectively.
i. Overview
1. What is Market Trend Detector_ Pulse Crafter?
Market Trend Detector_ Pulse Crafter is a robust TradingView indicator built to analyze market trends and deliver actionable insights across multiple asset classes. Packed with tools like Bollinger Bands, Ichimoku Cloud, customizable Moving Averages, the Tradevietstock Super HMA, and Beta Volatility Detection, it’s a comprehensive solution for traders seeking clarity in complex markets.
2. The Logic Behind
The market is highly unpredictable, and many traders may not possess advanced skills in data analysis or quantitative techniques. To address this, I developed an indicator that combines well-known trend-detection tools with enhanced mathematical functions for improved precision.
For example, I customized the Bollinger Bands by adjusting their color scheme to better reflect short-term trends. I also enhanced the widely-used Ichimoku Cloud indicator by adding a gradient color effect, making market trends more visually intuitive and easier to interpret. These thoughtful visual adjustments—built upon established technical analysis principles—help transform basic indicators into a more accessible and visually compelling toolset for traders.
In addition, the system includes a flexible combination of moving averages. Users can seamlessly switch between SMA (Simple Moving Average) and EMA (Exponential Moving Average) based on their preferences or trading strategy. This set includes six different moving averages, each with full monitoring capabilities for comprehensive trend tracking.
a. Bollinger Bands with display adjustment
Bollinger Bands can be used in trading to identify volatility, trend strength, and potential reversal points. When the price consistently touches or rides the upper band, it signals strong upward momentum, while riding the lower band indicates a strong downtrend. A common strategy is to use the middle band (a 20-period simple moving average) as dynamic support or resistance during trends. Another powerful setup is the Bollinger Band Squeeze, which occurs when the bands contract tightly—signaling a period of low volatility.
This often precedes a breakout; if the price breaks above the upper band with strong volume, it may suggest a buying opportunity, while a break below the lower band may indicate a potential short position. Traders can also watch for price to revert to the mean after touching the outer bands—especially in a ranging market—using the middle band as a target for profit-taking. However, it's essential to confirm these signals with other indicators or price action to reduce the risk of false entries. Some notable enhancements include the custom color settings, which help traders quickly identify short-term trends. A red band indicates a bearish trend, while a green band suggests a bullish trend. This visual cue allows traders to align their Buy and Sell decisions more effectively with the prevailing market direction shown by the indicator.
b. Ichimoku Clouds and the adjustment of colors
To use the Ichimoku Cloud effectively in trading, start by identifying the overall market trend. When the price is above the cloud, it's considered an uptrend; when below, it's a downtrend; and when it's inside the cloud, the market is likely ranging or neutral.
For a buy signal, traders typically look for the price to break above the cloud, the Tenkan-sen (conversion line) to cross above the Kijun-sen (base line), and the Chikou Span (lagging line) to be positioned above the price and the cloud—these conditions together signal strong bullish momentum. For a sell signal, the opposite applies: price breaks below the cloud, the Tenkan-sen crosses below the Kijun-sen, and the Chikou Span is below the price and cloud. Stop-losses are often placed just outside the opposite edge of the cloud, and traders may use the Kijun-sen as a dynamic trailing stop to lock in profits while riding the trend. It’s important to avoid trading when the price is inside the cloud, as this suggests indecision or a lack of clear direction.
c. Moving Average lines
With the Market Trend Detector_Pulse Crafter Indicator , traders have access to a flexible set of six Moving Averages, with the ability to switch between SMA (Simple Moving Average) and EMA (Exponential Moving Average) options. One of the most common strategies involving moving averages is the crossover technique, where a shorter-period MA crosses above (bullish signal) or below (bearish signal) a longer-period MA. While this strategy is widely used, it's important to note that it can sometimes produce false signals or delayed entries, leading to potential losses—especially in choppy markets. Therefore, I recommend that beginners go beyond just the crossover method and explore additional applications of moving averages. For instance, moving averages can serve as dynamic support and resistance levels, or be used as a statistical benchmark in more advanced strategies, helping traders gauge overall market momentum and make better-informed decisions.
d. Super HMA by Tradevietstock
The Super HMA (Hull Moving Average) in this script is particularly special due to its versatility, enhanced responsiveness, and built-in trend visualization features. Unlike the standard HMA, this implementation allows users to choose from three different variants—HMA, THMA (Triple Hull Moving Average), and EHMA (Exponential Hull Moving Average)—each offering a unique level of sensitivity and smoothing based on their internal weighting formulas.
This flexibility enables traders to adapt the moving average behavior to fit various market conditions or personal strategy preferences. The logic behind the HMA is designed to reduce lag while maintaining a smooth curve by using a combination of weighted moving averages. Specifically, it doubles the WMA of a shorter period, subtracts the WMA of a longer period, and then applies a final smoothing step using the square root of the length. On top of that, the script includes dynamic trend coloring, where the HMA line changes color based on its slope, visually indicating bullish or bearish momentum. This is further enhanced by the ribbon-style plotting and optional ATR-based bands, which highlight volatility zones and help identify strong trend conditions, making the HMA not just a trend filter but a visually intuitive trading tool.
e. True Range Bands and Beta Volatility
This is the most important feature in the entire script. I built it to better detect market trends and capture decisive movements that could signal either a reversal or a strong confirmation.
The True Range Band is a dynamic indicator built on the Average True Range (ATR), designed to adapt to market volatility in real time. Unlike traditional indicators that use static ranges or fixed values, the True Range Band adjusts its upper and lower limits based on recent market activity. It wraps around a Hull Moving Average (HMA), expanding during high volatility and tightening during quiet periods. This makes it particularly useful for identifying trend strength, breakout opportunities, and potential reversal zones. Because it reacts to the intensity of market movement, traders can use it to fine-tune their entry and exit points with greater precision than with standard tools like Bollinger Bands.
The Beta Volatility Detection feature adds another layer of sophistication by incorporating a statistical approach to measuring how much an asset moves in relation to a broader market index, like the S&P 500. This is done by calculating the beta coefficient over a specified lookback period, revealing whether an asset is trending more aggressively than the market itself. When beta exceeds a certain threshold, the system highlights it visually, signaling a strong market trend or deviation. This helps traders stay aligned with momentum-driven movements and avoid false signals that more rigid indicators might miss.
II. How to Use and Trade with the Trend
1. Setting Up
There are two core setups available for traders, but let’s start with the one I personally use the most:
a. Default Setting (My Go-To Setup)
In the Default setting, we activate the True Range Bands, the 250 and 100 Simple Moving Averages (SMA), and Beta Volatility Detection. This is my preferred configuration, and for good reason.
Unlike traditional strategies that rely heavily on moving average crossovers, I use moving averages purely as statistical reference points. According to Tradevietstock's framework, the SMA 250 represents the long-term trend. Every time the price touches or reacts to this line, it means something—it’s not random. It’s a statistically significant moment, and that's where we pay close attention.
The True Range Bands are the star of this setup. They’re designed to adapt to volatility and highlight moments when the price breaks out of its recent range. If the price pushes above or below these bands, it often signals one of two things: either a reversal of the previous trend or a strong confirmation that the current trend still has fuel. Either way, these are decision points.
Then there’s Beta Volatility, which helps us read the pulse of the market. When beta spikes beyond our set threshold, it tells us that the asset is diverging from the broader market with strength—that’s exactly the kind of action we want. On the other hand, flat, low-volatility conditions are where trades go to die. We don’t trade in sideways markets. We wait for volatility, because we trade the trend, not the noise.
b. Alternate Setting with Basic Indicators (Beginner-Friendly, Still Powerful)
While this isn’t my primary setup, it’s still extremely useful—especially for newer traders who haven’t yet developed statistical techniques or quantitative experience. Think of this as the go-to mode for beginners who are still getting familiar with trend detection tools.
In this setup, you’ll be working with Bollinger Bands, Ichimoku Clouds, and Moving Average strategies. These are foundational indicators that have stood the test of time. They’re visually intuitive and easy to interpret, making them perfect for anyone still building their trading instincts.
Bollinger Bands help you understand volatility and identify price extremes. When the price touches or moves outside the bands, it can signal potential reversals or the continuation of a breakout.
Ichimoku Clouds offer a full-picture trend framework—support, resistance, momentum, and even future projections—all in one. It's a bit complex at first glance, but once you get used to it, it’s a powerful all-in-one tool.
Moving Averages (like the 10, 50, 100, or 200 SMA/EMA) let you track trend direction and strength over various timeframes. While I personally don’t trade off MA crossovers, they’re still valuable for understanding the market’s broader structure.
This setup is less about statistical modeling and more about building good habits: watching trend alignment, understanding support/resistance zones, and staying on the right side of momentum. If you’re just starting out, it’s a solid, practical foundation that can take you far.
2. Trading strategy according to each set up
a. Default Mode
With my go-to setup, we focus heavily on price breakouts and the background color, which signals high volatility in the market. These are the moments when the market speaks loudest—either a trend is about to explode or reverse sharply. But there’s another key piece we watch closely: the distance between the current price and the 250-day moving average (SMA 250). This gap isn’t just a visual—it's a risk gauge.
The larger the gap between price and the 250-day moving average (SMA 250), the higher the risk—especially for newcomers. When price stretches too far above this long-term average, it often signals overextension. A sharp spike above the 250MA isn’t a green light to buy—it’s usually a warning. It can indicate that the market is overheating, often driven by FOMO and greed, not fundamentals. That’s the moment to consider taking profits, scaling out, or even fully cashing out, because these parabolic moves frequently mark a market top.
Recognizing these extremes helps you avoid chasing hype and getting trapped in the inevitable pullback. A perfect example is TSLA, which was recently trading nearly 94% above its 250-day moving average. That kind of distance is not a smart entry—it’s a caution flag. And this is exactly why I treat the 250MA as a benchmark, not a signal. It’s a context tool that helps you understand when the market is out of balance, not something to blindly trade off of.
Now let’s apply another part of the Default Mode: breakouts and volatility. When price breaks above the True Range Bands and then crosses above the SMA250, it’s a strong bullish signal. This combo often confirms a trend reversal from a bear market. That’s the perfect moment to BUY.
This strategy helps us capture both the right timing and price zone for entering a new bull market. Take the example we used earlier—the stock doubled after the initial buy, perfectly aligning with the breakout signals from this indicator.
Furthermore, avoiding flat markets is essential—especially in the CFD market, where no trend means no trade. This is where Beta Volatility becomes critical. It helps us identify whether we’re in a bull or bear phase, so we can position ourselves early and ride the wave ahead. Once the trend is confirmed, we use the other tools in this strategy—like True Range Bands and SMA benchmarks—to catch the right signals and execute high-probability trades.
Example: With AMZN, we saw the price break below the True Range Bands—an early bearish signal. This was followed by a sharp drop that pushed the price below the 250-day moving average (SMA250), all during a period of high volatility. Together, these signs confirm a strong bearish trend in AMZN, indicating that the stock has entered a bear market phase.
=> With this Default Mode strategy—built on True Range Bands, Beta Volatility, and the SMA250—we can easily identify the trend and time our entries and exits with precision.
✅ Buy/Entry Signals: Breakout above True Range Bands + Breakout above SMA250 + High Volatility (confirmed by Beta Volatility)
This combo signals strong momentum and a trend shift—ideal for entry.
❌ Sell/Exit Signals: Breakout below True Range Bands + Breakout below SMA250 + High Volatility (confirmed by Beta Volatility)
This combination signals strong downside momentum and potential trend reversal—ideal for exiting or shorting.
b. Basic Strategy for Newbies
Buy/Entry Signals
As I’ve mentioned before, we only trade when there’s a trend—no trend, no trade. In this basic strategy, a bullish signal begins when the Bollinger Bands turn green, indicating upward momentum. But we don’t rely on that alone. We wait for additional confirmation, such as a shorter moving average crossing above a longer moving average, which signals trend strength and continuation.
For example, I applied this setup with LMT (Lockheed Martin). After the Bollinger Bands turned green and the moving averages crossed bullishly, I entered the trade. The result? LMT rose by around 15%—a solid move confirmed by simple, beginner-friendly indicators.
Sell/Exit Signals
Conversely, for sell or exit signals, we look for the Bollinger Bands to turn red, indicating bearish momentum. We also wait for the shorter moving average to cross below the longer one, confirming a downtrend. Additionally, price should break below key support levels or moving averages to validate the breakout.
For extra confirmation, we can use Ichimoku Clouds. The larger the cloud, the stronger the trend. Its color also reflects trend strength, making it a useful tool to support the trading signals mentioned above. A large, bold green cloud indicates a strong bull market. The size and intensity of the color reflect strong momentum and trend confidence, signaling that buyers are firmly in control.
During a major trend, minor correction waves are normal. To determine whether it's just a small pullback or a true reversal, watch the size of the Ichimoku cloud and the direction and color of the Super HMA. If the HMA changes color and the correction cloud begins to grow significantly, that's a warning sign of a potential reversal. In this case, you should strongly consider exiting the trade, or at the very least, adjust your position and tighten your risk management to protect your account.
The Super HMA acts as a short-term trend signal, allowing you to trade in sync with the current market direction. It’s a flexible strategy that adapts as the trend evolves, but this flexibility also means that minor correction waves can affect your profits, since your positions adjust frequently.
When the HMA turns green and price aligns with its direction, it’s a strong sign to hold your position. However, if price breaks below the HMA, that’s your exit signal. At this point, you should turn to other indicators—like the Ichimoku Cloud—for confirmation before re-entering. For example, if the price falls into a large green cloud, it likely indicates a minor correction rather than a full reversal. In that case, it may be a solid opportunity to buy the dip, just as demonstrated in the example below.
iii. Optimal Use by Market Type
Here’s how we suggest using Pulse Crafter depending on what you trade:
Stocks: Best used on the Daily or Weekly chart for swing trades.
Cryptocurrency: Works well on BTC, ETH, or major altcoins using Daily and Weekly charts. Great for catching larger trend reversals.
CFDs and Forex: QFI is built for higher timeframes (H4, D1, W1), where it produces cleaner and more reliable signals.
Best Ways to Use It
🟢 Stocks
Works well on Weekly and Daily charts for swing entries
🟡 Crypto
Works best on Weekly and Daily charts
Good for trend-catching on BTC, ETH, or altcoins
🔴 CFDs
Designed with precision in mind — works on bigger timeframes, like H4, D1, and W1
The Pulse Crafter Indicator is a flexible and powerful tool for navigating full market trends. Its ability to highlight key phases and generate timely signals makes it easier to plan entries, ride trends with confidence, and exit at the right moments.
In addition to its core features, Pulse Crafter supports multiple indicators for confirmation, allowing traders to strengthen their strategies with additional layers of insight. Whether you're trading the spot market or CFDs, and especially when working with larger timeframes like daily (D) or weekly (W), this indicator helps you trade with clarity and confidence.
If you're serious about understanding market structure and improving your timing, Market Trend Detector_Pulse Crafter, the best Indicator to detect market trends, can become a central part of your strategy — no matter what market you're in.

Ray’s London Session – 15m High/Low + Shaded ZoneMarks the high and low of the first 15-minute candle to determine the opening range. You would look for an entry upon retesting.

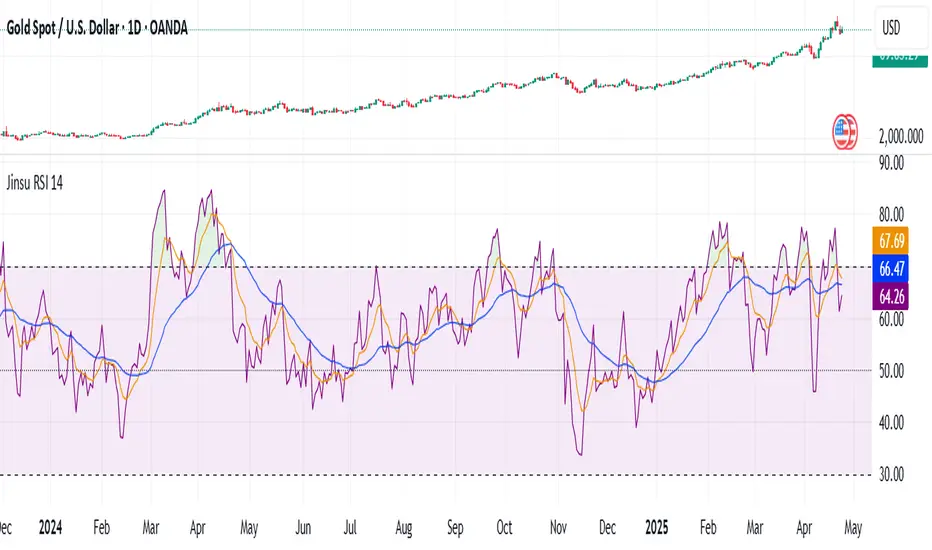
Jinsu RSI 14### 🔍 **Jinsu RSI 14 – EMA 9 & WMA 45**
**Description:**
This custom indicator combines the classic RSI (Relative Strength Index) with two moving averages — EMA (Exponential Moving Average) and WMA (Weighted Moving Average) — applied directly to the RSI value to provide more nuanced momentum signals.
### 📊 **How It Works**
- **RSI 14** measures market momentum and identifies overbought (above 70) or oversold (below 30) conditions.
- **EMA 9 on RSI** responds quickly to short-term changes, signaling momentum shifts.
- **WMA 45 on RSI** captures long-term sentiment, while placing more emphasis on recent data.
### 🧠 **Signal Interpretation**
- **RSI crosses above EMA 9** → Possible bullish momentum shift.
- **RSI falls below EMA 9** → Possible bearish momentum shift.
- **EMA 9 crosses above WMA 45** → Strong bullish momentum.
- **EMA 9 falls below WMA 45** → Strong bearish momentum.
- **RSI is between EMA 9 & WMA 45** → Market may be consolidating or oscillating.
### 🎨 **Visual Enhancement**
- The neutral zone (RSI between 30–70) is lightly shaded purple to reduce visual noise.
- When **RSI > 70**, a green color appears and intensifies with higher RSI values, highlighting strong buying pressure.
- All values are displayed with two decimal precision for clarity.
This tool is ideal for trend-following traders and momentum-based strategies, helping you recognize early shifts in market sentiment with visual cues and cross confirmations.
[iQ]PROMEGAiQ v33PROMEGAiQ v33 ( PROMEGAv33)
A powerful composite indicator suite offering insights into momentum, volatility, and order flow within a dedicated pane, plus optional chart overlays.
Key Components: Presents a blended "Master Composite Signal" (Fractal + MDCO), statistical volatility bands, an Order Flow oscillator, and selectable MKR smoothing.
Purpose: Useful for assessing trend strength, spotting potential exhaustion zones using the bands, analyzing volume-driven pressure, and optionally viewing standard MAs/Bands on the main chart.
Good For: Traders seeking a multi-dimensional perspective from a single indicator pane, combining different analytical approaches for potentially higher confluence signals.
MARKETMAKERiQ

Daily + Weekly + H4 Bias📈 What does the “Daily + Weekly + H4 Bias” indicator do?
It shows the market direction (bias) across three timeframes:
• 🔹 H4 Bias: Based on the last 4-hour candle (bullish or bearish)
• 🔹 Daily Bias: Based on yesterday’s close relative to the previous day’s range
• 🔹 Weekly Bias: Based on last week’s close compared to the prior week’s high/low
⸻
🧠 Why it’s useful:
• Helps you understand short, mid, and long-term trends
• Lets you filter trades (e.g., only trade CHoCH in the direction of the bias)
• Useful for multi-timeframe alignment, like ICT teaches

Session Open Lines [iFarsheed]Overview:
The "Session Open Lines " indicator is mainly designed for Al Brooks Price Action traders using 5-minute charts, particularly during the NYSE session. It marks Tokyo, London, and NYSE session open/close times with dashed lines and optional labels to help you analyze session-based price movements.
Features:
Session Marking:
Draws dashed lines to indicate the open and close times of Tokyo, London, and NYSE sessions.
NYSE session can be split into two or three parts for detailed analysis (e.g., Morning/Afternoon or Open/Middle/Close).
Optional Labels:
Displays labels (e.g., "Tokyo Open", "NYSE Close") below the chart to clearly identify session boundaries.
Labels can be toggled on or off for a cleaner chart view.
Customizable Display:
Choose which sessions to display and customize line colors to match your chart setup
How to Use:
Customize Settings:
Enable or disable specific sessions (Tokyo, London, NYSE) based on your trading focus.
Adjust line colors to ensure visibility against your chart background.
Toggle session labels on or off depending on your chart type (e.g., disable for RTH charts)
Analyze Session Boundaries:
Use the dashed lines to identify session open/close times and analyze price action around these key moments.
For NYSE session, split into two or three parts to break down the session into manageable segments for deeper analysis.
Informed Decision Making:
Leverage session boundaries to spot potential price action setups, such as breakouts or reversals, especially during the NYSE session
Important Note:
Due to Pine Script limitations (max 500 lines), if all sessions are enabled, lines are drawn for the past 5 days. Selecting fewer sessions allows more days to be displayed.
Lines are drawn only up to the current time; future session lines (e.g., NYSE Close) won't appear until the session ends.
For RTH charts, use only the NYSE session. It’s recommended to disable labels in RTH mode, as NYSE Open and Close lines are close together and labels may overlap.
Future Updates:
This indicator is just the beginning! Exciting new features are on the way to make your price action analysis even more powerful—stay tuned for updates!
If you have any suggestions or feedback, please share them in the comments section.
Happy Price Action Trading!
-iFarsheed-

AIWAY - Consensus AI MTF Analysis
HOW-TO:
AIWAY – Consensus AI MTF Analysis
Overview
A versatile tool designed for all traders across Forex, Indices, Commodities, Stocks, and Cryptocurrencies. It employs a multi-timeframe analysis framework, integrating a suite of technical indicators with an AI-driven weighting system to deliver actionable market insights.
How It Works
Analyzes data across user-configurable timeframes, ranging from 5 minutes to 1 week (e.g., 5m, 10m, 15m, 30m, 60m, 120m, 240m, 480m, 1D, 1W). It calculates signals from a comprehensive set of technical indicators, including:
• Moving Averages (MA): Supports SMA, EMA, WMA, DEMA, and TEMA to identify trend direction.
• Stochastic RSI: Assesses momentum and overbought/oversold conditions.
• Relative Strength Index (RSI): Evaluates price strength for potential reversals.
• MACD: Tracks trend momentum via fast and slow EMA crossovers.
• Divergence Detection: Identifies price-RSI discrepancies for reversal signals.
• SMA Cross: Monitors 50-period and 200-period SMA crossovers for trend shifts.
• On-Balance Volume (OBV): Confirms trends through volume flow analysis.
• Ichimoku Cloud: Provides trend and support/resistance insights.
• Supertrend: Determines trend direction using ATR-based calculations.
These signals are aggregated into three scores:
• Short-Term Score: Derived from shorter timeframes (e.g., 5m to 240m), ideal for day trading.
• Medium-Term Score: Based on mid-range timeframes (e.g., 360m to 1D), suited for swing trading.
• Long-Term Score: Calculated from longer timeframes (e.g., 2D to 1W), tailored for position trading.
Consensus Score:
• -100 to -30: Strong bearish bias (consider shorts/exit longs).
• -30 to +30: Neutral/consolidation (reduce position size).
• +30 to +100: Strong bullish bias (consider longs/exit shorts).
The aggregation process leverages AI-optimized weights, which are dynamically adjusted to enhance signal reliability based on current market conditions.
AI Module: Functionality and Impact
The AI module is the cornerstone of adaptability, utilizing reinforcement learning to optimize indicator performance. Key features include:
• Dynamic Weight Adjustment: Each indicator (e.g., MA, RSI, MACD) is assigned a weight (0.1 to 5.0), which is updated based on its ability to predict the next closing price. This is achieved through a linear regression model using the past 200 closing prices.
• Volatility-Adaptive Learning Rate: The learning rate scales with market volatility, calculated as the daily Average True Range (ATR) divided by the daily close price. This ensures the indicator remains responsive in both trending and choppy markets.
• Mutation for Exploration: If a term score (short, medium, or long) fails to improve, weights are mutated by a factor influenced by the learning rate, introducing variability to discover better configurations.
• Predictive Feedback Loop: The module compares predicted closes to actual closes, rewarding or penalizing weights to prioritize indicators that perform well under current conditions.
This AI-driven approach enhances the indicator’s robustness, as it continuously adapts to market dynamics, potentially reducing false signals and improving decision-making compared to static indicator setups.
Reading and Interpreting the Data
Output table is structured as follows:
• Columns: Include the timeframe and signals for each indicator (e.g., MA Signal, Stochastic RSI, RSI Signal, MACD, Divergence, SMA Cross, OBV, Ichimoku, Supertrend).
• Rows: Represent each selected timeframe, displaying the corresponding indicator signals or values.
• AI Consensus Scores: Shown at the table’s top for short-term, medium-term, and long-term analyses, expressed as numerical values (e.g., 45.67).
• Scale Visualization: A separate table maps these scores onto a -100 to 100 scale, divided into 20 segments. A marker (◉) indicates the score’s position, with colors transitioning from bearish (red) to bullish (green).
Color Coding:
• Green: Bullish signals (e.g., price above MA, RSI > 50).
• Red: Bearish signals (e.g., price below MA, RSI < 50).
• Gray: Neutral signals (e.g., MACD histogram near zero).
• Special Cases: Overbought (red) for Stochastic RSI/RSI > 70; oversold (green) for values < 30.
Traders can interpret the data by focusing on the consensus scores and scale to assess overall market sentiment. For example, a medium-term score of +60 in the bullish region suggests strong upward momentum over days, while the table’s indicator signals provide detailed context for confirmation.
Benefits for Traders Across Assets
AIWAY provides significant advantages for traders across all markets:
• Multi-Timeframe Perspective: Enables traders to identify trend alignments (e.g., bullish signals across 4H and 1D) or divergences (e.g., short-term bullish, long-term bearish), catering to day, swing, and position trading strategies.
• Replaces 9+ standalone indicators with one AI-optimized workflow.
• Identifies divergences across timeframes most humans miss (e.g., hourly bullish + weekly bearish = caution).
• AI-Enhanced Accuracy: The adaptive weighting system prioritizes reliable indicators, potentially reducing noise and improving signal quality in volatile or trending markets.
• Universal Applicability: The use of standard technical indicators ensures compatibility with Forex, Indices, Commodities, Stocks, and Crypto, making it versatile for diverse portfolios.
• Visual Clarity: The color-coded table and scale allow traders to quickly assess market conditions, facilitating rapid decision-making under time constraints.
• Timeframe-Specific Insights: Short-term scores support intraday trading, medium-term scores aid swing trading, and long-term scores guide long-term investments.
Practical Applications
• Trend Confirmation: A bullish MA and Supertrend on the 4H timeframe, paired with a positive medium-term score, may confirm an uptrend for swing traders.
• Reversal Detection: Divergence signals alongside oversold Stochastic RSI on lower timeframes can highlight potential reversals for day traders.
• Cross-Asset Trading: Traders can apply indicator to Crypto for short-term volatility plays or to Stocks for long-term trend analysis, leveraging its universal design.
Usage on TradingView
To use AIWAY on TradingView:
1. Search for “AIWAY – Consensus AI MTF Analysis” in the indicator library and add it to your chart.
2. Set the chart to the 4-hour timeframe to view the table and consensus scores.
3. Use the table and scale to assess market sentiment, cross-referencing with price action for confirmation.
AIWAY – Consensus AI MTF Analysis is a powerful tool for traders seeking a comprehensive, AI-enhanced approach to market analysis. Its multi-timeframe framework, adaptive AI module, and clear visual output make it an invaluable asset for navigating Forex, Indices, Commodities, Stocks, and Crypto markets. By providing actionable insights across short, medium, and long terms, AIWAY empowers traders to make informed decisions with confidence.
Disclaimer
The AIWAY indicator is likely for educational purposes only and not investment advice. Trading with it seems to involve high risk, with potential for total loss. Past performance probably does not predict future results; use at your own risk.

[iQ]PRO CHAOTIQ FRACTAL ENGIN33PRO CHAOTIQ FRACTAL ENGIN33
Navigate market dynamics with the CHAOTIQ FRACTAL ENGIN33. This indicator combines advanced concepts into a visual framework for analysing price action.
What it is: A sophisticated toolkit featuring adaptive channels (FRAMA & PFCC) and a forecasting component (ChaotiQ Synergy) designed to interpret market behaviour.
How it helps: Aims to clarify potential trends, highlight adaptable support/resistance areas sensitive to volatility, and offer insights into potential future price development and timing.
Use Cases: Utilize it for confirming trends, spotting potential reversal zones, identifying breakout opportunities, and exploring potential future market structure.
MARKETMAKERiQ


Big Wave Stock Signal Tool### Script Purpose, Function, and Value
The Big Wave Stock Signal Tool is a visual environmental awareness aid that has been used within educational content provided by Life Publishing Co.
The purpose of this script is to assist in the bird's eye view of market conditions by detecting specific price structures and trend tendencies based on objective criteria and displaying signs on a chart.
The tool analyzes the structure mainly from the following perspectives
Slope and order relationship of moving averages (short, medium, and long term)
Momentum status by RSI (Relative Strength Index)
Volume and its level (compared to the 20-period moving average)
Direction of the candlestick (daily or weekly)
When these factors are in combination, the “Buy Signal” will be lit, and when the opposite conditions are met, the “Close Signal” will be displayed.
This provides reference information for visually confirming the “timing that can be regarded as a structural milestone” on the chart.
Please note that this script is intended only as an information aid and is not intended to make individual investment decisions or provide trading advice. Final decisions should be made at the discretion and responsibility of the user.
### Proving Uniqueness
This tool is unique in that, while employing classic technical indicators, it focuses on “consistent structure determination by combining multiple conditions.
In addition to general moving averages, different types of MAs (WMA/EMA/SMA) are used for different purposes, and their slope, order, and intersection are comprehensively evaluated.
By incorporating daily and weekly positive/negative decisions (MTF-like perspective), it is also possible to confirm environmental consistency independent of a single time axis.
RSI and volume filters are also used as additional consistency factors, and sensory factors such as overheating and the strength of supply and demand are integrated into the logic.
As a result, the scripts specialize in extracting only “structural situations” in which multiple perspectives overlap, rather than noisy signals based on “single indicator condition matching.
The script is not merely a parallel set of conditions, but is intentionally designed to link multiple perspectives such as environmental awareness, momentum, and consistency, and is unique in that each component functions in its own role.
### Signal Logic
The signals in this script are displayed based on the following clear rules.
Buy Signal (Signal for a major wave to occur)
A blue arrow appears at the bottom of the chart when all of the following conditions are met: ・ Short-term WMA (10) and medium-term WMA (21)
Short-term WMA (10) and intermediate-term WMA (21) are rising.
The medium-term EMA (21) and long-term SMA (80) are pointing upward and the sequence “Short-term > Medium-term > Long-term” is established.
The daily candlestick is positive (close > open).
The weekly candlestick is also positive.
Volume is above the 20-period moving average.
RSI (80) is above 50
The on/off status and threshold of each factor can be flexibly adjusted from the settings screen.
Close Signal
When any of the following conditions are met, a red down arrow will appear on the chart:
The short-term MA has broken below the intermediate-term MA.
Or, the Short-term MA falls below both the Medium-term and Long-term MAs at the same time (can be adjusted).
In this way, from a buy signal to an exit signal is defined by explicit conditions based on structural changes, and is intended to assist in visually confirming a series of trends.
### Reason and purpose of the mashup
This tool aims to capture chart structure from a more multifaceted perspective by combining several technical indicators, including
Moving averages (short-term WMA, medium-term EMA, long-term SMA): Basic trend indicators for confirming market trends
RSI (Relative Strength Index): an indicator that quantifies momentum
Volume: An indicator that confirms the strength of market participation behind price fluctuations
Weekly Positive (multi-time factor): Confirmation of long-term market conditions.
Each of these indicators does not function in isolation, but is combined in terms of trend direction, strength, volume, and momentum consistency to function as an integrated sign on the chart.
### Closed Source Justification
Although this script is available to the public, the source code is provided in a closed (protected) format for reasons of logic preservation, prevention of misunderstanding, and maintenance of educational design.
The script is provided in a protected format for reasons of preservation of the logic, prevention of misunderstanding, and maintenance of the educational design.
The tool is linked to educational content and must be used correctly in context.
The protected format allows users to adjust only the settings and avoid excessive manipulation of the logic part.
TradingView's script disclosure rules also state that if “a reasonable non-disclosure reason is explained for the protected script,” then it can be disclosed without any problems.
The protected format also reduces the risk of users accidentally corrupting or altering the logic, and is effective in maintaining the original structural integrity of the script.
### Auxiliary Functions
Automatically displays 3 charts: Short-term WMA (10), medium-term EMA (21), and long-term SMA (80)
On/off toggle of RSI (80 periods)
Filtering by volume average (20 SMA)
Positive/negative daily/weekly signals (included as a condition for visual aids)
Signs are color-coded for upward (Buy)/downward (Close) movement
### UI Translation Guide (Settings)
Buy Signal: Signal for a large wave (blue up arrow)
Close Signal: Signal for the end of a major wave (red down arrow)
Short-Term MA (WMA 10): Short-term moving average (WMA 10)
Mid-Term MA (EMA 21): Mid-term moving average (EMA 21)
Long-Term MA (SMA 80): Long-term moving average (SMA80)
Volume MA (SMA 20): Moving average of volume (20 periods)
Relative Strength Index (80): RSI (Relative Strength Index (80 periods))
Daily/Weekly Bullish Candle: daily/weekly bullish decision (Close > Open)
### Disclaimer
This script is intended to provide information and learning support, and is not intended to recommend or advise trading decisions for specific financial instruments. Actual investment decisions should be made at your own risk and discretion. Past price movements and detected patterns do not guarantee future results.
Signs and information displayed are only to assist in viewing the chart structure and are not intended to have any direct influence on trading decisions or profit/loss results.

trail Timeframe Divergence TableFirst Version of Timeframe Divergence which can possibly point to a potential reversal

WIFX RSI SMART 1314📈 Did You Know RSI Is More Than Just “Overbought/Oversold”
If you're only using RSI to spot overbought and oversold zones, you're **missing out on high-accuracy trading opportunities**.
🔥 With the **Smart RSI Trend Detector**, you’ll unlock advanced RSI-based trading power:
🎯 MARKET TREND DETECTION
Quickly identify market direction by analyzing **RSI Overbought/Oversold zones**. Spot trend reversals and trend starts earlier — with more confidence.
⚡ EARLY ENTRY SIGNALS WITH RSI & MA CROSSOVERS
When RSI crosses above or below the Moving Average, the tool **automatically alerts you** to potential early entries — often before the price makes its move.
🔄 RSI DIVERGENCE ALERTS
Detect hidden or classic **divergence between RSI and price**, giving you an edge in catching powerful reversals or exiting positions at the right time.
🔔 Real-Time Alerts Sent to Your Phone
No need to sit in front of charts!
The tool will **automatically send alerts** (Buy/Sell signals, RSI cross, Divergence…) to your phone, email, or webhook via TradingView Alerts.

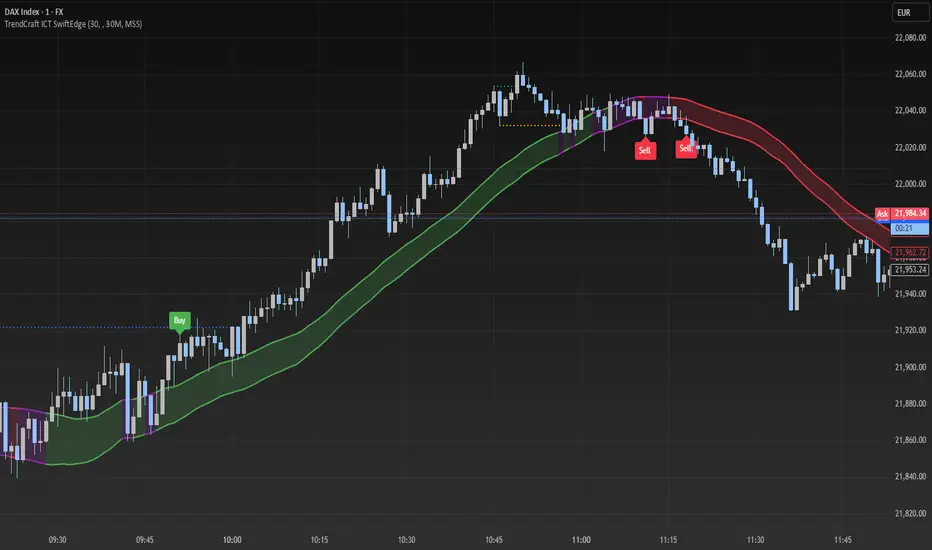
TrendCraft ICT SwiftEdge// The TrendCraft ICT SwiftEdge is a trend-following indicator that combines Simple Moving Averages (SMAs) with Inner Circle Trader (ICT) concepts, specifically Break of Structure (BOS) and Market Structure Shift (MSS), to generate precise buy and sell signals. This unique mashup leverages the strengths of trend confirmation through SMAs and market structure analysis via ICT to help traders identify high-probability trend entries. The indicator is designed to be intuitive, customizable, and suitable for traders of all levels seeking to align with market trends on various timeframes.
//
// ### What It Does
// The indicator plots two SMAs based on the high and low prices of candles to define the trend direction. It colors the SMAs and fills the area between them to visually indicate whether the price is in a bullish (above both SMAs), bearish (below both SMAs), or neutral (between SMAs) state. Simultaneously, it identifies BOS and MSS levels on a user-defined higher timeframe to confirm trend continuation or reversal points. Buy and sell signals are generated when the price closes above/below the latest BOS or MSS level (based on user preference) while also being correctly positioned relative to the SMAs, ensuring alignment with the trend.
//
// ### Why Combine SMAs and ICT?
// SMAs provide a reliable way to gauge trend direction by smoothing price data, but they can lag or generate false signals in choppy markets. ICT's BOS and MSS concepts address this by focusing on key market structure breaks, offering context for significant price movements. By requiring price to close beyond a BOS or MSS level and align with the SMA-defined trend, the TrendCraft ICT SwiftEdge filters out noise and enhances signal reliability. This combination creates a robust system that balances trend-following simplicity with structural market insights, making it ideal for trend traders.
//
// ### How to Use
// 1. **SMA Length**: Adjust the `SMA Length` (default: 20) to control the sensitivity of the SMAs. Shorter lengths react faster to price changes, while longer lengths provide smoother trends.
// 2. **Structure Timeframe**: Set the `Structure Timeframe` to a higher timeframe (e.g., "1H" on a 15M chart) to calculate BOS and MSS levels. This ensures structural signals are based on significant market moves.
// 3. **Chart Timeframe**: Select the `Chart Timeframe` to optimize pivot point calculations for your current chart (e.g., "30M" for a 30-minute chart).
// 4. **Signal Type**: Choose between "BOS" (default) for signals based on trend continuation breaks or "MSS" for signals based on potential reversal points (breakers).
// 5. **Display Options**: Enable/disable `Show Continuation (BOS)` and `Show Breaker (MSS)` to toggle the visibility of BOS and MSS lines. Customize their colors for better chart clarity.
//
// ### Signals
// - **Buy Signal**: Appears when the close price crosses above the latest BOS or MSS level (based on Signal Type) and is above both SMAs, indicating a bullish trend entry. Marked with a green "Buy" label.
// - **Sell Signal**: Appears when the close price crosses below the latest BOS or MSS level (based on Signal Type) and is below both SMAs, indicating a bearish trend entry. Marked with a red "Sell" label.
//
// ### Originality
// The TrendCraft ICT SwiftEdge stands out by integrating the trend-following reliability of SMAs with the structural precision of ICT's BOS and MSS. Unlike standalone SMA or ICT indicators, this script requires both trend alignment and structural confirmation, reducing false signals. The user-selectable Signal Type (BOS or MSS) adds versatility, allowing traders to adapt the indicator to trend-following or counter-trend strategies. Its dynamic timeframe adjustments and visual clarity make it a unique tool for traders seeking to capture trend entries with confidence.
//
// ### Notes
// - Ensure the `Structure Timeframe` is higher than your chart timeframe to avoid calculation issues.
// - Signals are generated only when the trend state changes to avoid redundant signals in the same trend direction.
// - Past performance is not indicative of future results. Always combine this indicator with other analysis and risk management techniques.
Big Wave Stock Signal Revised:
Big Wave Stock Signal Revised is an educational tool developed to aid in the detection of stock market trends. It is used in free investment seminars offered by Life Publications, Inc.
This system detects when both "environmental consistency" (trend structure) and "chart pressure structure" (pattern formation) occur simultaneously. It then clearly shows when a breakout occurs on the chart as a "first move signal" and provides a "trend first move" signal. Its purpose is to help you detect the "phase considered to be the initial move of a trend."
Specifically, the order of short-, medium-, and long-term exponential moving averages (EMAs) is evaluated on multiple time frames (1-hour, 4-hour, and daily). Only when an "upward perfect order" (20 > 80 > 200 EMA) is established on all time frames is the next step taken: determining if the chart structure has broken.
Structure Recognition automatically detects an ascending triangle based on the most recent pivot highs and lows. It displays a "Signal of Big Wave Detection" when the upper edge line is exceeded. Additionally, the system internally manages stop/limit orders for virtual positions and automatically displays a "Signal of Big Wave Termination" when risk-reward conditions are met.
Please note that this system is not designed to encourage specific investment decisions. It is primarily intended to provide an objective visual aid for confirming structural changes on the chart.
:
The greatest feature of Big Wave Stock Signal Revised is its design, which combines three features that are difficult to replicate in a combination of common technical indicators: multi-timeframe, automatic recognition of chart structure, and virtual position progression.
The automatic detection of ascending triangles in the chart structure, in particular, is a unique implementation of this system that should be evaluated.
Essentially, the judgment of such patterns is often based on subjective and discretionary analysis.
The recognition of "where is considered horizontal" and "whether the low is rounding up" differs from user to user.
However, in this system, pivot highs and lows are extracted by an algorithm, and the difference between them is judged mechanically and objectively based on whether they fall within a preset error rate.
This enables the detection of structures that maintain reproducibility without interrupting discretion in pattern recognition.
Furthermore, Triangle Detection is not used in isolation. Rather, it is based on the condition that the trend structure (perfect order) is established. This includes the intention to reduce uncertainty in the pattern.
Thus, this tool is a systematic, structured chart analysis aid that evaluates trend and pattern consistency and visually extracts only situations of structural significance.
:
This system was developed as part of a fee-based investment learning program offered by Life Publications, Inc., and it should be understood and used in the context of the accompanying material.
As such, access to the code is limited and private, with the goal of preventing misuse and unrestricted dissemination.
This justifies its inclusion as "part of the educational design" linked to the learning content rather than as a mere indicator.
:
The Big Wave Stock Signal Revised's signal logic consists of the following five steps.
A Buy Signal (Signal of Big Wave Detection) and a Close Signal (Signal of Big Wave Termination) are designed to appear on the chart only when each of the conditions is met step by step.
:
The tool simultaneously performs calculations for three time charts and three exponential moving averages (EMAs): Short-term (20 EMA), Medium-term (80 EMA), Long-term (200 EMA).
The Time charts are:
1-hour charts
4-hour charts
Daily charts
This enables a broader structural evaluation, independent of a single time frame.
:
If the order relationship of "short-term > medium-term > long-term" is established for each time frame, then that time frame is considered to have a "perfect upward order."
Furthermore, if this structure is confirmed for the 1H, 4H, and daily charts simultaneously, the chart is considered to have "strong upward consistency," and we will proceed to the next judgment step.
:
Next, the system automatically evaluates the appearance of an ascending triangle pattern on the chart.
This is detected by extracting pivot highs and lows based on the following condition:
1) The two most recent pivot highs are at approximately the same level (i.e., the upper side is horizontal).
2) The two most recent pivot lows are rounding up.
When these conditions are met simultaneously, an ascending triangle is determined to exist on the chart.
:
A "buy signal", Signal of Big Wave Detection, will appear on the chart as a blue up arrow only when the following two conditions are met simultaneously;
1) A perfect upward order must be in place on all time charts.
2) The price has broken above the upper line of the ascending triangle.
This timing corresponds to the initial phase, when an upward structure is in place and the price has broken out of a holding pattern.
Additionally, the duplicate avoidance logic works internally to prevent duplicate signals when a similar signal appears on the previous bar.
:
After a buy signal occurs, the internal logic that manages the position virtually is activated.
The exit condition can be one of the following:
1) When the price falls to the mid-term EMA (80 EMA on 1H charts), which is assumed to be the stop.
2) When the price reaches the profit line, which is based on the risk-reward ratio set at the closing price when the signal is activated.
When either condition is met, a "Close Signal (Signal of Big Wave Termination)" appears on the chart as a red down arrow.
This sequence of events allows users to visually follow the "structure, initial movement, progression, and close" storyline within a single system.
:
Rather than relying on a single technical indicator, this multi-layered system combines multiple perspectives of trend structure, chart patterns, and progression management.
The system highlights "structurally meaningful phases" on the chart that cannot be captured by a single viewpoint.
1) Trend consistency is extracted using the EMA triple structure (20/80/200) across multiple time charts. Only environments where the upward trend is consistent on all time charts are targeted and used to confirm and filter the trend direction.
2) The system automatically determines pressure structure by detecting ascending triangles.
It visually recognizes typical energy accumulation patterns based on the horizontality of the highs and the cutoff of the lows.
3) Virtual progression management (risk-reward ratio and mid-term EMA for exits). There is consistent visualization of the notional movement and structure of a signal from its onset to its close, all within the same system.
We intend to clarify "when, where, and why visual signals are displayed" and prevent excessive signals and ambiguous judgments by combining these three flows — trend recognition, pattern formation, and end of progression — into a single logic.
In particular, we have attempted to make the recognition of chart patterns more reproducible and objective by creating an algorithm for areas that have relied on discretion in the past.
This integrated approach helps users grasp the overall chart structure from multiple perspectives and focus their attention only on situations where specific conditions overlap.
It displays each EMA (20 EMA, 80 EMA, and 200 EMA) on one-hour charts.
The upper line of the ascending triangle is displayed.
The risk-reward ratio is adjustable (1:1, etc.).
Signals are highlighted by a large triangle icon on the chart.
Fast EMA Length: The duration of the short-term EMA (e.g., 20).
Mid EMA Length: The length of the medium-term EMA (e.g., 80).
Slow EMA Length: The length of the long-term EMA (e.g., 200).
Number of Pivots Left/Right: The number of bars on the left and right side of the pivot decision.
Error Rate of Horizontal Line: The tolerance for the upper side to be considered horizontal (e.g., 0.005 = ±0.5%).
Risk Reward Ratio: Ratio: Ratio of gain/loss.
4H Timeframe: The time charts of the upper chart (1) (default: 4-hour).
Daily Timeframe: The time charts of the upper chart (2) (default: daily).
:
This system is intended for informational and educational purposes only. It is not designed to make recommendations or provide advice regarding trading decisions on financial instruments.
Actual trading decisions should be made at your own risk.
There is no guarantee of future price movements or profits.

JOYZONE.v5Introducing the "JOYZONE v5" Tool for TradingView
Tailored for those navigating the financial markets, the JOYZONE v5 tool offers an advanced method of tracking potential market shifts and breakout scenarios. Designed using Pine Script v6, it relies on key price markers—specifically pivot points—to map zones where price may change direction. These insights cater to both momentum-based and reversal-oriented trading approaches, simplifying complex price behavior into actionable signals.
---
What it does ?
At its core, this tool automatically highlights notable ZONE highs and lows of its 5 times higher timeframes. If you run it on 15 min timeframe and it shows a Bullish signal, it means a Bullish Demand Zone is being created at 75 mins timeframe. Rather than flooding charts with noise, this tool employs a confirmation check over a short window to verify the zone’s legitimacy.
Once a zone is recognized, the indicator draws a horizontal boundary at that price level, remaining visible until market conditions evolve. Each level is tagged with a small label—either positive or negative depending on the direction—allowing users to quickly spot areas where the market sentiment has potentially shifted. Color schemes and label dimensions can be adjusted to fit different visual preferences.
---
Highlights at a Glance
- Streamlined Setup: Key configurations offering a plug-and-play experience while still leaving room for customization in appearance.
- Clutter-Free Interface: With a signal cap set to 100 by default, older lines and labels are automatically phased out—especially helpful when analyzing broader timeframes.
---
How It Interprets Market Moves
The tool continuously watches for levels formed during rising and falling zone-sequences. When the market decisively breaches one of these defined zones backed by a close beyond the boundary—it identifies this as a Confirmation of ZONE. For instance, if prices climb above a key high that had earlier defined resistance during a downtrend, and the move is confirmed, a new upward phase is signaled. The tool then draws a green line and places a "ZONE" label to reflect this change in sentiment.
---
Practical Applications
- For Swing Traders: Ideal for pinpointing entries around fresh trend formations, with well-marked price references for stop-loss and target planning.
- For Intraday Participants: Instant alerts help capture short-lived reversals that can occur throughout the trading day.
- For Long-Term Traders: Monitoring higher timeframes with this indicator helps in recognizing macro trend shifts that could shape portfolio-level decisions.
---
Adaptability & Considerations
Users can personalize the indicator’s visual presentation by toggling level visibility and adjusting label formats. While its logic is universal, the performance may vary slightly depending on the instrument (e.g., equities, currencies, crypto).
Point of Caution: in sideways markets where direction is unclear, the tool may not perform optimally due to its reliance on confirmation. To improve accuracy, consider pairing it with other indicators like volume or moving averages. Also, since the period setting is fixed, back-testing on different assets and timeframes is encouraged.
---
*Final Thoughts
The JOYZONE v5 tool provides a sleek, intuitive method for recognizing market momentum shifts and trend reversals. Its clean visuals, thoughtful alert system, and reduced need for user input make it accessible and powerful. Whether you're just starting out or refining an established trading method, this indicator can serve as a reliable companion for chart analysis.
> Disclaimer: This tool is intended solely for educational use and should not be seen as a guaranteed trading solution. Please use alongside your broader trading framework and consult with advisors if you need.

Breaker Blocks with Signals [Lux + Charles + Gemini AI 2.5]Breaker Blocks with Signals
Overview
This indicator identifies potential Breaker Blocks based on market structure shifts and provides clear visual signals for potential trade entries upon the retest of these blocks. It aims to capture high-probability setups where price breaks a key level and then returns to test it as new support (bullish) or resistance (bearish).
Core Concept: What is a Breaker Block?
A Breaker Block is a price action pattern that occurs after a market structure shift:
Bearish Breaker (-): Forms when a significant low (support) is broken decisively. When price retraces back up to the price range of the candle(s) that led to the break, this area often acts as new resistance.
Bullish Breaker (+): Forms when a significant high (resistance) is broken decisively. When price retraces back down to the price range of the candle(s) that led to the break, this area often acts as new support.
This indicator automates the detection of these zones.
How It Works & Features
Market Structure Shift Detection: The indicator analyzes swing highs and lows (based on the configured 'Length') to identify breaks in market structure.
Breaker Block Plotting:
Upon a market structure shift, the relevant candle(s) forming the potential Breaker Block are identified.
A box is drawn representing the Breaker Block zone (High to Low of the identified candle(s)). By default, this box has a black, highly opaque background.|
A small text label ("(+) Breaker Block" or "(-) Breaker Block") with a configurable color (bright green/red by default) is plotted next to the block.
Initial Break Marker:
A small label ("+ Breaker (Long)" or "- Breaker (Short)") is plotted at the candle where the market structure break occurs. This uses a Supertrend-style label (tiny size, colored background, white text) with configurable colors.
A prominent, thick vertical line (configurable color, purple by default) is also drawn on the break candle for high visibility.
Note: This marks the break, not the entry signal.
Retest Signal (Primary Entry Signal):
The indicator waits for the price to move away from the newly formed Breaker Block and then return to test it.
The primary trade signal appears when price dips into the block and interacts with its center line (midpoint), closing favorably (above center for longs, below for shorts).
This signal is marked by:
Double arrows (▲▲ / ▼▼)
A "RETEST" text label.
The background color for these retest signals is configurable (dark green for bullish, dark red for bearish by default).
Take Profit Levels: Calculates and plots up to 3 Take Profit levels based on configurable Risk:Reward ratios relative to the size of the Breaker Block. Hits are marked with small dots.
Cancellation Signals: If price action invalidates a potential setup before a retest signal (e.g., price closes significantly inside the block against the intended direction), a configurable 'X' signal (orange/red by default) is plotted.
PD Array Integration (Optional): Can optionally filter signals based on whether the entry occurs within a relevant Premium/Discount zone derived from higher timeframe swings, potentially adding confluence. Related PD zones and swing breaks can be visualized if enabled.
Customization: Nearly all visual elements (block colors, signal colors, line colors, label sizes) and parameters (lookback length, R:R ratios, PD Array settings, candle body usage) are configurable in the indicator settings menu, allowing for extensive personalization.
How to Use
Identify Break: Look for the formation of a Breaker Block, marked by the box, the "(+)/(-) Breaker Block" text, the "+ Breaker (Long)" / "- Breaker (Short)" label, and the vertical line.
Wait for Retest: The key is patience. Do not necessarily enter on the initial break. Wait for the price to move away and then return towards the Breaker Block.
Look for Retest Signal: The primary entry trigger is the "RETEST" signal (double arrows + text). This confirms price has interacted with the Breaker Block's center line and potentially found support/resistance there.
Entry & Risk Management:
Consider entering a trade upon the appearance of the "RETEST" signal.
The Breaker Block zone itself can serve as a logical area for stop-loss placement (e.g., below the low of a bullish block, above the high of a bearish block).
Use the plotted TP levels as potential profit targets or for partial profit-taking.
Context is Key: Always use this indicator in conjunction with other forms of analysis (trend analysis, higher timeframes, volume, other indicators) for confirmation. Breaker blocks tend to work best when aligned with the prevailing market trend.
Cancellation: If an 'X' signal appears before a retest entry, the setup is considered invalidated.
Disclaimer
This indicator is intended for educational and informational purposes only. Trading financial markets involves significant risk. Past performance is not indicative of future results. Always conduct your own thorough analysis and risk management before making any trading decisions. The creators are not responsible for any financial losses incurred using this tool.

7 Day ATR TableThis script uses the ATR Script and Creates a Table showing the 7 Day ATR, based on the daily timeframe. It also displays the current day High, the current day Low, the Range, and the percent ATR covered during the current session.
