Master TrendA unique trend indicator analyzes the market with high accuracy and determines the points for entering a position. The entry point is displayed with arrows and take profit as lines. The algorithm underlying it is protected by copyright.
Trendtrading

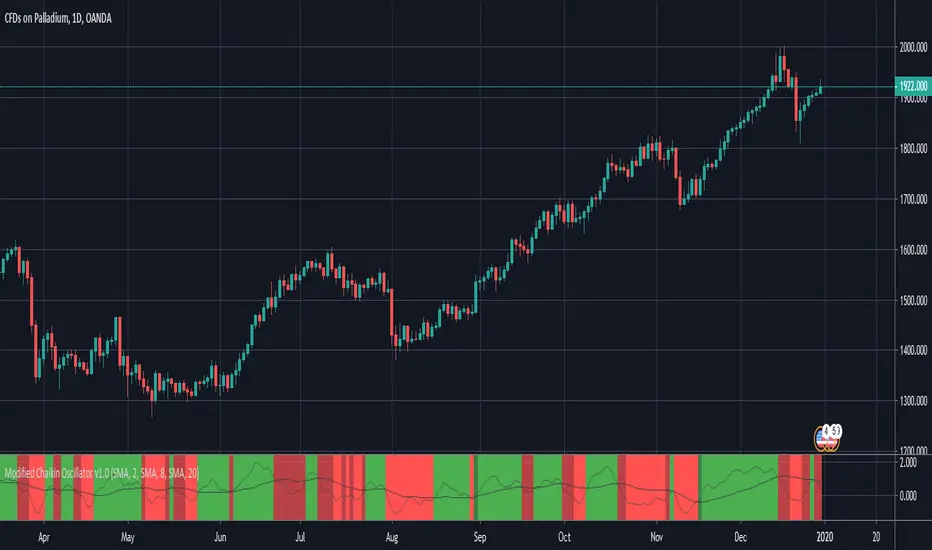
Modified Chaikin OscillatorThis is a modified version of the Chaikin Oscillator. The idea is to find accumulation and distribution phases in the market to identify when institutions are building their positions.
It uses acc/dist but as an oscillator, just like the Chaikin Oscillator, but not to find overbought or oversold areas, but to find trends. It functions like a MACD. It takes a fast moving average of the acc/dist and a slow moving average of the acc/dist, and plots the differense to create the oscillator, and uses a signal line to use for entries.
A strong signal is when the oscillator crosses the signal line while the signal line is on he right side of 0. So a crossover (long) when the signal line is below 0 woul be a weak signal, while a crossover (long) when the signal line is above 0 would be a strong signal.
By default, tick volume is discarded in the calculation, which makes this version behave a bit differently than the standard Chaikin Oscillator. This is because the indicator is mostly used to trade CFD's. If used to trade stocks for example, it is better to include the volume by unchecking that checkbox in the indicator settings.
BRIGHT GREEN = Strong signal LONG (signal line is above 0)
DARK GREEN = Weak signal LONG (signal line is below 0)
BRIGHT RED = Strong signal SHORT (signal line is below 0)
DARK RED = Weak signal SHORT (signal line is above 0)
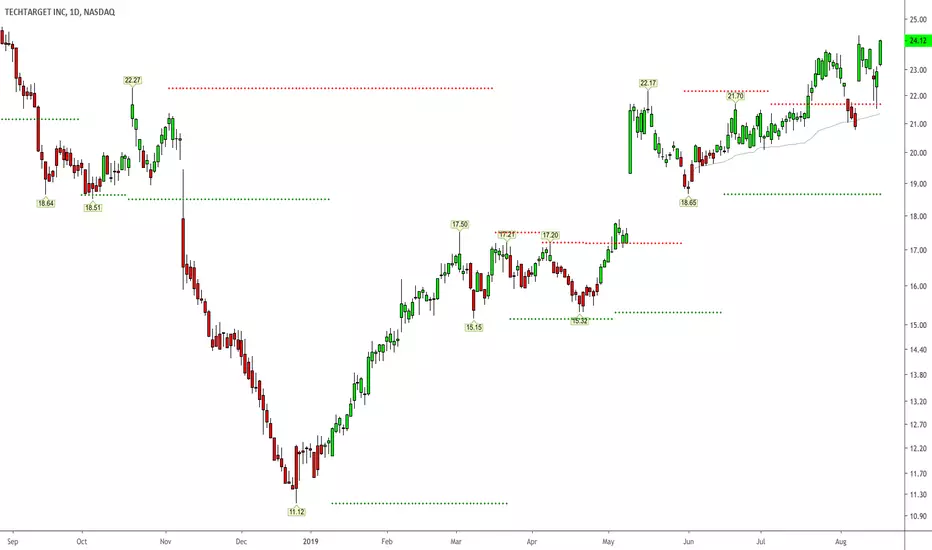
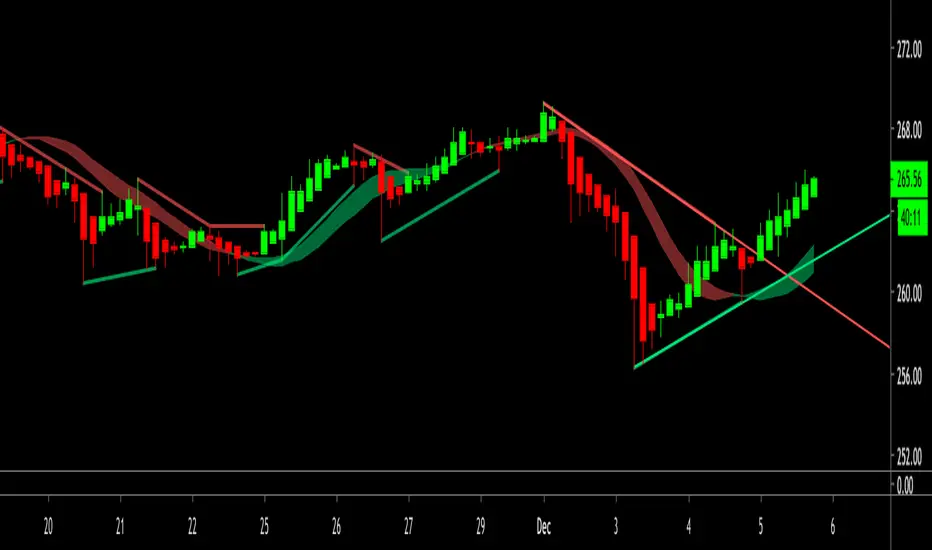
High – Low Trend Indicator Signal (Expo)High - Low Trend Indicator Signal - (Expo)
DESCRIPTION
This indicator is derived from my previous one called High – Low Trend Indicator (Expo) , but the difference is that this one generates Long signals and detects market changes. These two indicators are intended to be used in the same chart for better accuracy and validation of signals. The indicator is perfectly used to identify pullbacks in positive trends!
HOW TO USE
When a signal appears, consider enter long, or look for confirmation patterns. Such confirmation could be seen in the High – Low Trend Indicator (Expo) when the red cloud disappears or when the black price line crosses out from the red cloud, or when the black price line crosses up over the blue midline.
So,
1. Use the indicator to identify Long signals.
2. Use the indicator to find Entry points in positive trends.
3. Use the indicator to detect market changes.
4. Combine it with High – Low Trend Indicator (Expo).
INDICATOR IN ACTION
The indicator is best presented live, the graphs below are a good guide.
EURUSD
DAX
WALL STREET
GOLD
I hope you find this indicator useful , and please comment or contact me if you like the script or have any questions/suggestions for future improvements. Thanks!
I will continue to work on this indicator, so please share your experience and feedback with me so that I can continuously improve it. Thanks to everyone that have contacted me regarding my scripts. Your feedback is valuable for future developments!
ACCESS THE INDICATOR
• Contact me on TradingView or use the links below
-----------------
Disclaimer
Copyright by Zeiierman.
The information contained in my scripts/indicators/ideas does not constitute financial advice or a solicitation to buy or sell any securities of any type. I will not accept liability for any loss or damage, including without limitation any loss of profit, which may arise directly or indirectly from use of or reliance on such information.
All investments involve risk, and the past performance of a security, industry, sector, market, financial product, trading strategy, or individual’s trading does not guarantee future results or returns. Investors are fully responsible for any investment decisions they make. Such decisions should be based solely on an evaluation of their financial circumstances, investment objectives, risk tolerance, and liquidity needs.
My scripts/indicators/ideas are only for educational purposes!

LTIThis is a customised indicator which assists us to easily identify strong linear bullish or bearish trends. It gives us the opportunity to enter only the strongest looking trends which results in potentially faster profits.

Ehlers Fractal Adaptive Moving Average with Bands [Bitcoinduke]FRAMA – What is it?
Fractal Adaptive Moving Average Technical Indicator ( FRAMA ) was developed by John Ehlers, code was implemented by TradingView user Shizaru. I've updated it to Pine Script 4 and added Bands Extension.
This indicator is constructed based on the algorithm of the Exponential Moving Average , in which the smoothing factor is calculated based on the current fractal dimension of the price series.
Advantages:
possibility to follow strong trend movements
determine moments of price consolidation ( FRAMA sufficiently slow down at these moments)
FRAMA + Bands
The FRAMA serves as a base for the Upper and Lower Bands which are used as a way to measure volatility by observing the relationship between the Bands and price. Typically the Upper and Lower Bands are set to two standard deviations away from the FRAMA ; however it should be adjusted depending on the task.

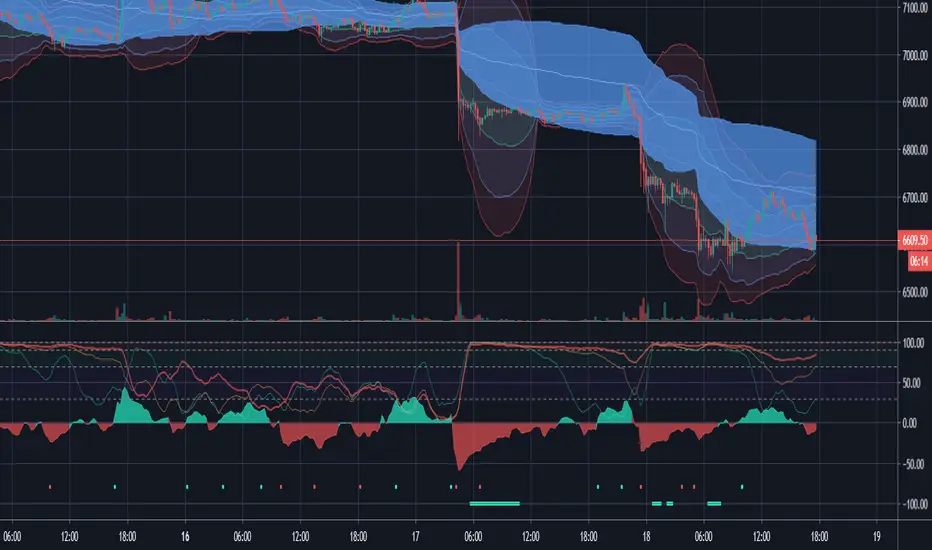
Rúnar V2 - Trend Strength, Confirmation and ExhaustionHi guys,
So after a lot of feedback on the initial Runar script, I have finally completed V2 as per your feedback. The original script had some issues with repainting as this is a multi-time frame script and the periods we included on the original were far too large. This actually addresses the other issue of the script originally being quite slow or very specific around which dots/signals it would print. The new script is therefor a lot more reactive and responsive to market behavior especially crypto.
I have re-introduced the Certainty score as a result for you to modify and play with. Right now its set to its highest variable, but you can choose lower. I recommend no lower than 2 as dots prints will become meaningless to me but may be helpful to others.
How to use the indicator:
Something I get asked a lot, so lets break it down in full. The indicator comes with two primary areas and two secondary. The first two primary is the actual waves we see in the center oscillating around 0. These waves measure market direction and strength and will print a dot (its secondary) to signify a larger move. This makes some qualities of Runar predictive, but remember sudden moves will not be picked up on higher time frames.
The color of the wave will signify the color of the dot. We will not currently get a green dot printing during a red wave. This is intentional to avoid flip flopping too much during market movement and allows us to confidently follow trend instead.
The second part of the indicator consists of the top 3 lines osculating between 0 and 100. This part of the indicator measures the markets expansion and volatility allowing us to spot early exhaustion during trend. The indicator consists of three lines and when all 3 read over 95 we can begin looking for a bottom or reversal. Its secondary area are the solid lines (green/red) at the bottom of the indicator to make spotting these potential areas easier and to keep an eye on the market/orderbook/other indicators to spot the exhaustion.
A green line will print during downtrends and a red line during up trends as this is intended to align with the traditional buy/sell colours.
Finally the indicator comes with alerts for dot prints or a line print so you are free to set these up however you wish. My recommended time frames are 15m/1/2/4H with scalpers welcome to go as low as the 1min.
Auto Trend Channel by Atilla YurtsevenHi traders,
I have coded this "Auto Trend Channel" script to help myself to draw a perfect trend. I usually use "Open / Close" as source. Play around with the "Lookback" period to find the best fit. Hope you enjoy it.
Note: This indicator repaints as highs and lows changed.
Remember to follow me and drop some comments below.
Disclaimer: This is not financial advice
Trade safe,
Atilla Yurtseven
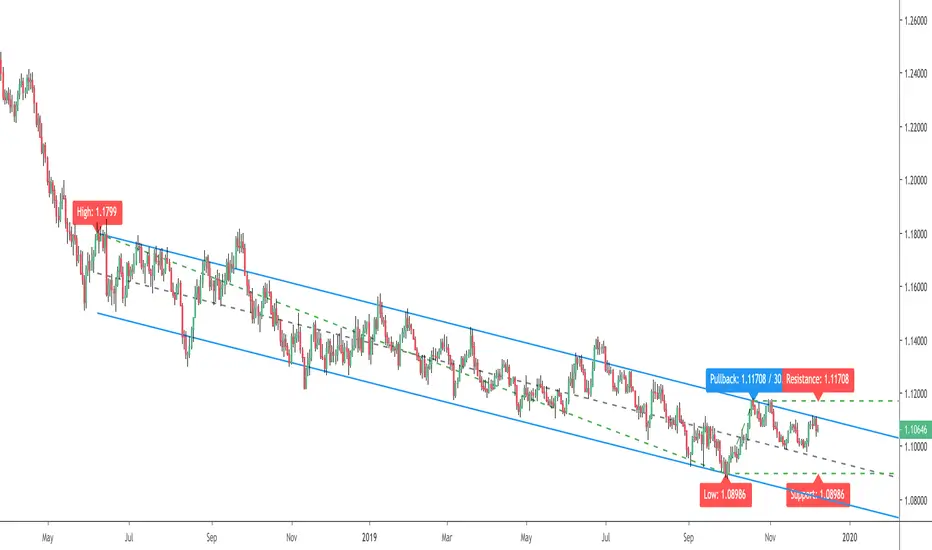
Swing Trade Pros - Auto Trend LinesThe STP Auto Trend Lines accurately identify the real-time trend lines automatically helping you find breakouts before they happen. The indicator uses weighted moving averages to show the overall direction of the underlining asset. The higher time frames will always produce the most reliable trend lines. Once the second swing high or low has been identified the indicator automatically draws the trend lines. The Trend Lines form key market structures and once the pattern is broken a big move usually follows. If the trend is rising it indicates it may be better to enter long positions. If the trend is falling it indicates it may be better to enter short positions.
Trend GridTrend Grid is a responsive method to identify price movement and momentum. Mainly used to follow the trends.
This is for Level 3 members only.

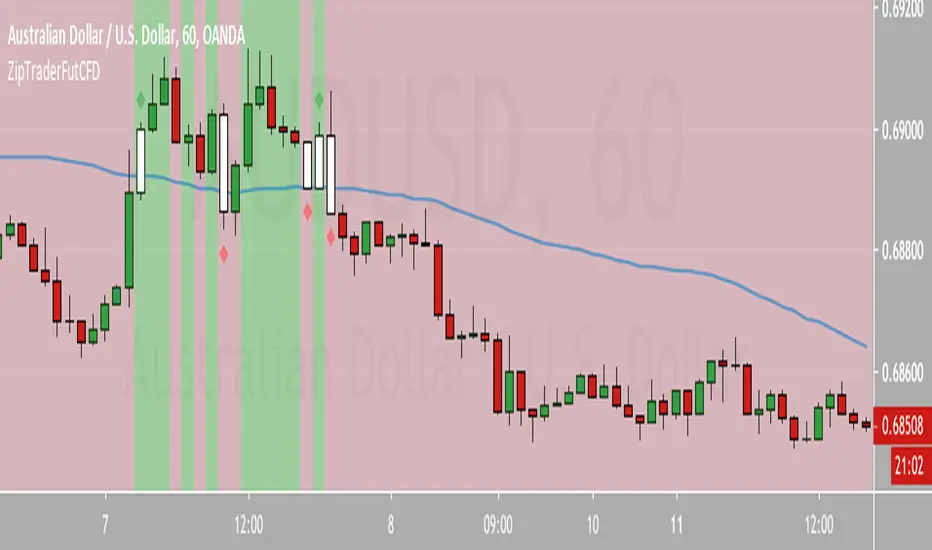
ZipTraderFuturesCFDThis is a script to be used for swing trading futures and CFD indices using the 1 Hour time frame. The script trades momentum with Trends and is a continuity strategy designed to capture intermediate moves out of indices and commodities
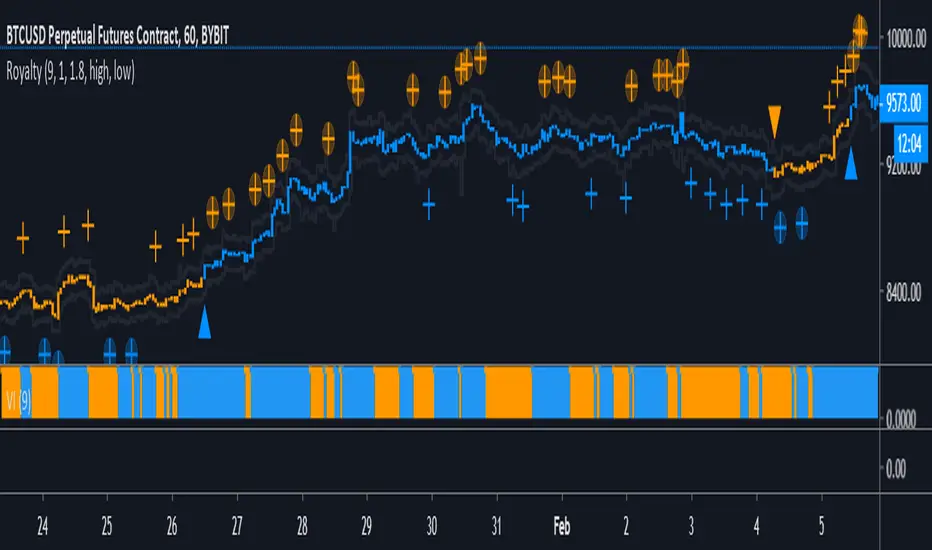
Project Royalty BETAThis indicator is designed to be used in confluence with the PROJECT WINDFALL BETA.
Trend analysis combined with top and bottom signals. This indicator is aimed at minimizing risk by trading with the trend.
Color Definitions:
Blue candle coloring shows a bullish trend
Orange candle coloring shows a bearish trend
Signals:
Blue Triangle - Trend reversal (bearish to bullish)
Blue Cross - Local bottom while in a bullish trend
Blue Cross w/ Circle - Local bottom while in a bearish trend
Orange Triangle - Trend reversal (bullish to bearish)
Orange Cross - Local top while in a bearish trend
Orange Cross w/ Circle - Local bottom while in a bullish trend
Trading Strategy:
TRADE WITH THE TREND
While the trend is bullish (blue) ONLY LONG.
Long trend reversal signals (blue triangle).
Long bottom signals (blue cross) and then take profits on top signals (orange cross w/ circle). DO NOT short top signals while in a bullish trend.
While the trend is bearish (orange) ONLY SHORT.
Short trend reversal signals (orange triangle).
Short top signals (orange cross) and then take profits on bottom signals (blue cross w/ circle). DO NOT long top signals while in a bearish trend.
Stop Loss/Take Profit Bands:
Stop Loss and Take Profit Bands are provided to encourage the setting of both a SL and a TP (methods to minimize risk). When entering a long, set a SL at the SL band value of the signal candle (defaulted to 1%). Set a TP at the TP band value of the signal candle (defaulted to 1.8%). Default percentages are under the assumption of 10x trading leverage.
Ideal Settings:
It's advised to turn off candle borders and to change candle colors to match the colors used in the indicator (default blue and orange).
IMPORTANT:
This indicator is specifically tuned for BTCUSD and is most effective on the 1 HOUR time frame. Be warned when trading any other instrument with this oscillator.
Filthy REPAINTING of McNasty Profits*** THIS SCRIPT REPAINTS ***
Looking at the history will go you NO IDEA as to actual performance, or alerts that triggered within each bar. I made all of the alerts repaint in order to allow an alert each minute a condition is met, and never again after.
For instance; receive an alert each time the price is within a particular plotted area on the chart (as defined by settings). This could not be accomplished without repainting.
In order to receive a notification of the price crossing a particular line, YOU NEED TO SET ALERTS TO "ONCE PER MINUTE."
This way, if you use an alert to enter a position and then get stopped out, you can re-enter on the next alert if the price moves in the original direction again within the same bar.
Also, I made this script so that each entry has an available Stop Loss alert that will get you out of a position going in the wrong direction (and option to enter in opposite direction). You set the parameters within the settings.
Although each position has a tight Stop Loss available via Alert, I also recommend using a similar tight Stop Loss directly on your exchange in case an error occurs anywhere within the chain.
This script HAS A LOT OF OPTIONS for how you can use it, from very conservative to extremely aggressive. There are NINE customizable alerts for the user to decide how/when to use, or ignore entirely.
When the Alerts are set to "ONCE PER MINUTE" you will get an alert each time the price crosses the corresponding area on the chart, but the characters only remain on the charts history if the alert was still firing (Once Per Minute) when the bar closed. This is why the Alerts on the chart's history are completely irrelevant.
As you can imagine, this is a LOT OF ALERTS. Consequently, this is meant for use with "bot trading" using the Alerts to automatically Open and Close positions.
I am using it with 3Commas to make trades on Bybit.
At the time of publishing, this is "Invite Only." I need to test it out over a range of time, conditions, chart time frames, pairs, etc... before opening it to the public.

10X Trading System10X Trading System (Non Repaint)
TradingView Account Needed: Free
Not satisfied with your trading results so far? This may help:
The 10X Trading System helps you identify tops, bottoms and market direction — quickly and accurately.
The strategy behind its accuracy is the fact that it combines price action and multiple market timing algorithms to determine these significant turning points in the markets.
That way, you can be sure you have the best chance to get the best entry and exit points with perfect timing, and hopefully extract more profits from the markets than anybody else.
Once the 10X Trading system has spotted a possible top or bottom, it clearly displays these Buy or Sell alerts on your charts… showing you exactly where this may occur.
You can activate alerts to never miss a signal.
How to use the signals and alerts:
10X Trading System automatically analyze price action and multiple market timing algorithms to give you a signal when there's a good trade.
Works on all markets on all time frames so it's suitable for binary, scalping, day and swing trading.
10X Trading System allow you to get the best entry and exit points with perfect timing.
If you want more details, the link is in the signature.
Disclaimer:
Past performance is not indicative of future performance. No representation is being made that any results discussed within the service and its related media content will be achieved. All opinions, news, research, analyses, prices or other information is provided as general market commentary and not as investment advice. TradingWalk, their members, shareholders, employees, agents, representatives and resellers do not warrant the completeness, accuracy or timeliness of the information supplied, and they shall not be liable for any loss or damages, consequential or otherwise, which may arise from the use or reliance of the TradingWalk service and its content. © 2019 TradingWalk.
TradingWalk indicators are built for TradingView. TradingWalk is on no way a part of TradingView.

Pivot Reversal Strategy - FIGS & DATES 2.0Simple Pivot Reversal Strategy with some adding settings.
Date Range: To test over specific market conditions.
Initial Capitol: $10K - This is a more realistic representation of funds used this strategy (for me anyway). The default of $100K can give different results (usually better) than when using a smaller balance.
Order Size: 100% Equity - These trend following strategies typically used this way, going all in each direction.
Commission: .075% - It's always disheartening to think you've found a ridiculously good setting, and then realize you forgot to add the commission.
All of these settings can be changed, but it's easier for me (and more fool proof) to have them set as default.

Signal To Noise Ratio IndicatorThis is a trend indicator at its core so combine with rsi or a moving average of your choice to see which direction the stock is trending in.
Only enter a position (long or short) when signal to noise ratio is above the signal line
This is one of my first indicators posted on here so be sure to leave me feedback

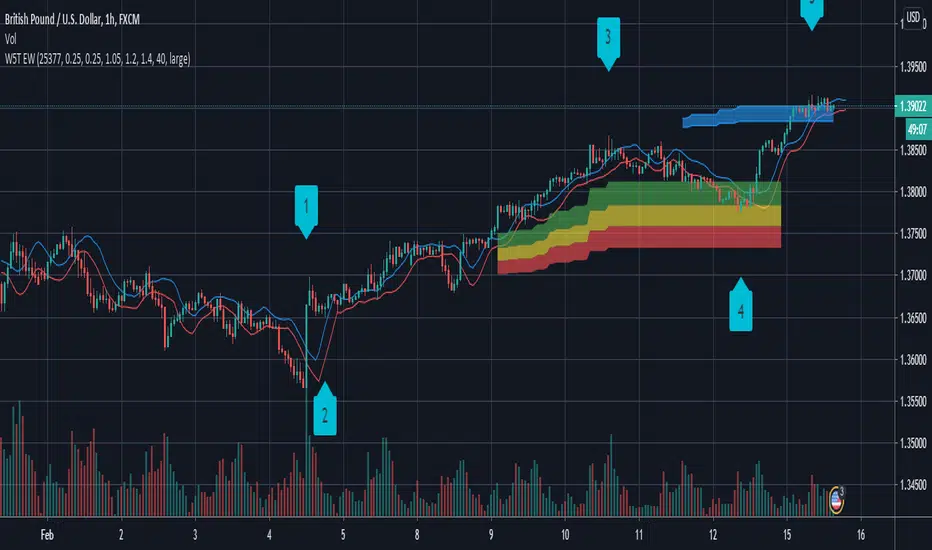
W5T Elliott Wave Indicator SuiteThe Elliott Wave Indicator Suite brings order and reason to the world of Swing Trading, Intraday Trading and Day Trading. It greatly illuminates the path through the forest of chaotic markets versus getting lost among all the trees. Perfect for Stocks, Forex, Futures, Commodities, Indexes and even Crypto Currency markets. Watch the Video Tour and find out More >>>HERE<<<
Includes:
Elliott Wave Indicator
High Probability Pull Back Zones
Elliott Wave isolation
Automated Target Zones
False Breakout Stochastic
Automated Elliott Wave Count
Special 5/35 Pull Back Oscillator
6/4 MA High & Low for Trade Entry & Management
Training Bootcamp
Free Monthly Live Support Webinars
Auto Trend Lines [Anan]Hello Friends..
This is Auto Trend Lines, A script that draws trendlines from the pivot points in the price chart,,
So helpful and smart !
Play with the options to adjust the precision.
This is my simple edition from " Trendlines - JD "

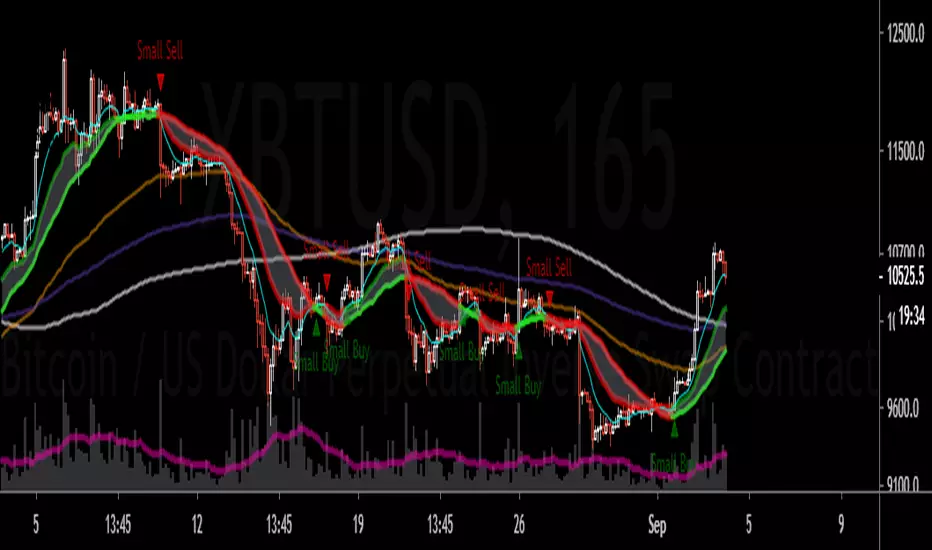
EMA/SMA CloudSmall entry is given when the cyan line crosses the Faster moving ema while the validation happens when the color of the bands flip to green and red
Multiple time frames are best for this and I find the 165 , 330 , 600 work very well in confluence with one another - Higher time frames I would stress to stay looking at for this strategy I can not stress that enough - Please do your own research and let me know if there's anything I could do to perfect it !
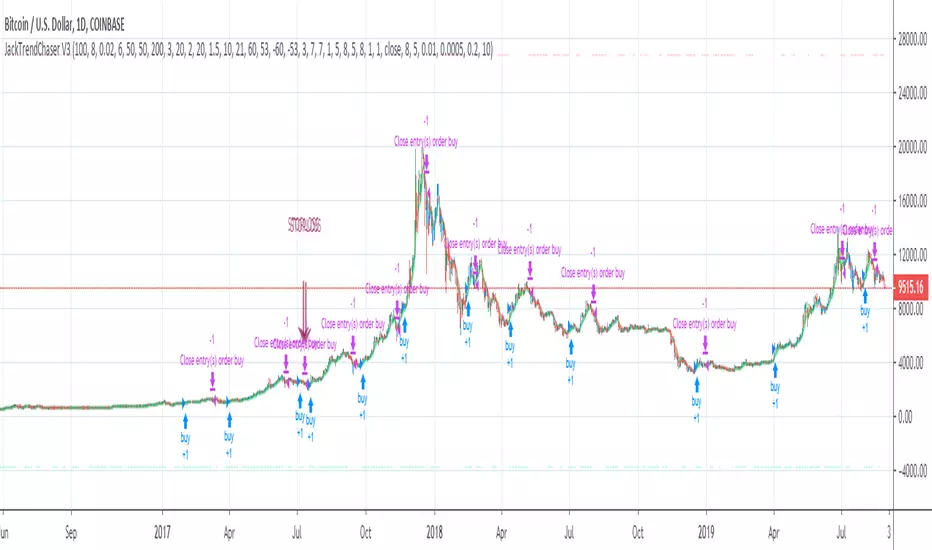
JackTrendChaser V4This is like V3 but with minor improvements - and this script is only protected which means that you are free to try it out!
I would love to know your thoughts on this so please try it out and get back to me :)
Link to V3:
BOSS EMA Trend Meter PRO With Alerts BOSS PRO TRADING SYSTEM INDICATORS
Bullish Uptrend
To determine bullish uptrend there must beat least 2 green squares on all three trend meters. This is a great predictor that a uptrend is imminent. You can set alerts for top two meters being green as well as all 3 meters being green
Bearish Downtrend
To determine bearish downtrend there must beat least 2 red squares on all three trend meters. This is a great predictor that a downtrend is imminent. You can set alerts for top two meters being red as well as all 3 meters being red.
Purchase Here: bosscripts.com

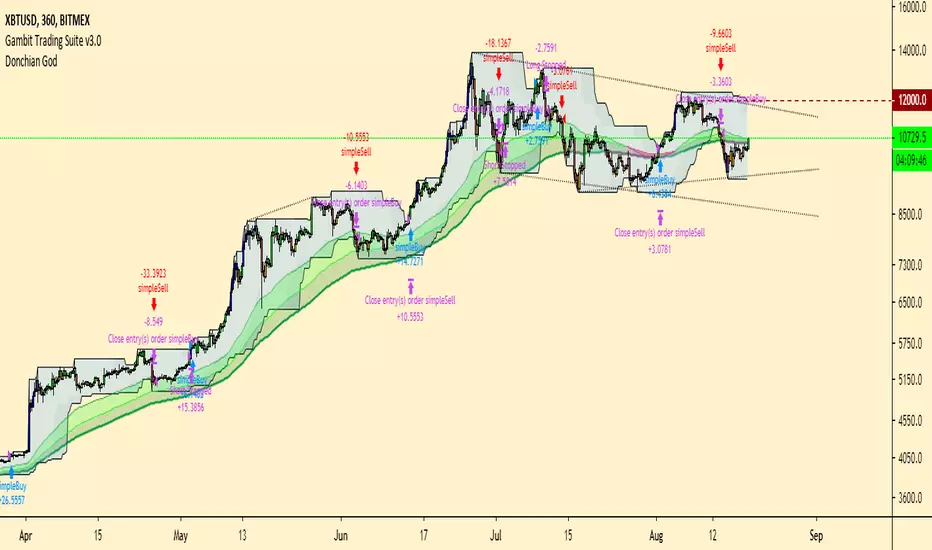
Donchian GodMy take on the turtle method. Included is the ultimate trend trader toolkit. Built in system that takes trades when price breaks either donchian channel and keeps that trade until price breaks the opposite channel. As well as many other tools!
AVWAPVWAP is based on volume and price and represents the average a security has traded at.
The script in for Dynamic Trader L3 members only.