Daily Standard Deviation (fadi)The Daily Standard Deviation indicator uses standard deviation to map out daily price movements. Standard deviation measures how much prices stray from their average—small values mean steady trends, large ones mean wild swings. Drawing from up to 20 years of data, it plots key levels using customizable Fibonacci lines tied to that standard deviation, giving traders a snapshot of typical price behavior.
These levels align with a bell curve: about 68% of price moves stay within 1 standard deviation, 95% within roughly 2, and 99.7% within roughly 3. When prices break past the 1 StDev line, they’re outliers—only 32% of moves go that far. Prices often snap back to these lines or the average, though the reversal might not happen the same day.
How Traders Use It
If prices surge past the 1 StDev line, traders might wait for momentum to fade, then trade the pullback to that line or the average, setting a target and stop.
If prices dip below, they might buy, anticipating a bounce—sometimes a day or two later. It’s a tool to spot overstretched prices likely to revert and/or measure the odds of continuation.
Settings
Open Hour: Sets the trading day’s start (default: 18:00 EST).
Show Levels for the Last X Days: Displays levels for the specified number of days.
Based on X Period: Number of days to calculate standard deviation (e.g., 20 years ≈ 5,040 days). Larger periods smooth out daily level changes.
Mirror Levels on the Other Side: Plots symmetric positive and negative levels around the average.
Fibonacci Levels Settings: Defines which levels and line styles to show. With mirroring, negative values aren’t needed.
Overrides: Lets advanced users input custom standard deviations for specific tickers (e.g., NQ1! at 0.01296).
Volatility

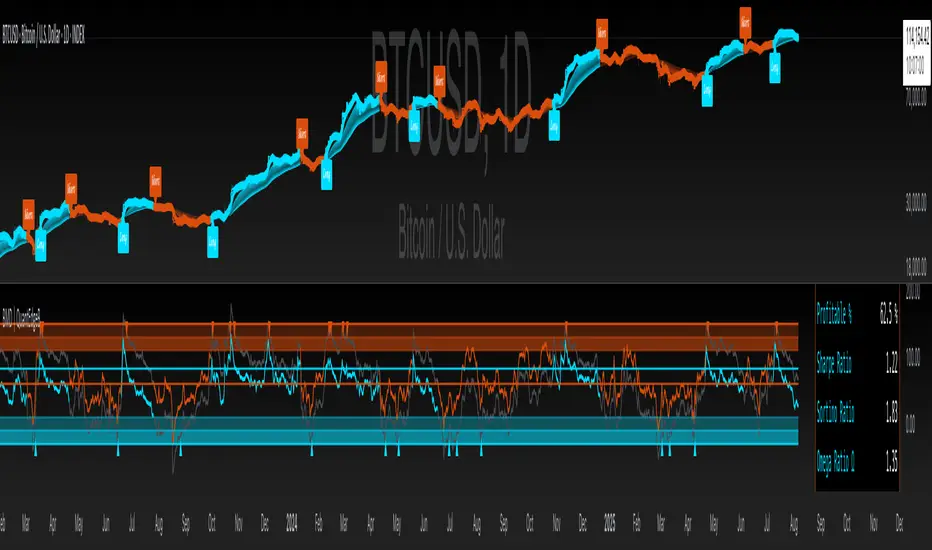
Bollinger Momentum Deviation | QuantEdgeBIntroducing Bollinger Momentum Deviation (BMD) by QuantEdgeB
🛠️ Overview
Bollinger Momentum Deviation (BMD) is a trend-following momentum indicator designed to identify strong price movements while also detecting overbought and oversold conditions in ranging markets.
By normalizing a simple moving average (SMA) with standard deviation, BMD captures momentum shifts, helping traders make data-driven entries and exits. In trending conditions, it acts as a momentum confirmation tool, while in ranging markets, it highlights mean-reversion opportunities for profit-taking or re-accumulation.
BMD combines the best of both worlds—a robust trend-following framework with an integrated volatility-based overbought/oversold detection system.
____
✨ Key Features
🔹 Momentum & Trend-Following Core
Built upon a normalized SMA with standard deviation filtering, BMD efficiently tracks price movements while reducing lag.
🔹 Overbought/Oversold Market Detection
By dynamically adjusting its thresholds based on standard deviation, it identifies high-probability reversion zones in sideways markets.
🔹 Adaptive Normalization Mechanism
Ensures consistent signal reliability across different assets and timeframes by standardizing momentum fluctuations.
🔹 Customizable Visual & Signal Settings
Includes multiple color modes, extra plots, and trend labels, making it easy to align with different trading styles.
____
📊 How It Works
1️⃣ Normalized Momentum Calculation
BMD computes a normalized momentum score using a simple moving average (SMA) combined with a standard deviation (SD) filter to create dynamic upper and lower bands. The final momentum score is derived by normalizing the price within this volatility-adjusted range. This normalization makes momentum readings comparable across different price levels and timeframes.
2️⃣ Standard Deviation Filtering
Unlike traditional approaches where standard deviation is derived from price as is the first SD, BMDs second SD is driven from the normalized momentum oscillator itself. This allows for a volatility-adjusted smoothing mechanism that adapts to momentum shifts rather than raw price fluctuations. This ensures that the trend signals remain dynamic and responsive, filtering out short-term noise while keeping the core momentum structure intact. By applying standard deviation directly to the oscillator, BMD achieves a self-regulating feedback loop, improving accuracy in both trending and range-bound conditions.
3️⃣ Signal Generation
✅ Long Signal → Upper BMD SD > Long Threshold (83)
❌ Short Signal → Lower BMD SD < Short Threshold (60)
📌 Additional Features:
- Overbought Zone → Values above 130 indicate price extension.
- Oversold Zone → Values below -10 suggest potential accumulation.
- Momentum Labels → Optional "Long" and "Short" markers for clear trade identification.
____
👥 Who Should Use It?
✅ Trend Traders & Momentum Followers → Use BMD as a confirmation tool for strong directional trends.
✅ Range & Mean Reversion Traders → Identify reversal opportunities at extreme BMD levels.
✅ Swing & Position Traders → Utilize normalized momentum shifts for data-driven entries & exits.
✅ Systematic & Quant Traders → Implement BMD within algorithmic frameworks for adaptive market detection.
____
⚙️ Customization & Default Settings
🔧 Key Custom Inputs:
- Base Length (Default: 40) → Defines the SMA calculation period.
- Standard Deviation Length (Default: 50) → Controls the volatility filter strength.
- SD Multiplier (Default: 0-7) → Adjusts the sensitivity of the momentum filter.
- Long Threshold (Default: 83) → Above this level, momentum is bullish.
- Short Threshold (Default: 60) → Below this level, momentum weakens.
- Visual Customizations → Multiple color themes, extra plots, and trend labels available.
🚀 By default, BMD is optimized for trend-following and momentum filtering while remaining adaptable to various trading strategies.
____
📌 How to Use Bollinger Momentum Deviation (BMD) in Trading
1️⃣ Trend-Following Strategy (Momentum Confirmation)
✔ Enter long positions when BMD crosses above the long threshold (83), confirming upward momentum.
✔ Enter short positions when BMD crosses below the short threshold (60), confirming downward momentum.
✔ Stay in trades as long as BMD remains in trend direction, filtering out noise.
2️⃣ Mean Reversion Strategy (Overbought/Oversold Conditions)
✔ Take profits or hedge when BMD crosses above 130 (overbought).
✔ Re-accumulate positions when BMD drops below -10 (oversold).
📌 Why?
- In trending markets, follow BMD’s momentum confirmation.
- In ranging markets, use BMD’s normalized bands to buy at deep discounts and sell into strength.
_____
📌 Conclusion
Bollinger Momentum Deviation (BMD) is a versatile momentum indicator that combines trend-following mechanics with volatility-adjusted mean reversion zones. By normalizing SMA-based momentum shifts, BMD ensures robust signal reliability across different assets and timeframes.
🔹 Key Takeaways:
1️⃣ Momentum Confirmation & Trend Detection – Captures directional strength with dynamic filtering.
2️⃣ Overbought/Oversold Conditions – Identifies reversal opportunities in sideways markets.
3️⃣ Adaptive & Customizable – Works across different timeframes and trading styles.
🔹 Disclaimer: Past performance is not indicative of future results. No trading strategy can guarantee success in financial markets.
🔹 Strategic Advice: Always backtest, optimize, and align parameters with your trading objectives and risk tolerance before live trading.
Pure CocaPure Coca - Trend & Mean Reversion Indicator
Overview
The Pure Coca indicator is a trend and mean reversion analysis tool designed for identifying dynamic shifts in market behavior. By leveraging Z-score calculations, this indicator captures both trend-following and mean-reverting periods, making it useful for a wide range of trading strategies.
What It Does
📉 Detects Overbought & Oversold Conditions using a Z-score framework.
🎯 Identifies Trend vs. Mean Reversion Phases by analyzing the deviation of price from its historical average.
📊 Customizable Moving Averages (EMA, SMA, VWMA, etc.) for smoothing Z-score calculations.
🔄 Adaptable to Any Timeframe – Default settings are optimized for 2D charts but can be adjusted to suit different market conditions.
How It Works
Computes a Z-score of price movements, normalized over a lookback period.
Plots upper and lower boundaries to visualize extreme price movements.
Dynamic Midlines adjust entry and exit conditions based on market shifts.
Background & Bar Coloring help traders quickly identify trading opportunities.
Key Features & Inputs
✔ Lookback Period: Adjustable period for calculating Z-score.
✔ Custom MA Smoothing: Choose from EMA, SMA, WMA, VWAP, and more.
✔ Z-Score Thresholds: Set upper and lower bounds to define overbought/oversold conditions.
✔ Trend vs. Mean Reversion Mode: Enables traders to spot momentum shifts in real-time.
✔ Bar Coloring & Background Highlights: Enhances visual clarity for decision-making.
How to Use It
Trend Trading: Enter when the Z-score crosses key levels (upper/lower boundary).
Mean Reversion: Look for reversals when price returns to the midline.
Custom Optimization: Adjust lookback periods and MA types based on market conditions.
Why It's Unique
✅ Combines Trend & Mean Reversion Analysis in one indicator.
✅ Flexible Z-score settings & MA choices for enhanced adaptability.
✅ Clear visual representation of market extremes.
Final Notes
This indicator is best suited for discretionary traders, quantitative analysts, and systematic traders looking for data-driven market insights. As with any trading tool, use in conjunction with other analysis methods for optimal results.

EMA Adaptive Trailing StopThe EMA Adaptive Trailing Stop Strategy is a versatile and comprehensive Pine Script designed for TradingView. This script provides an adaptive trailing stop mechanism that leverages the Exponential Moving Average (EMA) to adjust trailing stops based on market conditions. The strategy dynamically switches between trending and ranging markets by utilizing both Average True Range (ATR) and Average Directional Index (ADX) to detect market conditions.
Key Features:
EMA-Based Trailing Stop:
The script uses the EMA value to set trailing stops precisely. The EMA offers a more responsive calculation to price changes, ensuring closer and more accurate trailing stops that follow market movements effectively.
Market Condition Detection:
The script employs ATR and ADX to distinguish between trending and ranging markets. ATR measures market volatility, while ADX gauges trend strength. The combination of these two indicators provides a more accurate market condition detection.
Customizable Settings:
The script offers various flexible parameters to adjust EMA length, multipliers, and ATR length. Users can customize these settings according to their preferences and trading strategy.
Two Modes:
The script adapts to market conditions by providing two modes: trending mode and ranging mode. In trending mode, the trailing stop is tighter to follow price movements closely, whereas in ranging mode, the trailing stop is looser to accommodate lower volatility.
Entry and Exit Conditions:
The script detects market conditions to set buy and sell signals. These conditions include the calculations of EMA, ATR, and ADX to ensure the signals generated are valid and profitable.
Alerts:
The script provides buy and sell signals through alert conditions for efficient trade management. Users can enable these alerts to get real-time notifications when valid buy or sell signals are detected.
Suitable for Scalping and Swing Trading:
The script is well-suited for both scalping and swing trading strategies. Scalpers can benefit from the responsive and tighter trailing stops during trending conditions, while swing traders can take advantage of the adaptive and looser trailing stops during ranging conditions, allowing them to capture larger price movements.
Explanation of Mode 1 and Mode 2:
Mode 1: Trending Market:
In this mode, the market is identified as trending based on the ADX and ATR values.
LONG 1: This label indicates a buy signal in the trending market mode. It signifies that the trailing stop has been activated and a long position (buy) should be taken when the market is trending.
SHORT 1: This label indicates a sell signal in the trending market mode. It signifies that the trailing stop has been activated and a short position (sell) should be taken when the market is trending.
Mode 2: Ranging Market:
In this mode, the market is identified as ranging based on the ADX and ATR values.
LONG 2: This label indicates a buy signal in the ranging market mode. It signifies that the trailing stop has been activated and a long position (buy) should be taken with a looser trailing stop when the market is ranging.
SHORT 2: This label indicates a sell signal in the ranging market mode. It signifies that the trailing stop has been activated and a short position (sell) should be taken with a looser trailing stop when the market is ranging.
Technical Usage:
Variable Initialization:
The script initializes variables to store values such as trailing stop, long position status, and short position status.
Market Condition Detection:
The script calculates ATR and ADX values to detect whether the market is trending or ranging. This includes the use of f_adx function to calculate ADX values and determine market conditions.
EMA-Based Trailing Stop Calculation:
The script adjusts the trailing stop based on EMA values and ATR. The calculation involves customizable multipliers and parameters that influence the trailing stop's precision.
Plot Trailing Stop:
The script displays the trailing stop on the chart for clear visualization. This includes plotting the trailing stop line with appropriate colors to indicate long and short positions.
Entry and Exit Conditions:
The script determines the entry (buy) and exit (sell) conditions based on market condition detection and trailing stop settings. These conditions are crucial for generating valid buy or sell signals.
Plotshape and Alert:
The script provides plotshapes for buy and sell signals and sets up alert conditions for real-time notifications when a valid buy or sell signal is detected.

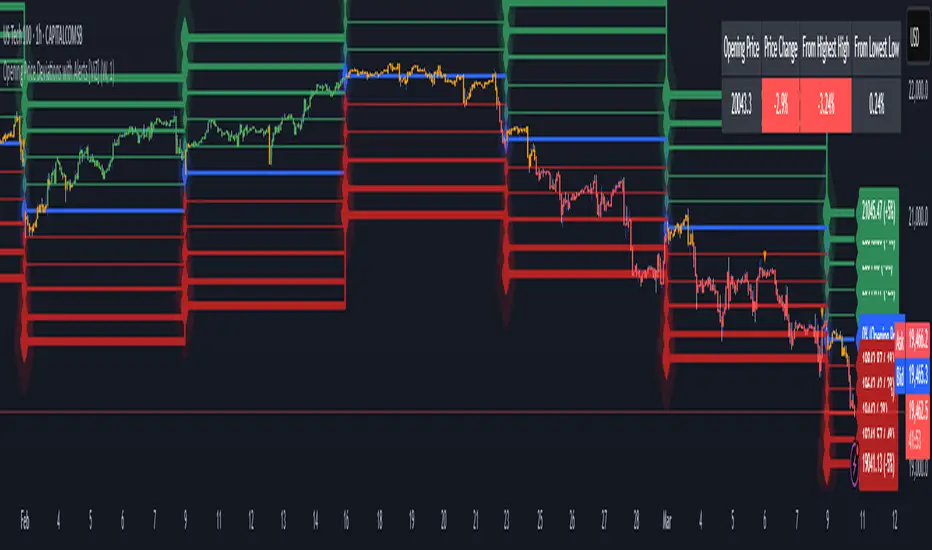
Opening Price Deviations with AlertsOverview
The Timeframe Opening Price Deviations indicator helps traders visualize how price deviates from a key reference point—the opening price of a selected timeframe (Daily, Weekly, or Monthly). It calculates upper and lower deviation levels based on a percentage step and plots these levels on the chart. This can help traders identify potential areas of support and resistance.
----------------------------------------------------------------------------------------------------------------------
How It Works
Opening Price Reference:
The script retrieves the opening price of the selected timeframe (Daily, Weekly, or Monthly).
Deviation Levels Calculation:
Five upper and lower deviation levels are calculated based on a percentage step input by the user.
Each level is determined by multiplying the opening price by (1 ± step size).
Visualization
The indicator plots the calculated levels as horizontal lines above and below the opening price.
Labels appear only on the latest bar, displaying the exact price level along with its percentage deviation from the opening price.
User has the option to turn on/off or change the bar colours. If price is within the 1st deviation lines that's considered neutral coloured orange as default. If price is above/below the first deviation levels the bar colours will be green or red.
---------------------------------------------------------------------------------------------------------------------
Potential Use Cases
Support & Resistance Zones 🟢🔴
The deviation levels can act as potential areas where price may reverse or consolidate based on historical price behaviour.
Breakout & Reversion Strategies 📈📉
If price breaks above an upper deviation level, it could indicate momentum continuation.
If price rejects from a level, it might suggest a mean reversion opportunity.
Trend Strength Analysis 🔍
The distance between the price and deviation levels can help traders assess whether a trend is strong (moving away from the opening price) or weak (hovering near the opening price).
Intraday vs. Multi-Timeframe Perspective 🕒
By selecting different timeframes (Daily, Weekly, Monthly), traders can align intraday price movements with higher timeframe reference points for added confluence.
---------------------------------------------------------------------------------------------------------------------
Customization Options
Timeframe Selection: Choose between Daily, Weekly, or Monthly opening prices.
Deviation Step (%): Adjust the step size to control the spacing between deviation levels.
Colour Bars: User Is able to change the colour of the bars.
---------------------------------------------------------------------------------------------------------------------
Alerts
This Indicator also has alerts for when price crosses above/below a deviation line. It will tell you the ticker, price and time
---------------------------------------------------------------------------------------------------------------------
Final Notes
This indicator is purely for technical analysis and should not be used as a standalone trading system. It works best when combined with price action, volume analysis, or other indicators of you're choosing to refine trade decisions.
Happy Trading! 🚀📊
---------------------------------------------------------------------------------------------------------------------
This explanation is clear, informative, and compliant with TradingView’s House Rules.
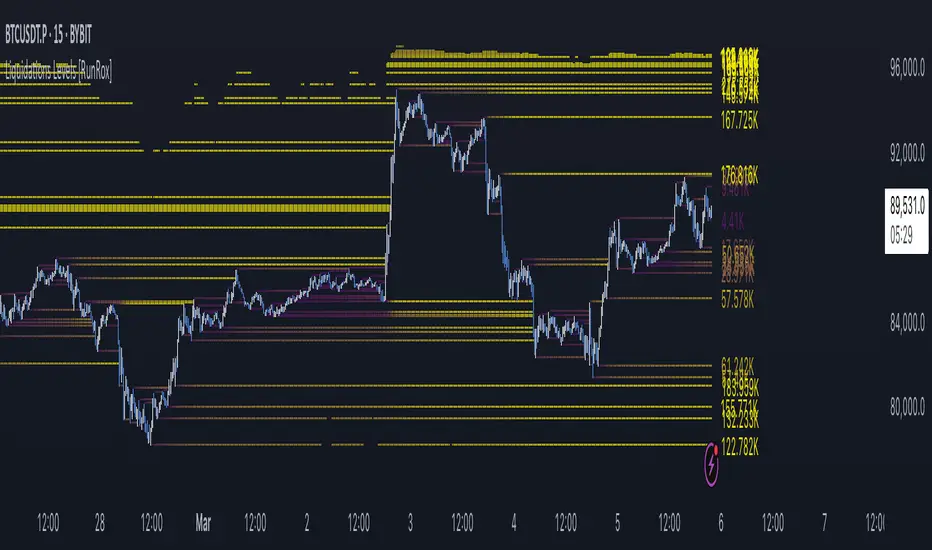
Liquidations Levels [RunRox]📈 Liquidation Levels is an indicator designed to visualize key price levels on the chart, highlighting potential reversal points where liquidity may trigger significant price movements.
Liquidity is essential in trading - price action consistently moves from one liquidity area to another. We’ve created this free indicator to help traders easily identify and visualize these liquidity zones on their charts.
📌 HOW IT WORKS
The indicator works by marking visible highs and lows, points widely recognized by traders. Because many traders commonly place their stop-loss orders beyond these visible extremes, significant liquidity accumulates behind these points. By analyzing trading volume and visible extremes, the indicator estimates areas where clusters of stop-loss orders (liquidity pools) are likely positioned, giving traders valuable insights into potential market moves.
As shown in the screenshot above, the price aggressively moved toward Sell-Side liquidity. After sweeping this liquidity level for the second time, it reversed and began targeting Buy-Side liquidity. This clearly demonstrates how price moves from one liquidity pool to another, continually seeking out liquidity to fuel its next directional move.
As shown in the screenshot, price levels with fewer anticipated trader stop-losses are indicated by less vibrant, faded colors. When the lines become more saturated and vivid, it signals that sufficient liquidity - in the form of clustered stop-losses has accumulated, potentially attracting price movement toward these areas.
⚙️ SETTINGS
🔹 Period – Increasing this setting makes the marked highs and lows more significant, filtering out minor price swings.
🔹 Low Volume – Select the color displayed for low-liquidity levels.
🔹 High Volume – Select the color displayed for high-liquidity levels.
🔹 Levels to Display – Choose between 1 and 15 nearest liquidity levels to be shown on the chart.
🔹 Volume Sensitivity – Adjust the sensitivity of the indicator to volume data on the chart.
🔹 Show Volume – Enable or disable the display of volume values next to each liquidity level.
🔹 Max Age – Limits displayed liquidity levels to those not older than the specified number of bars.
✅ HOW TO USE
One method of using this indicator is demonstrated in the screenshot above.
Price reached a high-liquidity level and showed an initial reaction. We then waited for a second confirmation - a liquidity sweep followed by a clear market structure break - to enter the trade.
Our target is set at the liquidity accumulated below, with the stop-loss placed behind the manipulation high responsible for the liquidity sweep.
By following this approach, you can effectively identify trading opportunities using this indicator.
🔶 We’ve made every effort to create an indicator that’s as simple and user-friendly as possible. We’ll continue to improve and enhance it based on your feedback and suggestions in the future.
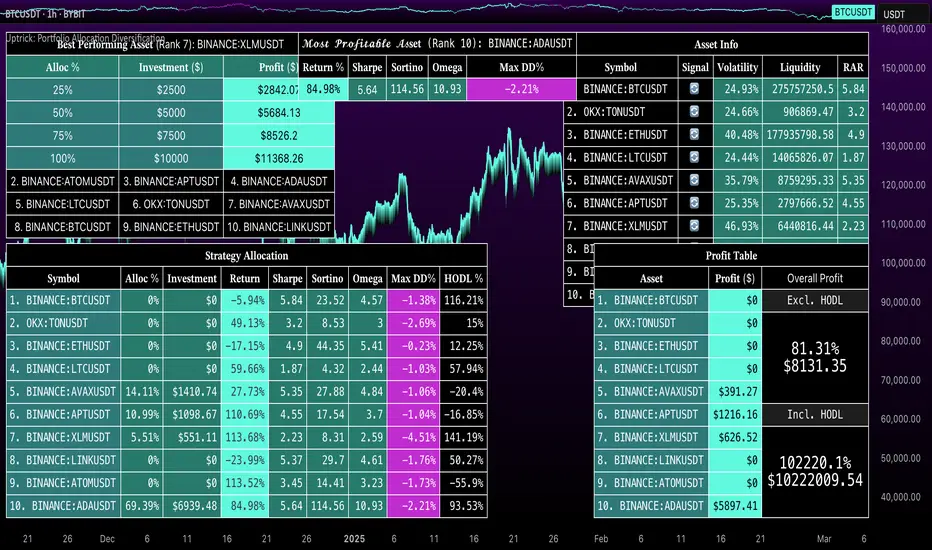
Uptrick: Portfolio Allocation DiversificationIntro
The Uptrick: Portfolio Allocation Diversification script is designed to help traders and investors manage multiple assets simultaneously. It generates signals based on various trading systems, allocates capital using different diversification methods, and displays real-time metrics and performance tables on the chart. The indicator compares active trading strategies with a separate long-term holding (HODL) simulation, allowing you to see how a systematic trading approach stacks up against a simple buy-and-hold strategy.
------------------------------------------------------------------------
Trading System Selection
1. No signals (none)
In this mode, the script does not produce bullish or bearish indicators; every asset stays in a neutral stance. This setup is useful if you prefer to observe how capital might be distributed based solely on the chosen diversification method, with no influence from directional signals.
2. rsi – neutral
This mode uses an index-based measure of whether an asset appears overbought or oversold. It generates a bearish signal if market conditions point to overbought territory, and a bullish signal if they indicate oversold territory. If neither extreme surfaces, it remains neutral. Some traders apply this in sideways or range-bound conditions, where overbought and oversold levels often hint at possible turning points. It does not specifically account for divergence patterns.
3. rsi – long only
In this setting, the system watches for instances where momentum readings strengthen even if the asset’s price is still under pressure or setting new lows. It also considers oversold levels as potential signals for a bullish setup. When such conditions emerge, the script flags a possible move to the upside, ignoring indications that might otherwise suggest a bearish trend. This approach is generally favored by those who want to concentrate exclusively on identifying price recoveries.
4. rsi – short only
Here, the script focuses on spotting signs of deteriorating momentum while an asset’s price remains relatively high or attempts further gains. It also checks whether the market is drifting into overbought territory, suggesting a potential decline. Under such conditions, it issues a bearish signal. It provides no bullish alerts, making it particularly suitable for traders who look to take advantage of overvalued scenarios or protect themselves against sudden downward moves.
5. Deviation from fair value
Under this system, the script judges how far the current price may have strayed from what is considered typical, taking into account normal fluctuations. If the asset appears to be trading at an unusually low level compared to that reference, it is flagged as bullish. If it seems abnormally high, a bearish signal is issued. This can be applied in various market environments to seek opportunities that arise from perceived mispricing.
6. Percentile channel valuation
In this mode, the script determines where an asset's price stands within a historical distribution, highlighting whether it has reached unusually high or low territory compared to its recent past. When the price reaches what is deemed an extreme reading, it may indicate that a reversal is more likely. This approach is often used by traders who watch for statistical outliers and potential reversion to a more typical trading range.
7. ATH valuation
This technique involves comparing an asset's current price with its previously recorded peak values. The script then interprets whether the price is positioned so far below the all-time high that it looks discounted, or so close to that high that it could be overextended. Such perspective is favored by market participants who want to see if an asset still has ample room to climb before matching historic extremes, or if it is nearing a possible ceiling.
8. Z-score system
Here, the script measures how far above or below a standard reference average an asset's price may be, translated into standardized units. Substantial negative readings can suggest a price that might be unusually weak, prompting a bullish indication, while large positive readings could signal overextension and lead to a bearish call. This method is useful for traders watching for abrupt deviations from a norm that often invite a reversion to more balanced levels.
RSI Divergence Period
This input is particularly relevant for the RSI - Long Only and RSI - Short Only modes. The period determines how many bars in the past you compare RSI values to detect any divergences.
------------------------------------------------------------------------
Diversification Method
Once the script has determined a bullish, bearish, or neutral stance for each asset, it then calculates how to distribute capital among all included assets. The diversification method sets the weighting logic.
1. None
Gives each asset an equal weight. For example, if you have five included assets, each might get 20 percent. This is a simple baseline.
2. Risk-Adjusted Expected Return Using Volatility Clustering
Emphasizes each asset’s average returns relative to its observed risk or volatility tendencies. Assets that exhibit good risk-adjusted returns combined with moderate or lower volatility may receive higher weights than more volatile or less appealing assets. This helps steer capital toward assets that have historically provided a better ratio of return to risk.
3. Relative Strength
Allocates more capital to assets that show stronger price strength compared to a reference (for example, price above a long-term moving average plus a higher RSI). Assets in clear uptrends may be given higher allocations.
4. Trend-Following Indicators
Examines trend-based signals, like positive momentum measurements or upward-trending strength indicators, to assign more weight to assets demonstrating strong directional moves. This suits those who prefer to latch onto trending markets.
5. Volatility-Adjusted Momentum
Looks for assets that have strong price momentum but relatively subdued volatility. The script tends to reward assets that are trending well yet are not too volatile, aiming for stable upward performance rather than massive swings.
6. Correlation-Based Risk Parity
Attempts to weight assets in such a way that the overall portfolio risk is more balanced. Although it is not an advanced correlation matrix approach in a strict sense, it conceptually scales each asset’s weight so no single outlier heavily dominates.
7. Omega Ratio Maximization
Gives preference to assets with higher omega ratios. This ratio can be interpreted as the probability-weighted gains versus losses. Assets with a favorable skew are given more capital.
8. Liquidity-Weighted Valuation
Considers each asset’s average trading liquidity, such as the combination of volume and price. More liquid assets typically receive a higher allocation because they can be entered or exited with lower slippage. If the trading system signals bullishness, that can further boost the allocation, and if it signals bearishness, the allocation might be set to zero or reduced drastically.
9. Drawdown-Controlled Allocation (DCA)
Examines each asset’s maximum drawdown over a recent window. Assets experiencing lighter drawdowns (thus indicating somewhat less downside volatility) receive higher allocations, aiming for a smoother overall equity curve.
------------------------------------------------------------------------
Portfolio and Allocation Settings
Portfolio Value
Defines how much total capital is available for the strategy-based investment portion. For example, if set to 10,000, then each asset’s monetary allocation is determined by the percentage weighting times 10,000.
Use Fixed Allocation
When enabled, the script calculates the initial allocation percentages after 50 bars of data have passed. It then locks those percentages for the remainder of the backtest or real-time session. This feature allows traders to test a static weighting scenario to see how it differs from recalculating weights at each bar.
------------------------------------------------------------------------
HODL Simulator
The script has a separate simulation that accumulates positions in an asset whenever it appears to be recovering from an undervalued state. This parallel tracking is intended to contrast a simple buy-and-hold approach with the more adaptive allocation methods used elsewhere in the script.
HODL Buy Quantity
Each time an asset transitions from an undervalued state to a recovery phase, the simulator executes a purchase of a predefined quantity. For example, if set to 0.5 units, the system will accumulate this amount whenever conditions indicate a shift away from undervaluation.
HODL Buy Threshold
This parameter determines the level at which the simulation identifies an asset as transitioning out of an undervalued state. When the asset moves above this threshold after previously being classified as undervalued, a buy order is triggered. Over time, the performance of these accumulated positions is tracked, allowing for a comparison between this passive accumulation method and the more dynamic allocation strategy.
------------------------------------------------------------------------
Asset Table and Display Settings
The script displays data in multiple tables directly on your chart. You can toggle these tables on or off and position them in various corners of your TradingView screen.
Asset Info Table Position
This table provides key details for each included asset, displaying:
Symbol – Identifies the trading pair being monitored. This helps users keep track of which assets are included in the portfolio allocation process.
Current Trading Signal – Indicates whether the asset is in a bullish, bearish, or neutral state based on the selected trading system. This assists in quickly identifying which assets are showing potential trade opportunities.
Volatility Approximation – Represents the asset’s historical price fluctuations. Higher volatility suggests greater price swings, which can impact risk management and position sizing.
Liquidity Estimate – Reflects the asset’s market liquidity, often based on trading volume and price activity. More liquid assets tend to have lower transaction costs and reduced slippage, making them more favorable for active strategies.
Risk-Adjusted Return Value – Measures the asset’s returns relative to its risk level. This helps in determining whether an asset is generating efficient returns for the level of volatility it experiences, which is useful when making allocation decisions.
2. Strategy Allocation Table Position
Displays how your selected diversification method converts each asset into an allocation percentage. It also shows how much capital is being invested per asset, the cumulative return, standard performance metrics (for example, Sharpe ratio), and the separate HODL return percentage.
Symbol – Displays the asset being analyzed, ensuring clarity in allocation distribution.
Allocation Percentage – Represents the proportion of total capital assigned to each asset. This value is determined by the selected diversification method and helps traders understand how funds are distributed within the portfolio.
Investment Amount – Converts the allocation percentage into a dollar value based on the total portfolio size. This shows the exact amount being invested in each asset.
Cumulative Return – Tracks the total return of each asset over time, reflecting how well it has performed since the strategy began.
Sharpe Ratio – Evaluates the asset’s return in relation to its risk by comparing excess returns to volatility. A higher Sharpe ratio suggests a more favorable risk-adjusted performance.
Sortino Ratio – Similar to the Sharpe ratio, but focuses only on downside risk, making it more relevant for traders who prioritize minimizing losses.
Omega Ratio – Compares the probability of achieving gains versus losses, helping to assess whether an asset provides an attractive risk-reward balance.
Maximum Drawdown – Measures the largest percentage decline from an asset’s peak value to its lowest point. This metric helps traders understand the worst-case loss scenario.
HODL Return Percentage – Displays the hypothetical return if the asset had been bought and held instead of traded actively, offering a direct comparison between passive accumulation and the active strategy.
3. Profit Table
If the Profit Table is activated, it provides a summary of the actual dollar-based gains or losses for each asset and calculates the overall profit of the system. This table includes separate columns for profit excluding HODL and the combined total when HODL gains are included. As seen in the image below, this allows users to compare the performance of the active strategy against a passive buy-and-hold approach. The HODL profit percentage is derived from the Portfolio Value input, ensuring a clear comparison of accumulated returns.
4. Best Performing Asset Table
Focuses on the single highest-returning or highest-profit asset at that moment. It highlights the symbol, the asset’s cumulative returns, risk metrics, and other relevant stats. This helps identify which asset is currently outperforming the rest.
5. Most Profitable Asset
A simpler table that underscores the asset producing the highest absolute dollar profit across the portfolio.
------------------------------------------------------------------------
Multi Asset Selection
You can include up to ten different assets (such as BTCUSDT, ETHUSDT, ADAUSDT, and so on) in this script. Each asset has two inputs: one to enable or disable its inclusion, and another to select its trading pair symbol. Once you enable an asset, the script requests the relevant market data from TradingView.
------------------------------------------------------------------------
Uniqness and Features
1. Multiple Data Fetches
Each asset is pulled from the chart’s timeframe, along with various metrics such as RSI, volatility approximations, and trend indicators.
2. Various Risk and Performance Metrics
The script internally keeps track of different measures, like Sharpe ratio (a measure of average return adjusted for risk), Sortino ratio (which focuses on downside volatility), Omega ratio, and maximum drawdown. These metrics feed into the strategy allocation table, helping you quickly assess the risk-and-return profile of each asset.
3. Real-Time Tables
Instead of having to set up complex spreadsheets or external dashboards, the script updates all tables on every new bar. The color schemes in these tables are designed to draw attention to bullish or bearish signals, positive or negative returns, and so forth.
4. HODL Comparison
You can visually compare the active strategy’s results to a separate continuous buy-on-dips accumulation strategy. This allows for insight into whether your dynamic approach truly beats a simpler, more patient method.
5. Locking Allocations
The Use Fixed Allocation input is convenient for those who want to see how holding a fixed distribution of capital performs over time. It helps in distinguishing between constant rebalancing vs a fixed, set-and-forget style.
------------------------------------------------------------------------
How to use
1. Add the Script to Your Chart
Once added, open the settings panel to configure your asset list, choose a trading system, and select the diversification approach.
2. Select Assets
Pick up to ten symbols to monitor. Disable any you do not want included. Each included asset is then handled for signals, diversification, and performance metrics.
3. Choose Trading System
Decide if you prefer RSI-based signals, a fair-value approach, or a percentile-based method, among others. The script will then flag assets as bullish, bearish, or neutral according to that selection.
4. Pick a Diversification Method
For example, you might choose Trend-Following Indicators if you believe momentum stocks or cryptocurrencies will continue their trends. Or you could use the Omega Ratio approach if you want to reward assets that have had a favorable upside probability.
5. Set Portfolio Value and HODL Parameters
Enter how much capital you want to allocate in total (for the dynamic strategy) and adjust HODL buy quantities and thresholds as desired. (HODL Profit % is calculated from the Portfolio Value)
6. Inspect the Tables
On the chart, the script can display multiple tables showing your allocations, returns, risk metrics, and which assets are leading or lagging. Monitor these to make decisions about capital distribution or see how the strategy evolves.
------------------------------------------------------------------------
Additional Remarks
This script aims to simplify multi-asset portfolio management in a single tool. It emphasizes user-friendliness by color-coding the data in tables, so you do not need extra spreadsheets. The script is also flexible in letting you lock allocations or compare dynamic updates.
Always remember that no script can guarantee profitable outcomes. Real markets involve unpredictability, and real trading includes fees, slippage, and liquidity constraints not fully accounted for here. The script uses real-time and historical data for demonstration and educational purposes, providing a testing environment for various systematic strategies.
Performance Considerations
Due to the complexity of this script, users may experience longer loading times, especially when handling multiple assets or using advanced allocation methods. In some cases, calculations may time out if too many settings are adjusted simultaneously. If this occurs, removing and reapplying the indicator to the chart can help reset the process. Additionally, it is recommended to configure inputs gradually instead of adjusting all parameters at once, as excessive changes can extend the script’s loading duration beyond TradingView’s processing limits.
------------------------------------------------------------------------
Originality
This script stands out by integrating multiple asset management techniques within a single indicator, eliminating the need for multiple scripts or external portfolio tools. Unlike traditional single-asset strategies, it simultaneously evaluates multiple assets, applies systematic allocation logic, and tracks risk-adjusted performance in real time. The script is designed to function within TradingView’s script limitations while still allowing for complex portfolio simulations, making it an efficient tool for traders managing diverse holdings. Additionally, its combination of systematic trading signals with allocation-based diversification provides a structured approach to balancing exposure across different market conditions. The dynamic interplay between adaptive trading strategies and passive accumulation further differentiates it from conventional strategy indicators that focus solely on directional signals without considering capital allocation.
Conclusion
Uptrick: Portfolio Allocation Diversification pulls multiple assets into one efficient workflow, where each asset’s signal, volatility, and performance is measured, then assigned a share of capital according to your selected diversification method. The script accommodates both dynamic rebalancing and a locked allocation style, plus an ongoing HODL simulation for passive accumulation comparison. It neatly visualizes the entire process through on-chart tables that are updated every bar.
Traders and investors looking for ways to manage multiple assets under one unified framework can explore the different modules within this script to find what suits their style. Users can quickly switch among trading systems, vary the allocation approach, or review side-by-side performance metrics to see which method aligns best with their risk tolerance and market perspective.
VIX:VIX3M RatioThe VIX/VIX3M Ratio indicator compares the short-term (1-month) volatility index (VIX) to the medium-term (3-month) volatility index (VIX3M). This ratio provides insights into the market's volatility expectations across different time horizons.
Key Interpretations:
Ratio > 1: Short-term volatility expectations are higher than 3-month expectations
Ratio = 1: Short-term and medium-term volatility expectations are aligned
Ratio < 1: Medium-term volatility expectations are higher than short-term expectations
Potential Trading Insights:
A rising ratio may indicate increasing near-term market uncertainty
Significant deviations from 1.0 can signal potential market stress or changing risk perceptions
Traders use this to gauge the term structure of market volatility

Crypto Market Session Guide with Local TimeMaster the Markets with the Ultimate Trading Session Indicator
Timing is everything in trading. Knowing when liquidity is at its peak and when market sessions overlap can make all the difference in your strategy. This Market Session Guide Indicator helps you navigate the trading day with real-time session tracking, countdown timers, and local time adjustments—giving you a clear edge in the market.
Key Features
Live Session Tracking – Instantly see which trading session is active: Asian, European, US, or the high-volatility EU-US overlap.
Automatic Local Time Conversion – No need to convert UTC manually—session times adjust automatically based on your TradingView exchange settings.
Daylight Saving Time Adjustments – The US market opening and closing times are automatically adjusted for summer and winter shifts.
Countdown Timer for Session Close – Know exactly when the current session will end so you can time your trades effectively.
Next Market Opening Display – Always be prepared by knowing which market opens next and at what exact time in your local timezone.
Clear Visual Guide – A structured table in the top-right of your chart provides all essential session details without cluttering your screen.
How It Works
This indicator tracks the three main trading sessions:
Asian Session (Tokyo, Sydney): 00:00 - 09:00 UTC
European Session (London, Frankfurt): 07:00 - 16:00 UTC
US Session (New York, Chicago): 13:30 - 22:00 UTC (adjusts automatically for Daylight Saving Time)
EU-US Overlap: 12:00 - 16:00 UTC, the most volatile period of the trading day
It also highlights when a session is about to close and when the next one will begin, ensuring you are always aware of liquidity shifts in the market.
Why You Need This Indicator
Optimized for Forex, Crypto, and Indices – Helps traders align their strategies with the most active market hours.
Ideal for Scalping and Day Trading – Enter trades during peak volatility to maximize opportunities.
Eliminates Guesswork – Stop manually tracking time zones and market schedules—everything updates dynamically for you.
Upgrade Your Trading Strategy Today
This indicator simplifies market timing, ensuring you're always trading when liquidity and volatility are at their highest. Whether you're trading Forex, Crypto, or Stocks, knowing when markets open and close is essential for making informed decisions.
Try it out, and if you find it useful, consider sharing it with other traders. Your feedback is always welcome!

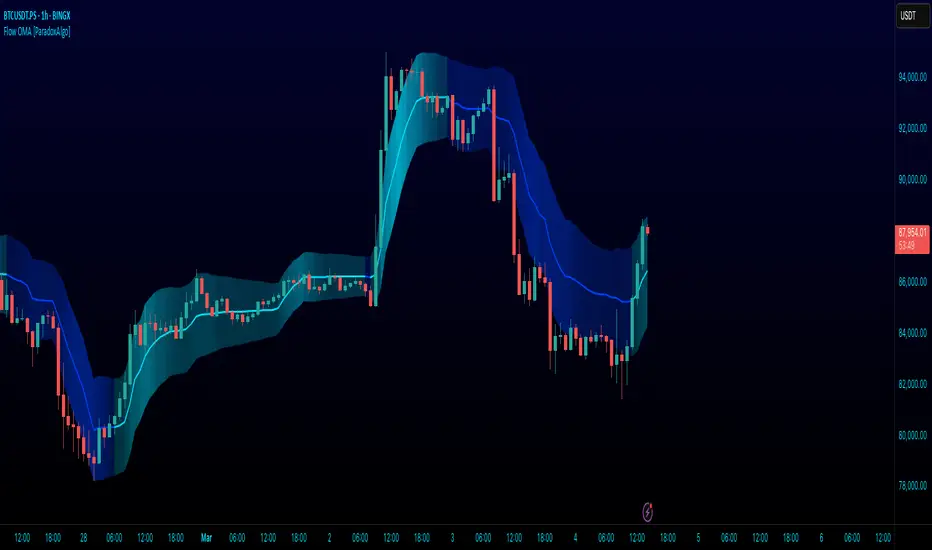
Flow Optimized Moving AverageOverview
The Flow Optimized Moving Average (Flow OMA) is an advanced adaptive moving average designed to dynamically adjust smoothing factors based on market efficiency and volatility. By integrating the Efficiency Ratio (ER) with an Adaptive Moving Average (AMA) and leveraging ATR-based bands, this indicator provides traders with a refined tool for identifying trend direction, strength, and potential reversal zones.
Key Features
Adaptive Moving Average (AMA)
Adjusts to price action based on the Efficiency Ratio (ER), reducing lag in trending markets while smoothing noise in ranging conditions.
Efficiency Ratio (ER)
Measures the effectiveness of price movement over a defined lookback period.
Helps in dynamically adjusting the smoothing constant of the AMA.
ATR-Based Volatility Bands
Creates upper and lower dynamic bands based on the Average True Range (ATR).
Expands in high volatility and contracts in low volatility, providing traders with a contextual understanding of price action.
Slope-Based Trend Strength
Normalizes the moving average slope relative to ATR.
Generates a trend strength score, which influences band opacity, making strong trends visually distinguishable.
Dynamic Color Coding
Bullish Trends: Cyan/Turquoise (#00e2ff)
Bearish Trends: Blue (#003ff5)
Neutral Trends: Gray
The transparency of the bands dynamically adjusts based on trend strength.
Fill Zone Effect
The area between the ATR bands is filled with a gradient-like effect, giving a clear visual representation of trend strength and transitions.
Indicator Components
Inputs (User Settings)
ER Lookback Period: Defines how many bars are used in the Efficiency Ratio calculation (default: 10).
Fast & Slow Periods: Control the sensitivity of the Adaptive Moving Average (default: 2 & 30).
ATR Period: Defines the lookback for Average True Range (default: 14).
Band Multiplier: Determines the width of ATR-based bands (default: 1.5).
Slope Average Period: Smooths trend slope for more stable trend assessment (default: 5).
Efficiency Ratio Calculation
Measures how effectively price moves in a straight line compared to its total movement.
A higher ER value suggests strong trend momentum, while a lower value implies consolidation.
Adaptive Moving Average (AMA)
Dynamically adjusts its smoothing factor based on ER.
Uses a smoothing constant that ranges between the fastest and slowest specified values.
Volatility-Based Bands
Constructed using the ATR multiplier.
Expand and contract dynamically in response to market volatility.
Trend Strength & Direction
Computed using the normalized slope of AMA against ATR.
Positive slope = Bullish trend, Negative slope = Bearish trend.
Visual Enhancements
Colored Adaptive MA Line: Changes based on trend direction.
ATR Bands with Gradient Fill: Visual representation of market conditions.
Dynamic Opacity: Highlights trend strength through transparency.
How to Use the Flow OMA Indicator
Trend Identification
When the Adaptive MA is rising and colored cyan, a bullish trend is in play.
When the Adaptive MA is falling and colored blue, a bearish trend is present.
Trend Strength Assessment
A stronger trend results in more opaque band fills, indicating a clear directional bias.
Weaker trends or consolidations result in fainter fills, signaling a loss of momentum.
Reversal Signals
If price touches the upper band in a bullish move and starts reversing, it can indicate potential profit-taking areas.
If price approaches the lower band in a bearish move and rebounds, a short-term reversal may be imminent.
Volatility Insights
Narrow bands indicate low volatility and possible breakout conditions.
Wider bands suggest increased volatility, warning traders of potential price swings.
Best Practices
✅ Combine with Other Indicators
Use RSI, MACD, or Volume Profile for confirmation before executing trades.
✅ Apply to Multiple Timeframes
Works effectively in higher timeframes (1H, 4H, Daily) for trend trading.
Can be utilized in lower timeframes (5m, 15m) for scalping setups.
✅ Adjust Parameters Based on Asset Volatility
Increase ATR Period for stocks with high volatility.
Reduce ATR Multiplier for forex pairs to avoid excessive band width.
The Flow Optimized Moving Average (Flow OMA) is a powerful trend-following tool designed for both swing and intraday traders. Its adaptive nature allows it to efficiently track trends while minimizing false signals. By incorporating dynamic volatility bands and trend-sensitive color coding, this indicator enhances traders' ability to read price action effectively. Whether used standalone or in combination with other indicators, Flow OMA provides a significant edge in trend analysis.
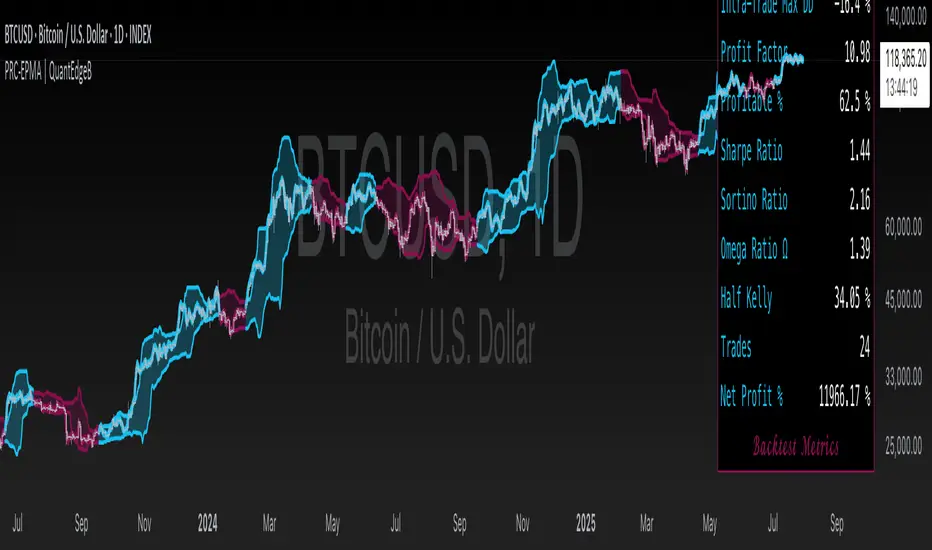
Volatility Based Momentum by QTX Algo SystemsVolatility Based Momentum by QTX Algo Systems
Overview
This indicator is designed to determine whether a market trend is genuinely supported by both momentum and volatility. It produces per-candle signals when a smoothed momentum oscillator is above its moving average, a Price – Moving Average Ratio confirms overall trend strength by remaining above a preset level with a positive slope, and when at least one of two distinct volatility metrics is rising. This integrated approach offers traders a consolidated and dynamic view of market energy, delivering more actionable insights than a simple merger of standard indicators.
How It Works
The indicator fuses two complementary volatility measures with dual momentum assessments to ensure robust signal generation. One volatility metric evaluates long-term market behavior by analyzing the dispersion of logarithmic price changes, while the other—derived from a Bollinger Band Width Percentile—captures recent price variability and confirms that market volatility remains above a minimum threshold. A trading signal is generated only when at least one of these volatility measures shows a sustained upward trend over several candles.
For momentum, a double‐smoothed Stochastic Momentum Index provides a refined, short-term view of price action, filtering out market noise. In addition, the PMARP serves as a confirmation tool by comparing the current price to its moving average, requiring that its value remains above a defined level with a positive slope to indicate a strong trend. Together, these elements ensure that a signal is only produced when both the market’s momentum and volatility are in alignment.
Although the components used are based on well-known technical analysis methods, the thoughtful integration of these elements creates a tool that is more than the sum of its parts. By combining long-term volatility assessment with a real-time measure of recent price variability—and by merging short-term momentum analysis with a confirmation of overall trend strength—the indicator delivers a more reliable and comprehensive view of market energy. This holistic approach distinguishes it from standard indicators.
How to Use
Traders can adjust the volatility threshold setting to tailor the indicator to their preferred market or timeframe. The indicator displays per-candle signals when both the refined momentum criteria and the dynamic volatility conditions are met. These signals are intended to be used as part of a broader trading strategy, in conjunction with other technical analysis tools for confirming entries and exits.
Disclaimer
This indicator is for educational purposes only and is intended to support your trading strategy. It does not guarantee performance, and past results are not indicative of future outcomes. Always use proper risk management and perform your own analysis before trading.

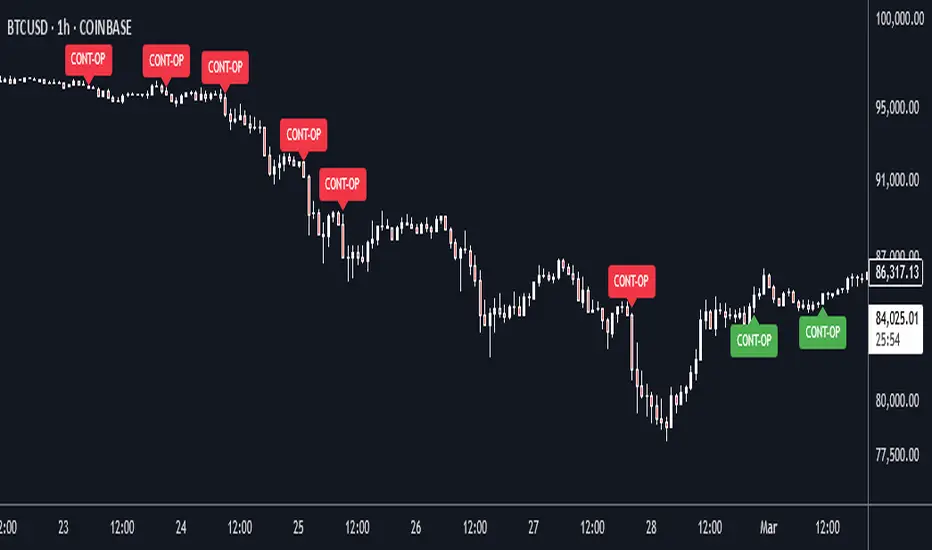
Continuation Opportunity Indicator by QTX Algo SystemsContinuation Opportunity Indicator by QTX Algo Systems
Overview
This indicator is designed to pinpoint key moments within an established trend when a pullback is likely just a temporary consolidation rather than a reversal. It distinguishes phases of reduced volatility—suggesting a pause or consolidation—from moments when volatility subsequently increases, confirming that the prevailing trend is resuming. This integrated approach combines multiple classical elements into a unique tool that offers traders clear insight into trend continuity.
How It Works
The indicator marries two types of volatility measurements with dual momentum assessments and a trend filter to generate continuation signals. Two complementary volatility metrics are used: one assesses long-term price dispersion to gauge overall market behavior, while the other employs a percentile-based method to capture recent variability and ensure that overall market volatility meets a minimum threshold. A critical part of the signal generation is that the pullback must occur during a period of reduced volatility, indicating consolidation, and then be followed by an increase in volatility, which confirms the resumption of the trend.
For momentum analysis, a double‐smoothed oscillator provides a refined, short-term view of price action, and a Price – Moving Average Ratio (PMARP) confirms the trend’s strength by requiring that it remains above or below a set threshold with a positive or negative slope, respectively. Signals are produced based on crossover events in the momentum oscillator that occur after a pullback, with the subsequent rise in volatility validating the trend continuation. A moving average-based trend filter further ensures that these signals align with the broader market direction.
While the individual components—volatility measures, momentum oscillators, and trend filters—are standard in technical analysis, their deliberate integration in this script results in a tool that is greater than the sum of its parts. Rather than merely merging indicators, this system is crafted to filter out false signals and clearly differentiate between temporary consolidations and genuine trend continuations. By providing a holistic view of market behavior, it offers traders actionable insight into when a pullback is simply a pause before the trend resumes.
How to Use
Traders should monitor the chart for opportunity signals. These signals indicate that a consolidation phase is ending and that the overall trend is likely to continue. Adjust the volatility parameters as needed to suit your market or timeframe, and use these signals in conjunction with other technical analysis tools to confirm optimal entry and exit points.
Disclaimer
This indicator is for educational purposes only and is intended to support your trading strategy. It does not guarantee performance, and past results are not indicative of future outcomes. Always use proper risk management and perform your own analysis before trading.
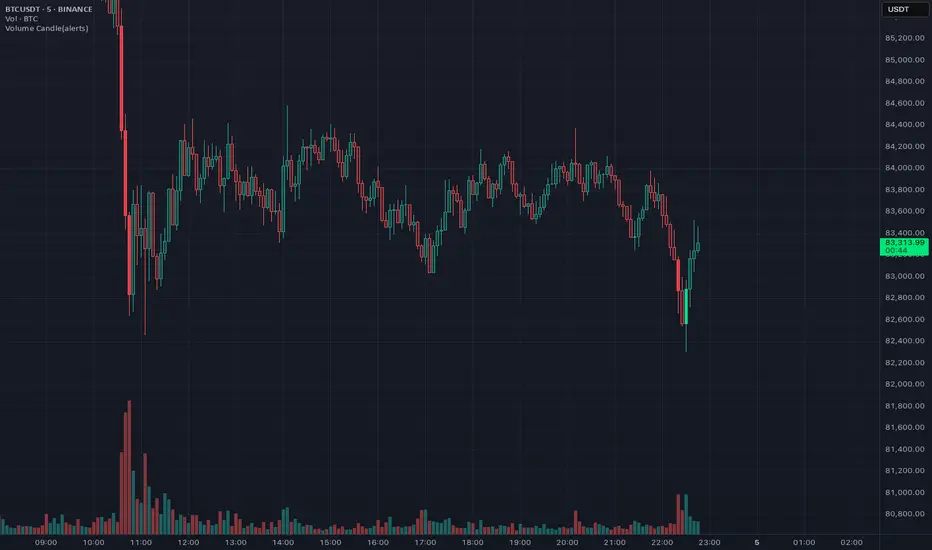
Volume Candle(alerts)This indicator highlights candles with unusually high trading volume by comparing the current volume to an EMA-based threshold. It helps identify significant volume spikes, which may indicate strong market movements.
Big Volume Detection
Compares the current volume to an EMA of past volume.
A candle is marked as "Big Volume" if the current volume exceeds the EMA by a specified multiple.
Color-Coded Candles
Big Volume & Bullish → Lime Green
Big Volume & Bearish → Red
Regular Bullish → Faded Lime (80% transparent)
Regular Bearish → Faded Red (80% transparent)
Alert System
Big Up or Down Volume → Triggers an alert when high volume occurs.
Big Up Volume → Triggers an alert for high-volume bullish candles.
Big Down Volume → Triggers an alert for high-volume bearish candles.
Customizable Settings
Period → EMA period for volume comparison (Default: 30)
Big Volume Multiple → Volume multiplier threshold for detection (Default: 3)
Use Cases
Spot unusual volume surges before major price moves
Confirm strong buying or selling pressure
Identify potential breakout zones
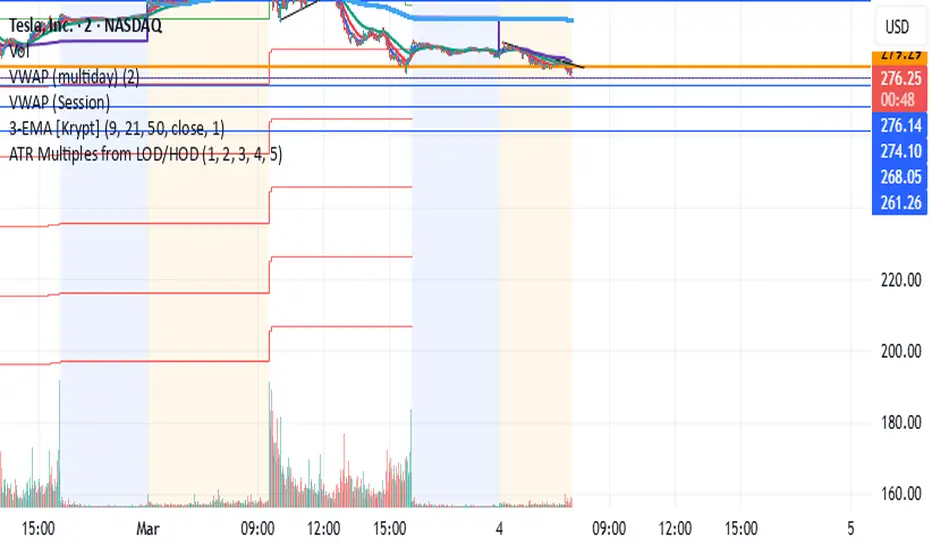
ATR Multiples from LOD/HODAn indicator that plots ATR (Average True Range) multiples from the current Low of Day (LOD) and High of Day (HOD). The indicator should:
Calculate the Low of Day (LOD) and High of Day (HOD) dynamically for the current trading session.
Use the ATR (Average True Range), with a customizable length, as the base measurement.
Plot multiple levels above the LOD and below the HOD, based on user-defined ATR multiples (e.g., 1x ATR, 2x ATR, 3x ATR, etc.).
Customizable Inputs:
ATR Length
ATR Multiples (Up to 5 levels)
Line color and style for each level
Display the ATR multiples on the chart as horizontal lines extending throughout the trading session.
QSL Upside/DownsideThe QSL Upside/Downside Indicator helps traders estimate potential gains and losses using Conditional Value at Risk (cVaR), a statistical measure that assesses both downside risk and upside potential beyond standard volatility. Instead of fixed timeframes (daily, weekly, etc.), traders can set a custom lookback period (in days) to analyze market behavior over their preferred time frame.
How It Works
The indicator calculates cVaR over the chosen period to determine how much an investment could move up or down based on past price behavior. It does this by:
• Mean Return – The average price movement over the period.
• Standard Deviation – Measures price fluctuations from the average.
• cVaR Confidence Interval (95%) – Estimates worst-case losses, meaning the downside projection reflects the worst 5% of expected losses.
• Upside Potential (Best 5%) – Instead of only considering risk, this indicator also calculates the potential upside by measuring returns in the top 5% of past price movements.
This provides a more complete view of what traders can expect—both in terms of risk and potential reward.
Key Features
✅ Custom Lookback Period – Set any number of days to analyze.
✅ cVaR Calculation (95% Confidence Interval) – Identifies extreme downside risks.
✅ Upside Potential (Best 5%) – Estimates how much an investment could rise in a best-case scenario.
✅ Clear Table Display – Quickly see projected best and worst-case portfolio values.
Understanding Probabilities: Upside & Downside Potential
Most traders focus on risk, but it’s equally important to understand potential gains. This indicator provides a probability-based view of expected market moves:
• 95% Confidence Interval (Downside cVaR) – There’s a 5% chance that losses could exceed this level.
• 95% Confidence Interval (Upside cVaR) – There’s a 5% chance that gains could be greater than this level.
• The remaining 90% of expected returns fall between these two extremes.
By knowing both potential losses and gains, traders can make more balanced, data-driven decisions rather than only focusing on worst-case scenarios.
Why Use This Indicator?
🔹 Better Risk & Reward Assessment – Understand both downside risk and upside potential.
🔹 More Realistic Market Projections – Uses probabilities instead of simple historical averages.
🔹 Flexible & Customizable – Works with any asset and any time period.
With this tool, QSL members can strategically plan trades, knowing the expected best and worst-case outcomes with a 95% probability range. 🚀

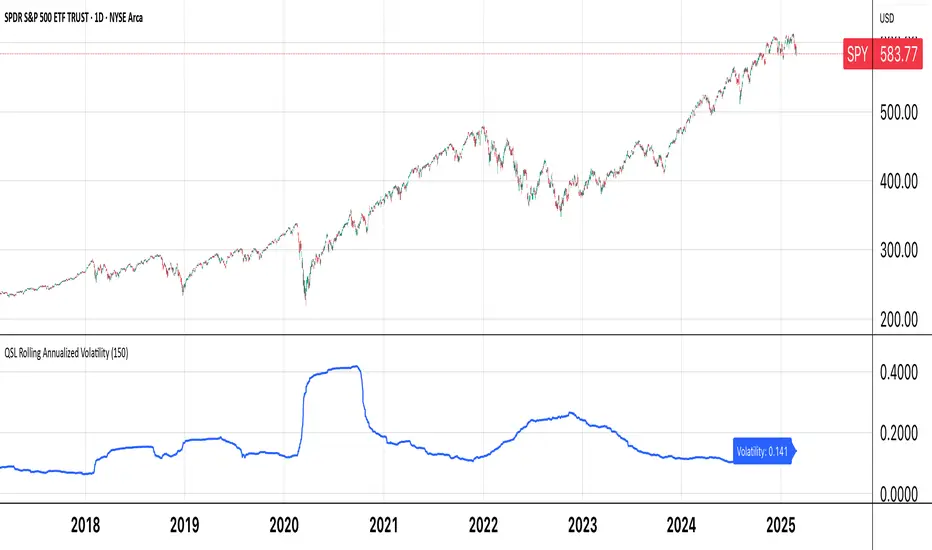
QSL Rolling Annualized VolatilityThis script calculates the rolling annualized volatility of an asset, helping traders measure how much its returns fluctuate over time. It uses logarithmic daily returns and computes the standard deviation over a custom lookback period (default: 252 trading days = 1 year) to capture historical volatility. The result is scaled to an annualized figure by multiplying by √252, making it comparable across different timeframes.
🔹 Key Features:
Customizable Lookback Period: Set in days to fit different trading strategies.
Annualized Output: Expresses volatility in yearly terms for consistency with financial models.
Rolling Calculation: Continuously updates to reflect recent market conditions.
Clear Visualization: Plots volatility as a time-series indicator and displays the latest value with a label.
This tool is ideal for risk management, position sizing, and strategy optimization in quantitative trading. 🚀
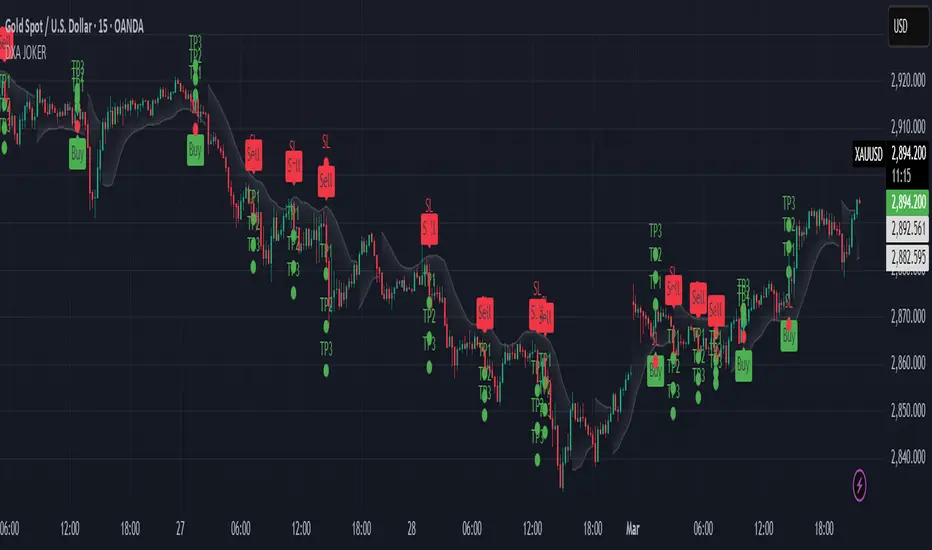
DXA JOKERThis custom indicator is designed to provide traders with a comprehensive toolkit for identifying potential entry and exit points in the market, while incorporating dynamic risk management features. The script integrates multiple analytical components to generate actionable signals, trend direction insights, and volatility-based adjustments for stop-loss and take-profit levels.
Key Features:
Signal Generation:
The indicator employs a sophisticated algorithm to generate precise trading signals. These signals are derived from a combination of trend-following and momentum-based calculations, ensuring adaptability to various market conditions. The signals are designed to highlight potential entry points for both long and short positions, providing clear visual cues on the chart.
Trend Identification:
A robust trend-detection mechanism is embedded within the indicator to assess the overall market direction. This component evaluates price action and momentum to determine whether the market is in a bullish, bearish, or neutral phase. The trend analysis is visually represented on the chart, allowing traders to align their strategies with the prevailing market conditions.
Volatility-Based Adjustments:
The script incorporates a dynamic volatility assessment tool to adjust stop-loss and take-profit levels according to current market conditions. By measuring market volatility, the indicator ensures that risk parameters are scaled appropriately, reducing the likelihood of premature stop-outs during periods of high volatility and optimizing profit potential during stable market phases.
Fibonacci-Based Levels:
The indicator includes a proprietary method for calculating and plotting Fibonacci-derived levels on the chart. These levels are used to identify potential support and resistance zones, which serve as strategic take-profit and stop-loss targets. The Fibonacci levels are dynamically updated based on recent price action, ensuring relevance to the current market structure.
Risk Management Integration:
The script seamlessly integrates risk management principles by combining volatility-adjusted stop-loss levels with Fibonacci-based take-profit targets. This approach allows traders to maintain a disciplined risk-reward ratio, enhancing the overall consistency of their trading strategy.
Visual Clarity:
The indicator is designed with a user-friendly interface, featuring clear visual markers for signals, trend direction, and key levels. Customizable colors and styles ensure that the indicator can be tailored to individual preferences, making it suitable for traders of all experience levels.
Usage Guidelines:
Entry Signals: Traders can use the generated signals to identify potential entry points in alignment with the prevailing trend.
Trend Confirmation: The trend-detection component provides additional confirmation, helping traders avoid counter-trend positions.
Stop-Loss and Take-Profit Levels: The dynamically calculated levels offer precise risk management guidelines, ensuring trades are executed with predefined risk parameters.
Volatility Awareness: The volatility assessment tool helps traders remain aware of changing market conditions, allowing for adjustments to position sizing and risk tolerance.
Conclusion:
This custom indicator is a versatile and powerful tool for traders seeking to enhance their decision-making process. By combining signal generation, trend analysis, volatility adjustments, and Fibonacci-based levels, the script provides a holistic approach to trading. Its intuitive design and dynamic calculations make it suitable for a wide range of trading styles and timeframes, empowering traders to navigate the markets with confidence and precision.
Bollinger Bands MTF & Kalman Filter | Flux Charts📈 Multi-Timeframe Kalman Filtered Bollinger Bands Indicator
Introducing our MTF Kalman Filtered Bollinger Bands – a powerful multi-timeframe Bollinger Bands (BB) indicator enhanced with Kalman filtering for superior smoothing and trend analysis. This indicator dynamically adapts Bollinger Bands across multiple timeframes while incorporating volume-based gradient transparency to highlight significant price movements. This indicator is better optimized for lower timeframes.
❓ How to Interpret the Bands & Volume Gradient:
Our indicator combines Lower Timeframe (LTF) and Higher Timeframe (HTF) Bollinger Bands to provide a comprehensive trend analysis. It applies Kalman filtering to the LTF bands, ensuring smoother, noise-reduced signals. The color gradient and relative volume-based transparency offer deeper insights into price strength.
🔹 LTF Bollinger Bands: Shorter-period bands filtered with a Kalman smoothing algorithm, reducing lag and noise.
🔹 HTF Bollinger Bands: Traditional Bollinger Bands plotted on a higher timeframe, offering macro trend analysis.
🔹 Volume Gradient Transparency: The bands adjust their opacity based on relative buy/sell volume, allowing traders to assess momentum strength.
📌 How Does It Work?
1️⃣ Multi-Timeframe Bollinger Bands Calculation
The LTF BB uses Kalman filtering for a smoother price representation, helping to reduce false signals.
The HTF BB is EMA-smoothed for improved trend clarity.
2️⃣ Adaptive Gradient Transparency
The opacity of the fill color between the bands is determined by relative buy/sell volume.
Higher buy volume = stronger bullish signal (greener bands).
Higher sell volume = stronger bearish signal (redder bands).
3️⃣ Dynamic Trend Signals & Breakouts
Buy Signal: When price breaks below the HTF lower band and LTF bands start rising.
Sell Signal: When price breaks above the HTF upper band and LTF bands start falling.
⚙️ Settings & Customization:
🛠 LTF and HTF Bollinger Bands Settings:
Multiplier: The multiplier applied to the BB to determine the upper and lower bands
Length: Define the number of bars determines the BB calculations.
Custom Timeframe Selection: Choose from predefined options (e.g., 5m, 15m, 1H, 4H, etc).
🎨 Gradient & Transparency Settings:
Bullish/Bearish Color Options: Customize colors for uptrend and downtrend conditions.
Max & Min Opacity: Adjust the transparency levels based on volume intensity.
Solid vs. Gradient Mode: Choose between a gradient fill or a solid color mode for clarity.
📌 Recommended Settings for Optimal Use:
1️⃣ Timeframe Selection (LTF -> HTF):
1 min -> 5 min
2 min -> 5 min
3 min -> 15 min
5 min -> 15 min
15 min -> 1 hr
1 hr -> 4 hr
4 hr -> 1 day
2️⃣ Multiplier: Use 2.0 for LTF and 2.25 for HTF
3️⃣Length: Use a length of 20 - 30 bars
🚀 Why Use This Indicator?
✅ Multi-Timeframe Bollinger Bands with Kalman Filtering – Ideal for traders looking for reduced lag and clearer trend signals.
✅ Volume-Based Transparency – See momentum shifts instantly with adaptive opacity.
✅ Dynamic Buy & Sell Signals – Alerts based on price action + volume trends.
✅ Customizable for Any Strategy – Adjust colors, timeframes, and filtering options for personalized trading.

Triangular Hull Moving Average + Volatility [BigBeluga]This indicator combines the Triangular Hull Moving Average (THMA) with a volatility overlay to provide a smoother trend-following tool while dynamically visualizing market volatility.
🔵 Key Features:
THMA-Based Trend Detection: The indicator applies a Triangular Hull Moving Average (THMA) to smooth price data, reducing lag while maintaining responsiveness to trend changes.
// THMA
thma(_src, _length) =>
ta.wma(ta.wma(_src,_length / 3) * 3 - ta.wma(_src, _length / 2) - ta.wma(_src, _length), _length)
Dynamic Volatility Bands: When enabled, the indicator displays wicks extending from the THMA-based candles. These bands expand and contract based on price volatility.
Trend Reversal Signals The indicator marks trend shifts using triangle-shaped signals:
- Upward triangles appear when the THMA trend shifts to bullish.
- Downward triangles appear when the THMA trend shifts to bearish.
Customizable Settings: Users can adjust the THMA length, volatility calculation period, and colors for up/down trends to fit their trading style.
Informative Dashboard: The bottom-right corner displays the current trend direction and volatility percentage, helping traders quickly assess market conditions.
🔵 Usage:
Trend Trading: The colored candles indicate whether the market is trending up or down. Traders can follow the trend direction and use trend reversals for entry or exit points.
Volatility Monitoring: When the volatility feature is enabled, the expanding or contracting wicks help visualize market momentum and potential breakout strength.
Signal Confirmation: The triangle signals can be used to confirm potential entry points when the trend shifts.
This tool is ideal for traders who want a responsive moving average with volatility insights to enhance their trend-following strategies.

[3Commas] Turtle StrategyTurtle Strategy
🔷 What it does: This indicator implements a modernized version of the Turtle Trading Strategy, designed for trend-following and automated trading with webhook integration. It identifies breakout opportunities using Donchian channels, providing entry and exit signals.
Channel 1: Detects short-term breakouts using the highest highs and lowest lows over a set period (default 20).
Channel 2: Acts as a confirmation filter by applying an offset to the same period, reducing false signals.
Exit Channel: Functions as a dynamic stop-loss (wait for candle close), adjusting based on market structure (default 10 periods).
Additionally, traders can enable a fixed Take Profit level, ensuring a systematic approach to profit-taking.
🔷 Who is it for:
Trend Traders: Those looking to capture long-term market moves.
Bot Users: Traders seeking to automate entries and exits with bot integration.
Rule-Based Traders: Operators who prefer a structured, systematic trading approach.
🔷 How does it work: The strategy generates buy and sell signals using a dual-channel confirmation system.
Long Entry: A buy signal is generated when the close price crosses above the previous high of Channel 1 and is confirmed by Channel 2.
Short Entry: A sell signal occurs when the close price falls below the previous low of Channel 1, with confirmation from Channel 2.
Exit Management: The Exit Channel acts as a trailing stop, dynamically adjusting to price movements. To exit the trade, wait for a full bar close.
Optional Take Profit (%): Closes trades at a predefined %.
🔷 Why it’s unique:
Modern Adaptation: Updates the classic Turtle Trading Strategy, with the possibility of using a second channel with an offset to filter the signals.
Dynamic Risk Management: Utilizes a trailing Exit Channel to help protect gains as trades move favorably.
Bot Integration: Automates trade execution through direct JSON signal communication with your DCA Bots.
🔷 Considerations Before Using the Indicator:
Market & Timeframe: Best suited for trending markets; higher timeframes (e.g., H4, D1) are recommended to minimize noise.
Sideways Markets: In choppy conditions, breakouts may lead to false signals—consider using additional filters.
Backtesting & Demo Testing: It is crucial to thoroughly backtest the strategy and run it on a demo account before risking real capital.
Parameter Adjustments: Ensure that commissions, slippage, and position sizes are set accurately to reflect real trading conditions.
🔷 STRATEGY PROPERTIES
Symbol: BINANCE:ETHUSDT (Spot).
Timeframe: 4h.
Test Period: All historical data available.
Initial Capital: 10000 USDT.
Order Size per Trade: 1% of Capital, you can use a higher value e.g. 5%, be cautious that the Max Drawdown does not exceed 10%, as it would indicate a very risky trading approach.
Commission: Binance commission 0.1%, adjust according to the exchange being used, lower numbers will generate unrealistic results. By using low values e.g. 5%, it allows us to adapt over time and check the functioning of the strategy.
Slippage: 5 ticks, for pairs with low liquidity or very large orders, this number should be increased as the order may not be filled at the desired level.
Margin for Long and Short Positions: 100%.
Indicator Settings: Default Configuration.
Period Channel 1: 20.
Period Channel 2: 20.
Period Channel 2 Offset: 20.
Period Exit: 10.
Take Profit %: Disable.
Strategy: Long & Short.
🔷 STRATEGY RESULTS
⚠️Remember, past results do not guarantee future performance.
Net Profit: +516.87 USDT (+5.17%).
Max Drawdown: -100.28 USDT (-0.95%).
Total Closed Trades: 281.
Percent Profitable: 40.21%.
Profit Factor: 1.704.
Average Trade: +1.84 USDT (+1.80%).
Average # Bars in Trades: 29.
🔷 How to Use It:
🔸 Adjust Settings:
Select your asset and timeframe suited for trend trading.
Adjust the periods for Channel 1, Channel 2, and the Exit Channel to align with the asset’s historical behavior. You can visualize these channels by going to the Style tab and enabling them.
For example, if you set Channel 2 to 40 with an offset of 40, signals will take longer to appear but will aim for a more defined trend.
Experiment with different values, a possible exit configuration is using 20 as well. Compare the results and adjust accordingly.
Enable the Take Profit (%) option if needed.
🔸Results Review:
It is important to check the Max Drawdown. This value should ideally not exceed 10% of your capital. Consider adjusting the trade size to ensure this threshold is not surpassed.
Remember to include the correct values for commission and slippage according to the symbol and exchange where you are conducting the tests. Otherwise, the results will not be realistic.
If you are satisfied with the results, you may consider automating your trades. However, it is strongly recommended to use a small amount of capital or a demo account to test proper execution before committing real funds.
🔸Create alerts to trigger the DCA Bot:
Verify Messages: Ensure the message matches the one specified by the DCA Bot.
Multi-Pair Configuration: For multi-pair setups, enable the option to add the symbol in the correct format.
Signal Settings: Enable the option to receive long or short signals (Entry | TP | SL), copy and paste the messages for the DCA Bots configured.
Alert Setup:
When creating an alert, set the condition to the indicator and choose "alert() function call only".
Enter any desired Alert Name.
Open the Notifications tab, enable Webhook URL, and paste the Webhook URL.
For more details, refer to the section: "How to use TradingView Custom Signals".
Finalize Alerts: Click Create, you're done! Alerts will now be sent automatically in the correct format.
🔷 INDICATOR SETTINGS
Period Channel 1: Period of highs and lows to trigger signals
Period Channel 2: Period of highs and lows to filter signals
Offset: Move Channel 2 to the right x bars to try to filter out the favorable signals.
Period Exit: It is the period of the Donchian channel that is used as trailing for the exits.
Strategy: Order Type direction in which trades are executed.
Take Profit %: When activated, the entered value will be used as the Take Profit in percentage from the entry price level.
Use Custom Test Period: When enabled signals only works in the selected time window. If disabled it will use all historical data available on the chart.
Test Start and End: Once the Custom Test Period is enabled, here you select the start and end date that you want to analyze.
Check Messages: Check Messages: Enable this option to review the messages that will be sent to the bot.
Entry | TP | SL: Enable this options to send Buy Entry, Take Profit (TP), and Stop Loss (SL) signals.
Deal Entry and Deal Exit: Copy and paste the message for the deal start signal and close order at Market Price of the DCA Bot. This is the message that will be sent with the alert to the Bot, you must verify that it is the same as the bot so that it can process properly.
DCA Bot Multi-Pair: You must activate it if you want to use the signals in a DCA Bot Multi-pair in the text box you must enter (using the correct format) the symbol in which you are creating the alert, you can check the format of each symbol when you create the bot.
👨🏻💻💭 We hope this tool helps enhance your trading. Your feedback is invaluable, so feel free to share any suggestions for improvements or new features you'd like to see implemented.
__
The information and publications within the 3Commas TradingView account are not meant to be and do not constitute financial, investment, trading, or other types of advice or recommendations supplied or endorsed by 3Commas and any of the parties acting on behalf of 3Commas, including its employees, contractors, ambassadors, etc.
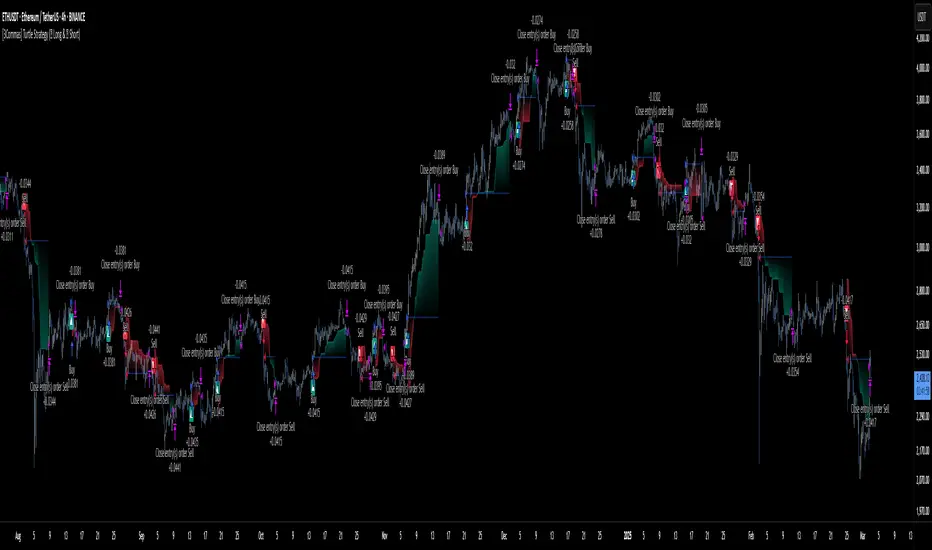
Bayesian TrendEnglish Description (primary)
1. Overview
This script implements a Naive Bayesian classifier to estimate the probability of an upcoming bullish, bearish, or neutral move. It combines multiple indicators—RSI, MACD histogram, EMA price difference in ATR units, ATR level vs. its average, and Volume vs. its average—to calculate likelihoods for each market direction. Each indicator is “binned” (categorized into discrete zones) and assigned conditional probabilities for bullish/bearish/neutral scenarios. The script then normalizes these probabilities and paints bars in green if bullish is most likely, red if bearish is most likely, or blue if neutral is most likely. A small table is also displayed in the top-right corner of the chart, showing real-time probabilities.
2. How it works
Indicator Calculations: The script calculates RSI, MACD (line and histogram), EMA, ATR, and Volume metrics.
Binning: Each metric is converted into a discrete category (e.g., low, medium, high). For example, RSI < 30 is binned as “low,” while RSI > 70 is binned as “high.”
Conditional Probabilities: User-defined tables specify the conditional probabilities of each bin under three hypotheses (Up, Down, Neutral).
Naive Bayesian Formula: The script multiplies the relevant conditional probabilities, normalizes them, and derives the final probabilities (Up, Down, or Neutral).
Visualization:
Bar Colors: Bars are green when the Up probability exceeds 50%, red for Down, and blue otherwise.
Table: Displays numeric probabilities of Up, Down, and Neutral in percentage terms.
3. How to use it
Add the script to your chart.
Observe the colored bars:
Green suggests a higher probability for bullish movement.
Red suggests a higher probability for bearish movement.
Blue indicates a higher probability of sideways or uncertain conditions.
Check the table in the top-right corner to see exact probabilities (Up/Down/Neutral).
Use the input settings to adjust thresholds (RSI, MACD, Volume, etc.), define alert conditions (e.g., when Up probability crosses 50%), and decide whether to trigger alerts on bar close or in real-time.
4. Originality and usefulness
Originality: This script uniquely applies a Naive Bayesian approach to a blend of classic and volume-based indicators. It demonstrates how different indicator “zones” can be combined to produce probabilistic insights.
Usefulness: Traders can interpret the probability breakdown to gauge the script’s bias. Unlike single indicators, this approach synthesizes several signals, potentially offering a more holistic perspective on market conditions.
5. Limitations
The conditional probabilities are manually assigned and may not reflect actual market behavior across all instruments or timeframes.
Results depend on the user’s choice of thresholds and indicator settings.
Like any indicator, past performance does not guarantee future results. Always confirm signals with additional analysis.
6. Disclaimer
This script is intended for educational and informational purposes only. It does not constitute financial advice. Trading involves significant risk, and you should make decisions based on your own analysis. Neither the script’s author nor TradingView is liable for any financial losses.
Русское описание (Russian translation, optional)
Этот индикатор реализует наивный Байесовский классификатор для оценки вероятности предстоящего роста (Up), падения (Down) или бокового движения (Neutral). Он комбинирует несколько индикаторов—RSI, гистограмму MACD, разницу цены и EMA в единицах ATR, уровень ATR относительно своего среднего значения и объём относительно своего среднего—чтобы вычислить вероятности для каждого направления рынка. Каждый индикатор делится на «зоны» (low, mid, high), которым приписаны условные вероятности для бычьего/медвежьего/нейтрального исхода. Скрипт нормирует эти вероятности и раскрашивает бары в зелёный, красный или синий цвет в зависимости от того, какая вероятность выше. Также в правом верхнем углу отображается таблица с текущими значениями вероятностей.
Acceleration Bands HTF
This version gives you the ability to see the indicator from the HIGHER timeframes when you are on the timeframes. Please note that this is not the original formula, but a factored one that I found effective for identifying market trends. Thanks to @capissimo who provided the base open-code.
Acceleration Bands are designed to capture potential price breakouts or reversals in an asset. They are calculated based on a stock's price movements over a specified period, typically using the high, low, and closing prices. The idea is to identify moments when the price is accelerating (hence the name) beyond its normal range, which might indicate the beginning of a new trend.
Calculation
Acceleration Bands consist of three lines:
Upper Band (AB Upper): This is calculated by adding a certain percentage of the simple moving average (SMA) to the highest high over a given period.
Middle Band: This is typically the SMA of the stock's price.
Lower Band (AB Lower): This is calculated by subtracting the same percentage of the SMA from the lowest low over a given period.
Mathematically :
AB Upper = SMA + (Highest High * Percentage)
AB Lower = SMA - (Lowest Low * Percentage)
OR
Upper Band = SMA x (1 + (High - Low) / SMA)
Lower Band = SMA x (1 - (High - Low) / SMA)
Interpretation
The bands are used to identify periods when the price of a security is accelerating or decelerating:
Breakout Above Upper Band: This is usually considered a bullish signal, suggesting that the price is accelerating upwards and a new uptrend may be starting.
Breakdown Below Lower Band: This is usually considered a bearish signal, suggesting that the price is accelerating downwards and a new downtrend may be starting.
Reversal Between Bands: When the price re-enters the region between the bands after breaking out, it can be seen as a potential reversal signal.
Trading Strategy
Entry Signals:
Buy when the price breaks above the upper band.
Sell or short when the price breaks below the lower band.
Exit Signals:
Close a long position when the price falls back into the area between the bands.
Close a short position when the price rises back into the area between the bands.
Advantages
Helps capture early trends.
Can be used across various time frames and assets.
Provides clear entry and exit signals.

RS ScanOverview
The RS Scan indicator helps traders analyze a stock's relative strength and volatility using multiple key metrics. It provides insights into where the stock is closing within its daily and weekly ranges, how far it has moved from its 52-week high, and how its price changes compare to its Average Daily Range (ADR).
Key Features
✅ Daily Close Range% – Shows the stock’s closing position within the day’s high-low range.
✅ Weekly Close Range% – Displays the stock’s closing position within the weekly high-low range.
✅ Stock Price Change% – Measures how much the stock has moved relative to its 52-week high.
✅ ADR% (Average Daily Range) – Calculates the stock’s average daily volatility over a given period (default: 20 days).
✅ ADR off 52W High – Indicates how many ADR multiples the stock has moved from its 52-week high.
How to Use
Identify Strength: Stocks closing near the high of their daily/weekly range show strong momentum.
Measure Volatility: The ADR% helps traders understand expected price fluctuations.
Detect Weakness: A stock trading far below its 52-week high with a low close range may indicate weakness.
Compare Price Change vs. ADR: If a stock is significantly down from its 52-week high but within a small ADR range, it may be consolidating.
Screening Example: If SPY is currently less than -3 ADR from its 52-week high, we can filter for stocks that are performing stronger by selecting those above -3 ADR. This helps in identifying stocks with relative strength compared to the broader market.
This indicator is useful for momentum traders, swing traders, and those tracking relative strength.
🚀 Try it out and enhance your trading decisions!
PRC-EPMA | QuantEdgeB Introducing PRC-EPMA by QuantEdgeB
Overview
The PRC-EPMA (Percentile-Endpoint Moving Average) is a sophisticated trading indicator developed for traders looking to capitalize on trend shifts with enhanced filtering mechanisms. It blends Endpoint Moving Averages, Percentile Rank, and Median Absolute Deviation (MAD) Filtering to generate high-probability long and short signals.
____
Key Features
🔹 1. Endpoint Moving Average (EPMA):
- A regression-based moving average that adapts quickly to price movements.
- Uses a linear regression slope to project future price direction.
- Helps traders identify trend direction more responsively than traditional moving averages.
🔹 2. Percentile Rank-Based Dynamic Levels:
- Identifies overbought (75th percentile) and oversold (25th percentile) zones.
- Dynamically adjusts based on historical data, making it robust across different market conditions.
🔹 3. Median Absolute Deviation (MAD) Filtering:
- An advanced volatility filter that refines entry and exit points.
- Reduces noise by filtering out weak signals, focusing only on meaningful trend shifts.
- Uses two multipliers (long and short) to fine-tune sensitivity.
🔹 4. Signal Generation:
- 📈Long Signal: Triggered when price closes above the upper dynamic threshold.
- 📉Short Signal: Triggered when price closes below the lower dynamic threshold.
- Uses color-coded candles to visually indicate trend shifts.
- Optional signal labels can be enabled for clear entry/exit indications.
🔹 5. Customizable Visualization:
- Multiple color themes to match user preferences.
- Ability to overlay signals on price charts.
- Alerts available for long & short crossovers.
_____
How It Works
1. The script calculates an Endpoint Moving Average based on a user-defined period.
2. It computes the 75th and 25th percentile ranks of the Endpoint Moving Average.
3. Median Absolute Deviation (MAD) Filtering is applied to reduce false breakouts.
4. A buy (long) or sell (short) signal is triggered when price crosses the respective filtered percentile levels.
5. Alerts and labels can be used to notify traders of new signals.
_____
Behavior across Crypto Majors (Using Default Settings)
BTC
ETH
SOL
Note : Past behaviour is not indicative of future results. Always conduct thorough testing and risk management before making trading decisions.
_____
Best Use Cases
📌 Trend Confirmation – Use EPMA to confirm if a trend is strengthening or weakening.
📌 Noise Reduction – MAD filtering prevents reacting to minor fluctuations, focusing on stronger trend shifts.
📌 Multi-Timeframe Scalability – Works across multiple timeframes (1H, 4H, Daily, etc.), depending on the trader’s strategy.
⚙️ Customizable Inputs ⚙️
- Endpoint Moving Average Lookback Length
- Percentile Rank Length
- MAD Filter Sensitivity (Multipliers for Long & Short)
- Signal Labels & Alerts for Long/Short Entries
- Color Theme Selection
Default Setup for PRC-EPMA
Linear Regression Length → 4
Endpoint Lookback → 14
Percentile Length → 21
Median Period (Absolute Deviation Filter) → 21
Upper Multiplier (Absolute Deviation Filter) → 1.8
Lower Multiplier (Absolute Deviation Filter) → 0.9
_____
Final Thoughts
The PRC-EPMA Indicator is a powerful tool for traders seeking high-quality entry and exit signals based on statistical and regression-based methodologies. By combining EPMA, Percentile Rank, and MAD Filtering, it ensures that only strong and validated signals are executed, making it a great addition for trend-followers and mean-reversion traders alike.
🔹 Disclaimer: Past performance is not indicative of future results. No trading strategy can guarantee success in financial markets.
🔹 Strategic Advice: Always backtest, optimize, and align parameters with your trading objectives and risk tolerance before live trading.