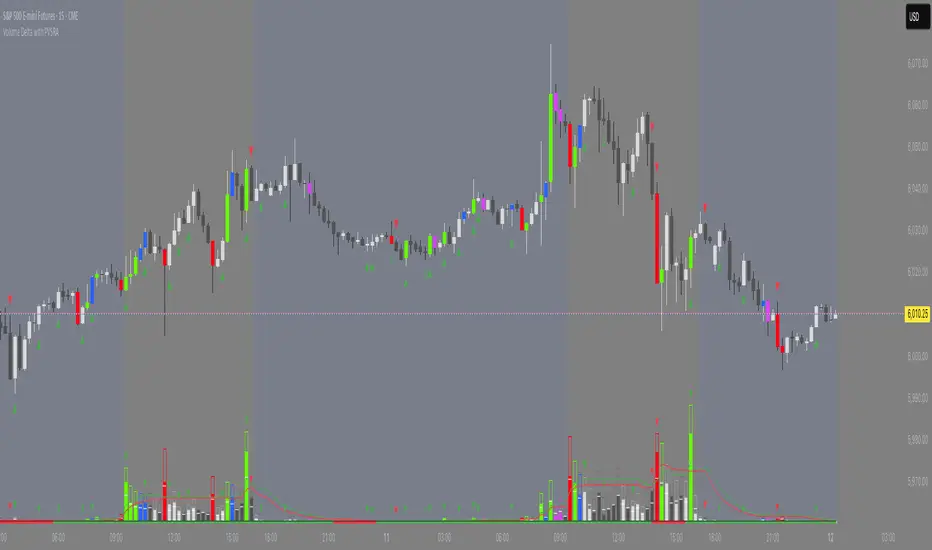
qqadv.ru VDelta SumThe qqadv.ru VDelta Sum indicator displays volume delta as candles and calculates the total buying and selling volumes for the visible range of the chart.
Features:
Delta is calculated based on a lower timeframe (configurable).
Option to plot all delta bars upwards from zero.
Customizable wick color (default: yellow).
A table in the top-right corner displays total buy and sell volumes, with fully customizable text and background colors.
How to Use:
Add the indicator to your chart.
Delta candles will automatically be plotted based on real-time volume delta data.
Adjust the settings as needed:
Enable "Delta Always Above Zero" to plot all delta bars upwards from the 0 line.
Customize the wick color for delta candles.
Customize the text and background colors for the table displaying buy/sell sums.
Interpretation:
Green candles indicate buy volume dominance.
Red candles indicate sell volume dominance.
Long wicks suggest significant internal buy or sell pressure during the candle.
Notes:
Recommended for use on 1M, 5M, or 15M charts for optimal accuracy.
Sudden delta spikes can signal potential reversals or strong hidden buying/selling activity.
Important:
The indicator uses a lower timeframe volume delta approximation. Data precision may vary based on your data provider and the selected chart resolution.
Volumedelta

SMC Dixchange1.2.6(DavidGlz)The SMC Indicator "DixChange" is an innovative tool developed for the DixChange community, focused on applying the principles of the Smart Money Concept (SMC) in market analysis. It integrates liquidity analysis, identification of accumulation and distribution zones, and monitoring of imbalances in supply and demand to detect the activity of smart money. Its intuitive design and adaptability to different timeframes allow traders and community analysts to anticipate key movements and optimize their entry and exit strategies, enhancing precise risk management and collaborative learning.
This indicator includes concepts from the Smart Money Concept (Orderblock, ChoCH, BOS, marking institutional zones, fractal supports and resistances, trend breakouts with signals, reversals or Fibonacci retracements, and it includes potential OTC readings).
twitter.com

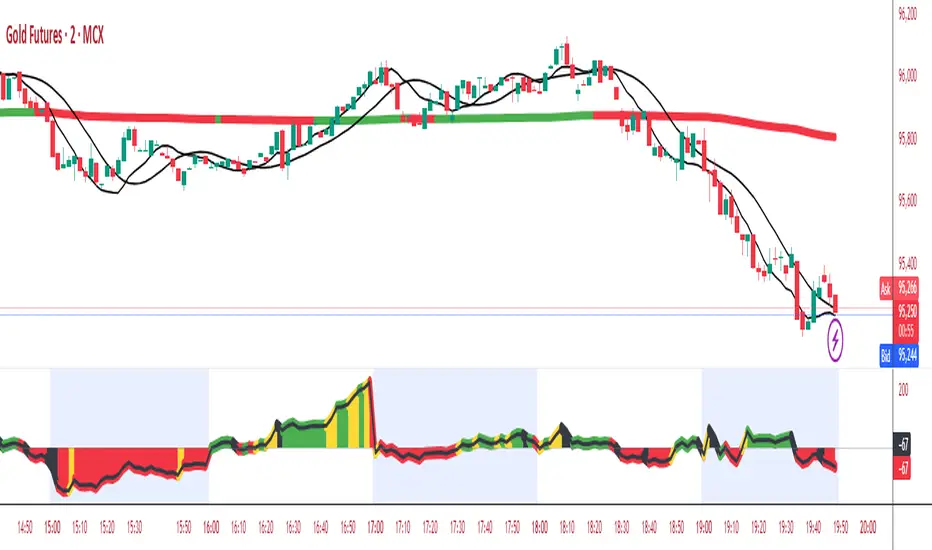
Advanced Cumulative Delta & VolumeAdvanced Cumulative Delta & Volume (Heuristic-Based)
This offers a powerful cumulative delta visualization based on price action heuristics—perfect for traders without access to real bid/ask volume data.
Features
Cumulative Delta Calculation
Built using estimated delta (based on close position and volume).
Includes a moving average-based surge detection system.
Surge Detection
Highlights candles where delta exceeds a multiple of its average.
Detects sustained surges across multiple bars for trend confirmation.
Visual Enhancements
Smoothed line and area chart for delta flow
Alternate background shading (light blue) for each timeframe interval—great for visual structure (e.g., every 30 minutes).
Color-coded:
Yellow for bullish surges
Black for bearish surges
Green for positive delta /red for negative delta
Customizable Inputs
Timeframe (for resampling logic)
Surge thresholds
Delta moving average length
Volume weight adjustment
Sustained bar count
Ideal For:
Order flow enthusiasts without premium data feeds
Scalpers & intraday traders
Anyone wanting a visual edge on volume-driven moves
CANDLE SCRUTINY | GSK-VIZAG-AP-INDIADescription (To Be Used in TradingView):
🔎 Candle Scrutiny is a real-time candle analytics tool that presents candle data in a clean, visual table overlay on the chart.
✅ It does NOT generate buy/sell signals, but instead empowers traders to make informed decisions by interpreting raw candle behavior.
📊 Features:
🕰️ Time-Based Table: View last n candles with OHLC behavior.
🟢🔴 Type Detection: Classifies candles as Bullish, Bearish, or Doji.
📈 Sequential Move (SM) Total: Cumulative candle body movement during trends.
🔁 Trend Count: Increments with each same-type candle (Bullish/Bullish or Bearish/Bearish), resets when type changes.
📉 Buy/Sell Volume Estimation: Volume breakdown by inferred direction.
⚖️ Delta: Buy minus Sell volume, indicating control.
🎯 Who Should Use This:
Intraday Traders
Price Action Scalpers
Traders looking to understand short-term microtrends
🚫 No repainting
🛠️ Fully table-based visual aid
📍 Authored by GSK-VIZAG-AP-INDIA
⚠️ Disclaimer: This is an informational tool only. It does not provide financial advice or trading signals.

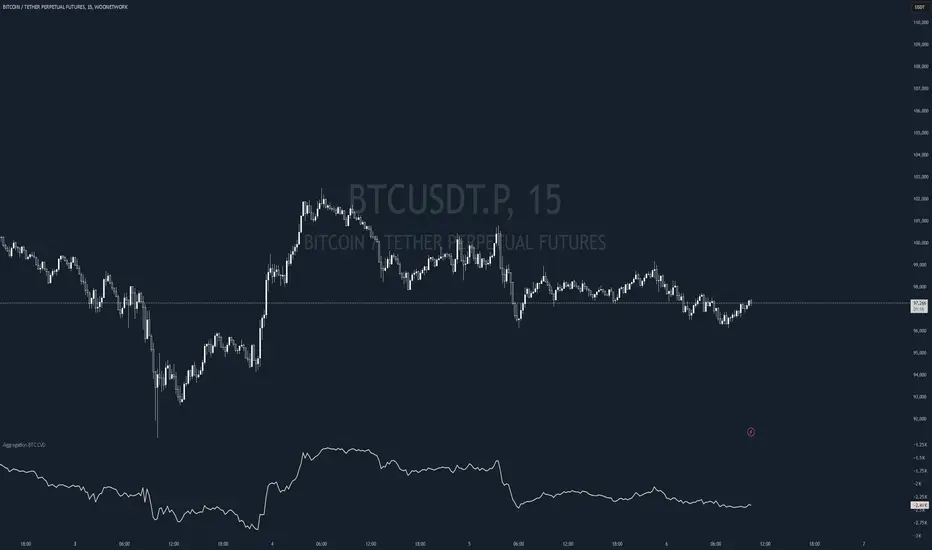
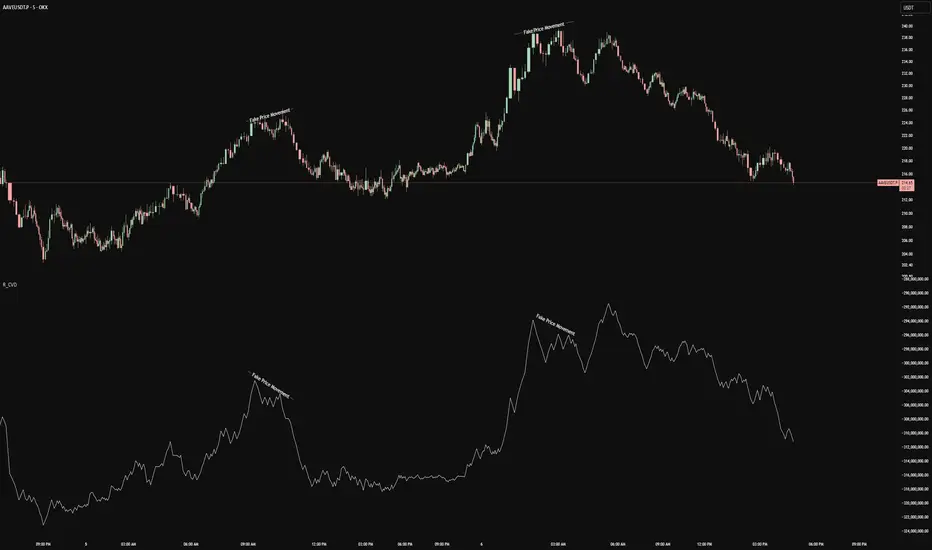
Aggregation BTC CVDThe script calculates the Cumulative Volume Delta (CVD) for multiple cryptocurrency exchanges, then averages these values and plots them.
Indicator Setup:
The script sets up an indicator called "BTC Cumulative Volume Delta (CVD) for multiple cryptocurrency exchanges", displayed as a separate panel (not overlaid on the price chart) with volume format.
Getting 1-minute data from multiple exchanges:
It retrieves 1-minute data (buy and sell volumes) for Bitcoin (BTC) against USD or USDT from several exchanges: Binance, OKEx, Coinbase (both BTCUSDT and BTCUSD), Bitfinex, Bybit, Huobi, and Kraken.
Calculating total buying and selling volume for each exchange:
For each exchange, it calculates the total buying volume (buy_vol_...), selling volume (sell_vol_...), and the difference between them (delta_vol_...).
It then computes the cumulative delta volume (cum_delta_vol_...), which is a running total of delta_vol_....
Calculating the average CVD:
It calculates the average cumulative delta volume (average_cum_delta_vol) by summing the cumulative delta volumes from all exchanges and dividing by the number of exchanges.
Plotting the average CVD:
Finally, it plots the average CVD with white color, and a line width of 2.
This script essentially provides an averaged Cumulative Volume Delta across multiple exchanges, giving a comprehensive view of buying and selling pressure in the Bitcoin market across these platforms.
Radonezh Kir-Mary Beauty editionOverview
Dedicated to rev. Kirill and Mary of Radonezh.
This indicator uniquely combines Cumulative Volume Delta (CVD) and price momentum with dynamic normalization to identify trend strength, reversals, supported by a combination of more traditional signal logic. Unlike traditional momentum oscillators, it integrates volume dynamics and advanced directional index to filter false signals and adapts to market volatility through automated scaling, offering a holistic view of price-action reliability.
Core Innovations
Adapive Signals: Uses a proprietary correlation algorithm to weight momentum values, reducing noise in choppy markets.
Lower timeframe entry points: (currently 1 minute only) and HTF line statuses for timeframe synchronisation (currently only 15 minutes and 1 hour status) for super-precise entry points
Automatic drawing of resistance and support lines based on the proprietary algorithm for detecting volume/price synchronization and desynchronization levels.
"Victor-predictor": price chart pointing line that shows where the price supposedly goes based on the machine-learning simulation with pine script based on the main 3 traditional classical indicators. Works independently from the rest of the indicator. Developed by @Skorcez (same team).
Automatic recognition of possible long and short stop order placement levels. I do not filter them so use only within the general context of the indicator.
Key Features
Volume-Price Correlation: CVD reflects institutional order flow, while price momentum quantifies trend acceleration.
Auto-Scaling: Adjusts output range based on recent volatility (ATR), preventing overbought/oversold false positives.
Visual Alerts: Marks divergence zones with colored trendlines and labels (regular/hidden bullish/bearish).
Unique Value
By fusing volume delta dynamics with momentum filtering, this script addresses a critical gap in traditional indicators that treat price and volume in isolation. The closed-source logic focuses on institutional accumulation/distribution patterns, providing actionable signals without repainting.
Compatible with all assets and timeframes. No promotional content or external links included.
============================================
Trading strategy
============================================
Position Signals via DEMA Momentum Line Coloration
The main indicator line (orange/black) determines entry/exits based on its color intensity, which reflects trend strength and confirmation from filtered signals. Here's how it works:
Long Positions (Green/Teal)
Weak Long:
Dark Green = Price momentum rising without volume/Machine Learning (ML) confirmation.
Example: main line turns green but lacks volume spikes or ML buy signals.
Strong Long:
Bright Green = Momentum confirmed by:
Volume Surge: Volume exceeds 1.5x 20-period average.
ML Confirmation: ML score > 0.7 with price above EMA20.
Post-Drop Recovery: Price rebounds after a >1% drop on high volume. (not active as of now, will add a bit later, still working on it)
Short Positions (Red/Orange)
Weak Short:
Orange = Momentum declines without bearish confirmation.
Strong Short:
Bright Red = Confirmed by:
Volume Divergence: Rising price with falling CVD momentum.
ML Bearish: ML score > 0.7 + price below EMA20.
Overextension: RSI > 70 + price above upper Bollinger Band.
Neutral (Gray)
Flat Momentum:
Gray = Momentum near zero (±0.05) + low volatility (ATR < 1% of price).
Action: Avoid trades until color intensifies or stay in a position with a trailing stoploss until it's clear where the market goes (use HTF signal colour table to know what to expect).
Key Features
Adaptive Confirmation:
Colors brighten when signals align across:
Volume acceleration
RSI and a few other extremes (oversold/overbought)
Machine Learning predictions
Dynamic Risk Zones:
Gray areas highlight low-confidence periods, while bright colors mark high-probability entries.
Usage: Enter longs when the line turns bright green and exits when it fades to dark green/gray. Reverse for shorts. Combine with the built-in Victor-Predictor signals for optimal accuracy
============================================
Plans to add soon:
============================================
Dynamic Normalization: Scales CVD and price momentum to a fixed range (default: -20 to +20) using volatility-adjusted multipliers, ensuring consistent interpretation across assets/timeframes.
Divergence Detection: Flags discrepancies between volume-driven momentum (CVD) and price trends, highlighting potential reversals.
Adding 2 nearest psychological support and resistance levels.

Bubbles volume delta v3 (Bubbles, Div, SR, VWAP)Features and Settings
The indicator settings are organized into groups:
1. Bubbles & Volume Labels
This section controls the display of volume bubbles directly on price bars.
Show Bubbles: (Checkbox) Turns the volume bubbles on or off.
Threshold: (Number) Sets the normalized volume level (current volume / average volume) required for bubbles to start increasing in size. Higher values mean only relatively higher volume bars will show larger bubbles.
Bubble Base Color: (Color Picker) Sets the default color of the bubbles if "Color Bubbles by Delta Direction" is turned off.
Volume Label Size: (Number) Controls the size of the text label displayed with the bubbles (maps to Tiny, Small, Normal, etc.).
Show Labels on Tiny/Small/Normal/Large/Huge Bubbles: (Checkboxes) Individually control whether volume/delta text labels appear based on the calculated size of the bubble. Useful for reducing clutter on smaller volume bars.
2. Lower TF & Directional Coloring
This section relates to how the script calculates and uses Volume Delta (difference between buying and selling volume) from a lower timeframe.
Use custom timeframe: (Checkbox) Check this to manually specify the lower timeframe for delta calculation. If unchecked, the script automatically selects one based on your chart timeframe (e.g., 1min for intraday charts, 60min for daily charts).
Timeframe: (Dropdown) Select the specific lower timeframe (e.g., "1", "5", "60") if "Use custom timeframe" is checked. Note: Higher timeframes provide more history but less granular delta.
Show Up/Down/Δ Info on Labels: (Checkbox) If checked, adds detailed Up Volume, Down Volume, and Delta values to the text labels shown with the volume bubbles.
Color Bubbles by Delta Direction: (Checkbox) If checked, colors the volume bubbles green for positive delta (more buying volume) and red for negative delta (more selling volume) on that bar. Uses the "Bubble Base Color" otherwise.
Up Δ / Down Δ: (Color Pickers) Sets the specific green and red colors used for directional bubble coloring.
3. Delta Divergence Signals
This section identifies and displays potential delta divergences (when price movement and volume delta disagree).
Show Delta Divergence: (Checkbox) Turns the divergence signal triangles (▲▼) on or off.
Threshold Type: (Dropdown: Absolute/Normalized)
Absolute: Uses a fixed minimum delta value ("Absolute Δ Value") to qualify a divergence. Requires knowledge of typical delta values for the asset.
Normalized: Uses a dynamic threshold calculated as a multiple ("Avg Delta Multiplier") of the recent average absolute delta ("Avg Delta Lookback"). Adapts better between different assets and volatility.
Absolute Δ Value: (Number) The fixed delta value threshold used if "Threshold Type" is "Absolute".
Avg Delta Lookback: (Number) The number of bars used to calculate the average absolute delta for the "Normalized" threshold.
Avg Delta Multiplier: (Number) The multiplier applied to the average absolute delta to set the threshold for the "Normalized" type.
Show Borderline Signals: (Checkbox) If checked, shows weaker potential divergences that meet the "% of Threshold" but not the main threshold. These appear smaller and more transparent.
% of Threshold: (Number) The minimum percentage of the main threshold a borderline signal must meet (e.g., 70%).
Bullish Color / Bearish Color: (Color Pickers) Sets the colors for the bullish (▲) and bearish (▼) divergence triangles.
Plot Bearish Divergence Below Bar: (Checkbox) If checked, bearish triangles (▼) appear below the price bar, like bullish ones. If unchecked (default), they appear above the price bar.
Dynamic Size: (Checkbox) If checked, the size of the divergence triangle scales based on how much the absolute delta exceeds the threshold (using Weak/Moderate/Strong multipliers). If unchecked, uses the fixed "Base Size".
Base Size: (Number) Sets the fixed size for divergence triangles when "Dynamic Size" is off, or the smallest size used when "Dynamic Size" is on. (Maps to Tiny, Small, etc.).
Show Magnitude Value: (Checkbox) If checked, displays the actual absolute delta value numerically below the divergence triangle.
Weak/Moderate/Strong Thresh. Mult.: (Numbers) Multipliers of the calculated threshold used to determine the different size tiers (Normal, Large, Huge) when "Dynamic Size" is enabled.
4. Support & Resistance Levels
This section draws potential Support and Resistance levels based on significant delta imbalances within a bar. Note: This feature is primarily designed for intraday timeframes and may not produce meaningful results on Daily or higher timeframes due to how delta and volume are compared.
Show S/R Levels: (Checkbox) Turns the S/R lines and logic on or off.
Imbalance Threshold: (Number, 0.0-1.0) The minimum ratio of absolute delta compared to the total bar volume required to identify a potential S/R level (e.g., 0.6 means delta must be at least 60% of the bar's volume).
Max Levels: (Number) The maximum number of support lines and resistance lines to display simultaneously. Oldest lines are removed first (FIFO).
Extend Lines: (Checkbox) If checked, draws S/R lines extending to the right edge of the chart. If unchecked, lines are short.
Show Price/Touch Labels: (Checkbox) Displays labels on the S/R lines showing the price level and the number of times price has touched the level (e.g., "Sup 105.50 (T:4)").
Label Size: (Number) Controls the size of the S/R labels (maps to Tiny, Small, etc.).
Merge Distance (ATR): (Number) If a new potential S/R level forms within this distance (measured in ATRs) of an existing level of the same type, the new level is merged into the existing one (increasing its touch count) instead of drawing a new line. Helps create zones and reduce noise.
Touch Distance (ATR): (Number) How close the bar's high/low needs to get to an existing level (in ATRs) to register as a "touch", increasing the level's strength count.
Min Touches for Thick Line: (Number) The minimum number of touches required for an S/R line to be drawn thicker and less transparent, highlighting stronger levels.
Max Line Age (Bars): (Number) If "Enable Line Aging" is checked, S/R lines that have not been touched for this number of bars will be automatically removed.
Enable Line Aging/Removal: (Checkbox) Turns the automatic removal of old, untouched S/R lines on or off.
Support Color / Width / Style: (Color Picker, Number, Dropdown) Controls the appearance of Support lines.
Resistance Color / Width / Style: (Color Picker, Number, Dropdown) Controls the appearance of Resistance lines.
5. VWAP & Bands
This section controls the Volume-Weighted Average Price (VWAP) and its standard deviation bands.
VWAP Source: (Dropdown) Selects the price source used for VWAP calculation (e.g., hl2, hlc3, close).
Show VWAP: (Checkbox) Turns the main VWAP line on or off.
Anchor: (Dropdown: Session, Week, Month, Year) Determines when the VWAP calculation resets.
VWAP Color / Width / Style: (Color Picker, Number, Dropdown) Controls the appearance of the main VWAP line.
Show Bands: (Checkbox) Turns the standard deviation bands around the VWAP on or off.
StdDev Multiplier: (Number) The multiplier applied to the standard deviation calculation to determine the distance of the bands from the VWAP line.
Number of Bands: (Number, 1-4) How many pairs of upper and lower standard deviation bands to display.
Bands Color / Width / Style: (Color Picker, Number, Dropdown) Controls the appearance of the VWAP bands.
Important Notes
S/R on Higher Timeframes: The Support/Resistance level calculation compares lower-timeframe delta to the chart's bar volume. This comparison is less meaningful on Daily or higher timeframes. It is recommended to disable "Show S/R Levels" on these higher timeframes.
Data Requirements: The indicator requires volume data to function correctly. Some features (Delta Divergence, S/R, Directional Coloring) also depend on lower timeframe data, which might take a moment to load when the indicator is first added or the timeframe is changed.
功能和设置
指标设置按组进行组织:
1. 气泡 & 成交量标签 (Bubbles & Volume Labels)
此部分控制直接在价格 K 线上显示的成交量气泡。
Show Bubbles (显示气泡): (复选框) 打开或关闭成交量气泡。
Threshold (阈值): (数字) 设置标准化成交量水平(当前成交量 / 平均成交量),达到此水平气泡才开始增大。值越高意味着只有相对更高的成交量 K 线才会显示更大的气泡。
Bubble Base Color (气泡基础颜色): (颜色选择器) 如果关闭了“按 Delta 方向为气泡着色”,则设置气泡的默认颜色。
Volume Label Size (成交量标签大小): (数字) 控制气泡附带显示的文本标签的大小(映射到 Tiny、Small、Normal 等尺寸)。
Show Labels on Tiny/Small/Normal/Large/Huge Bubbles (在...气泡上显示标签): (复选框) 根据计算出的气泡大小,单独控制是否显示成交量/Delta 文本标签。有助于减少较小成交量 K 线的混乱。
2. 低时间周期 & 方向着色 (Lower TF & Directional Coloring)
此部分涉及脚本如何从较低的时间周期计算和使用 Delta 值(买入量和卖出量之间的差额)。
Use custom timeframe (使用自定义时间周期): (复选框) 选中此项可手动指定用于 Delta 计算的较低时间周期。如果未选中,脚本会根据您的图表时间周期自动选择一个(例如,日内图表为 1 分钟,日线图为 60 分钟)。
Timeframe (时间周期): (下拉菜单) 如果选中了“使用自定义时间周期”,则选择具体的较低时间周期(例如,“1”、“5”、“60”)。注意:较高的时间周期提供更多历史数据,但 Delta 值粒度较粗。
Show Up/Down/Δ Info on Labels (在标签上显示买/卖/Δ 信息): (复选框) 如果选中,则在成交量气泡附带的文本标签中添加详细的买入量、卖出量和 Delta 值。
Color Bubbles by Delta Direction (按 Delta 方向为气泡着色): (复选框) 如果选中,则根据该 K 线的 Delta 值正负为成交量气泡着色:正 Delta(更多买入量)为绿色,负 Delta(更多卖出量)为红色。否则使用“气泡基础颜色”。
Up Δ (上涨 Δ) / Down Δ (下跌 Δ): (颜色选择器) 设置用于方向性气泡着色的具体绿色和红色。
3. Delta 背离信号 (Delta Divergence Signals)
此部分识别并显示潜在的 Delta 背离(当价格走势与成交量 Delta 不一致时)。
Show Delta Divergence (显示 Delta 背离): (复选框) 打开或关闭背离信号三角形 (▲▼)。
Threshold Type (阈值类型): (下拉菜单: Absolute/绝对值, Normalized/标准化)
Absolute (绝对值): 使用固定的最小 Delta 值 ("Absolute Δ Value") 来确认背离资格。需要了解资产的典型 Delta 值。
Normalized (标准化): 使用动态阈值,该阈值计算为近期平均绝对 Delta 值 ("Avg Delta Lookback") 的倍数 ("Avg Delta Multiplier")。能更好地适应不同资产和波动性。
Absolute Δ Value (绝对 Δ 值): (数字) 如果“阈值类型”为“绝对值”,则使用此固定的 Delta 值阈值。
Avg Delta Lookback (平均 Delta 回看期): (数字) 用于计算“标准化”阈值的平均绝对 Delta 值的 K 线数量。
Avg Delta Multiplier (平均 Delta 乘数): (数字) 应用于平均绝对 Delta 值以设置“标准化”类型阈值的乘数。
Show Borderline Signals (显示临界信号): (复选框) 如果选中,则显示满足“阈值的百分比”但未达到主阈值的较弱潜在背离。这些信号显示得更小、更透明。
% of Threshold (阈值的百分比): (数字) 临界信号必须满足的主阈值的最低百分比(例如 70%)。
Bullish Color (看涨颜色) / Bearish Color (看跌颜色): (颜色选择器) 设置看涨 (▲) 和看跌 (▼) 背离三角形的颜色。
Plot Bearish Divergence Below Bar (在 K 线下方绘制看跌背离): (复选框) 如果选中,看跌三角形 (▼) 将像看涨三角形一样出现在 K 线下方。如果未选中(默认),它们出现在 K 线之上。
Dynamic Size (动态大小): (复选框) 如果选中,背离三角形的大小将根据绝对 Delta 值超过阈值的程度进行缩放(使用弱/中/强乘数)。如果未选中,则使用固定的“基础大小”。
Base Size (基础大小): (数字) 设置关闭“动态大小”时背离三角形的固定大小,或启用“动态大小”时使用的最小大小。(映射到 Tiny、Small 等尺寸)。
Show Magnitude Value (显示量级值): (复选框) 如果选中,则在背离三角形下方以数字形式显示实际的绝对 Delta 值。
Weak/Moderate/Strong Thresh. Mult. (弱/中/强阈值乘数): (数字) 启用“动态大小”时,用于确定不同大小等级(Normal、Large、Huge)的计算阈值的乘数。
4. 支撑/阻力位 (Support & Resistance Levels)
此部分根据 K 线内的显著 Delta 不平衡绘制潜在的支撑位和阻力位。注意:此功能主要为日内时间周期设计,在日线或更高时间周期上可能无法产生有意义的结果,因为 Delta 和成交量的比较方式不同。
Show S/R Levels (显示 S/R 位): (复选框) 打开或关闭 S/R 线条和逻辑。
Imbalance Threshold (不平衡阈值): (数字, 0.0-1.0) 识别潜在 S/R 位所需的绝对 Delta 与总 K 线成交量的最小比率(例如,0.6 表示 Delta 必须至少是 K 线成交量的 60%)。
Max Levels (最大层级数): (数字) 同时显示的最大支撑线和阻力线的数量。最旧的线将首先被移除 (FIFO)。
Extend Lines (延长线条): (复选框) 如果选中,则绘制延伸至图表右边缘的 S/R 线。如果未选中,线条较短。
Show Price/Touch Labels (显示价格/触摸标签): (复选框) 在 S/R 线上显示标签,标明价格水平和价格触及该水平的次数(例如,“Sup 105.50 (T:4)”)。
Label Size (标签大小): (数字) 控制 S/R 标签的大小(映射到 Tiny、Small 等尺寸)。
Merge Distance (ATR) (合并距离 (ATR)): (数字) 如果一个新的潜在 S/R 位在现有同类型水平的此距离(以 ATR 为单位)内形成,则新水平将合并到现有水平中(增加其触摸次数),而不是绘制新线。有助于形成区域并减少噪音。
Touch Distance (ATR) (触摸距离 (ATR)): (数字) K 线的最高/最低价需要多接近现有水平(以 ATR 为单位)才能计为一次“触摸”,从而增加该水平的强度计数。
Min Touches for Thick Line (加粗线条的最小触摸次数): (数字) S/R 线条需要达到此最小触摸次数才能绘制得更粗、更不透明,以突出显示更强的水平。
Max Line Age (Bars) (线条最大存在 K 线数): (数字) 如果选中了“启用线条老化”,则在此 K 线数内未被触及的 S/R 线将被自动移除。
Enable Line Aging/Removal (启用线条老化/移除): (复选框) 打开或关闭旧的、未触及的 S/R 线的自动移除功能。
Support Color / Width / Style (支撑线颜色 / 宽度 / 样式): (颜色选择器, 数字, 下拉菜单) 控制支撑线的外观。
Resistance Color / Width / Style (阻力线颜色 / 宽度 / 样式): (颜色选择器, 数字, 下拉菜单) 控制阻力线的外观。
5. VWAP & Bands (成交量加权平均价 & 通道)
此部分控制成交量加权平均价 (VWAP) 及其标准差通道。
VWAP Source (VWAP 源): (下拉菜单) 选择用于 VWAP 计算的价格源(例如,hl2, hlc3, close)。
Show VWAP (显示 VWAP): (复选框) 打开或关闭主 VWAP 线。
Anchor (锚定周期): (下拉菜单: Session/时段, Week/周, Month/月, Year/年) 决定 VWAP 计算何时重置。
VWAP Color / Width / Style (VWAP 颜色 / 宽度 / 样式): (颜色选择器, 数字, 下拉菜单) 控制主 VWAP 线的外观。
Show Bands (显示通道): (复选框) 打开或关闭 VWAP 周围的标准差通道。
StdDev Multiplier (标准差乘数): (数字) 应用于标准差计算的乘数,以确定通道与 VWAP 线的距离。
Number of Bands (通道数量): (数字, 1-4) 显示多少对上、下标准差通道。
Bands Color / Width / Style (通道颜色 / 宽度 / 样式): (颜色选择器, 数字, 下拉菜单) 控制 VWAP 通道的外观。
重要提示
高时间周期上的 S/R: 支撑/阻力位的计算将较低时间周期的 Delta 与图表 K 线的成交量进行比较。这种比较在日线或更高时间周期上的意义不大。建议在这些较高时间周期上禁用“显示 S/R 位”。
数据要求: 该指标需要成交量数据才能正常工作。某些功能(Delta 背离、S/R、方向着色)还依赖于较低时间周期的数据,当首次添加指标或更改时间周期时,可能需要一些时间来加载这些数据。

Bubbles Volume Delta V2English Version
Introduction
Bubbles Volume Delta V2 is an advanced volume analysis indicator for TradingView that visualizes trading volume as bubbles on your chart. It combines volume visualization with delta analysis, support/resistance detection, and VWAP (Volume-Weighted Average Price) to provide comprehensive volume insights for more informed trading decisions.
Key Features
Volume Bubbles: Displays volume as differently sized bubbles at price levels
Up/Down Volume Analysis: Analyzes buying vs selling pressure using lower timeframe data
Delta Divergence Detection: Identifies when price direction contradicts volume delta
Support/Resistance Levels: Automatically detects potential support/resistance based on volume imbalance
VWAP Integration: Displays VWAP with customizable anchoring and deviation bands
Setup Instructions
Add the indicator to your chart from the Indicators & Strategies menu
Adjust settings in the various sections according to your preferences
Verify that your chart has volume data available (some symbols may not provide volume)
Settings Guide
Bubbles Volume Settings
Show Bubbles: Toggle bubble visualization on/off
Threshold: Minimum normalized volume to display bubbles (lower = more bubbles)
Bubble Color: Default color for volume bubbles
Volume Label Size: Size of text labels showing volume information
Label Display Options: Control which bubble sizes display text labels
Delta Divergence Settings
Show Delta Divergence: Toggle divergence detection on/off
Delta Significance (%): Minimum percentage for significant delta
Bullish/Bearish Signal: Colors for divergence signals
Dynamic Triangle Size: Scale triangle size based on divergence magnitude
Divergence Thresholds: Configure levels for weak, moderate, and strong divergence signals
Support/Resistance Settings
Show Support/Resistance Levels: Toggle display of S/R levels
Imbalance Threshold: Required imbalance ratio for level detection
Max Levels to Display: Limit the number of lines shown
Extend Lines to Right: Continue lines to the right edge of the chart
Support/Resistance Colors and Styles: Visual appearance customization
Up/Down Volume Settings
Use Custom Timeframe: Override automatic timeframe selection
Show Up/Down Info: Display buying/selling volume breakdown on bubbles
Color Bubbles by Direction: Use green/red based on delta direction
VWAP Settings
Show VWAP: Toggle VWAP line display
VWAP Anchor: Choose when VWAP calculations reset (Session/Week/Month/Year)
Show VWAP Bands: Display standard deviation bands around VWAP
Bands Multiplier: Adjust the width of deviation bands
Number of Bands: How many deviation bands to display (1-4)
Line Style Settings: Customize colors, widths, and styles
How to Interpret the Indicator
Volume Bubbles
Size: Larger bubbles indicate higher relative volume
Color: Green indicates buying pressure, red indicates selling pressure
Labels: Show precise volume figures and up/down breakdown
Divergence Signals
▲ (Blue Triangle): Bullish divergence - price moving down but buying pressure detected
▼ (Red Triangle): Bearish divergence - price moving up but selling pressure detected
Triangle Size: Larger triangles indicate stronger divergence
Support/Resistance Lines
Green Lines: Support levels with buying pressure
Red Lines: Resistance levels with selling pressure
Percentage Labels: Show the imbalance ratio strength
VWAP
Main Line: Average price weighted by volume
Bands: Standard deviation ranges showing potential support/resistance zones
Best Practices
Use on liquid markets with reliable volume data
Combine with price action analysis for confirmation
Adjust thresholds based on the specific market's volatility
Use lower timeframes for short-term trading and higher timeframes for swing trading
Pay attention to divergences at key price levels
Troubleshooting
No Volume Data: Ensure your selected symbol provides volume information
Missing Up/Down Volume: Some exchanges or symbols may not provide lower timeframe data
Performance Issues: Reduce the number of displayed levels or use larger timeframes
中文版本
介绍
Bubbles Volume Delta V2 是一个高级交易量分析指标,用于 TradingView 平台,将交易量以气泡形式直观显示在图表上。它结合了交易量可视化、Delta分析、支撑/阻力检测和 VWAP(成交量加权平均价格),为您提供全面的交易量洞察,帮助做出更明智的交易决策。
主要功能
交易量气泡:在价格水平上显示不同大小的交易量气泡
上涨/下跌交易量分析:使用低时间周期数据分析买卖压力
Delta 背离检测:识别价格方向与交易量 Delta 相矛盾的情况
支撑/阻力水平:根据交易量不平衡自动检测潜在支撑/阻力位
VWAP 集成:显示可自定义锚点和偏差带的 VWAP
设置指南
从指标与策略菜单将指标添加到您的图表
根据您的偏好调整各部分设置
确认您的图表有可用的交易量数据(某些交易品种可能不提供交易量)
设置指南
交易量气泡设置
显示气泡:开启/关闭气泡可视化
阈值:显示气泡的最小归一化交易量(越低 = 越多气泡)
气泡颜色:交易量气泡的默认颜色
交易量标签大小:显示交易量信息的文本标签大小
标签显示选项:控制哪些气泡大小显示文本标签
Delta 背离设置
显示 Delta 背离:开启/关闭背离检测
Delta 显著性 (%):显著 Delta 的最小百分比
看涨/看跌信号:背离信号的颜色
动态三角形大小:根据背离幅度调整三角形大小
背离阈值:配置弱、中等和强背离信号的水平
支撑/阻力设置
显示支撑/阻力水平:开启/关闭支撑/阻力水平显示
不平衡阈值:水平检测所需的不平衡比率
最大显示水平数:限制显示的线条数量
向右延伸线条:线条延伸至图表右侧边缘
支撑/阻力颜色和样式:视觉外观自定义
上涨/下跌交易量设置
使用自定义时间周期:覆盖自动时间周期选择
显示上涨/下跌信息:在气泡上显示买卖交易量细分
按方向着色气泡:根据 Delta 方向使用绿色/红色
VWAP 设置
显示 VWAP:开启/关闭 VWAP 线显示
VWAP 锚点:选择 VWAP 计算何时重置(盘中/周/月/年)
显示 VWAP 带:显示 VWAP 周围的标准偏差带
带乘数:调整偏差带的宽度
带数量:显示多少条偏差带(1-4)
线条样式设置:自定义颜色、宽度和样式
如何解读指标
交易量气泡
大小:更大的气泡表示更高的相对交易量
颜色:绿色表示买入压力,红色表示卖出压力
标签:显示精确的交易量数字和上涨/下跌细分
背离信号
▲(蓝色三角形):看涨背离 - 价格下移但检测到买入压力
▼(红色三角形):看跌背离 - 价格上移但检测到卖出压力
三角形大小:更大的三角形表示更强的背离
支撑/阻力线
绿线:有买入压力的支撑位
红线:有卖出压力的阻力位
百分比标签:显示不平衡比率强度
VWAP
主线:按交易量加权的平均价格
带:显示潜在支撑/阻力区域的标准偏差范围
最佳实践
在具有可靠交易量数据的流动性市场上使用
结合价格动作分析进行确认
根据特定市场的波动性调整阈值
短期交易使用低时间周期,摇摆交易使用高时间周期
注意关键价格水平的背离
故障排除
无交易量数据:确保您选择的交易品种提供交易量信息
缺少上涨/下跌交易量:某些交易所或交易品种可能不提供低时间周期数据
性能问题:减少显示的水平数量或使用更大的时间周期

Cumulative Volume Delta (CVD) Divergence - Non-Repainting v2Okay, here is the Pine Script code for the Cumulative Volume Delta (CVD) Divergence indicator. This script calculates CVD using an HLCV approximation, identifies potential regular and hidden divergences based on confirmed pivot points, and includes alert conditions. It is designed to be non-repainting for historical signals.

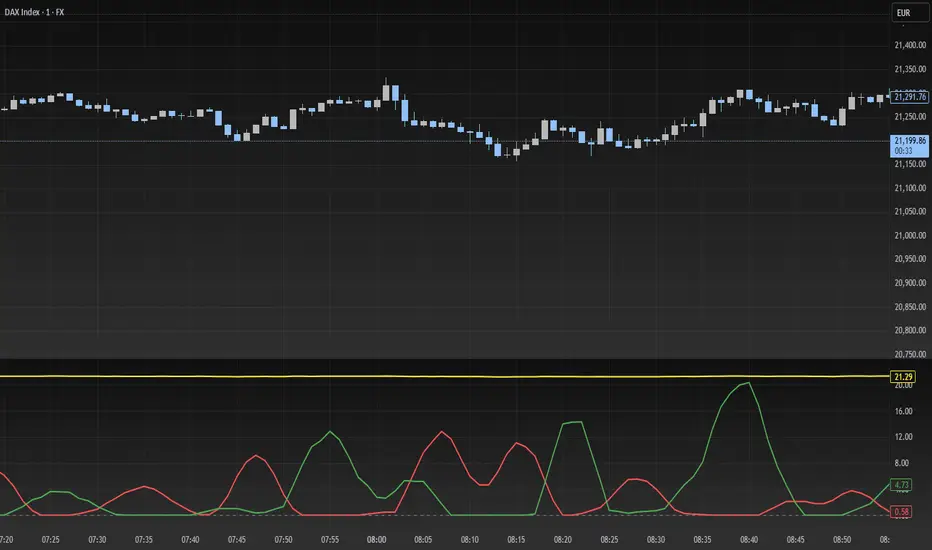
Puts vs Longs vs Price Oscillator SwiftEdgeWhat is this Indicator?
The "Low-Latency Puts vs Longs vs Price Oscillator" is a custom technical indicator built for TradingView to help traders visualize buying and selling activity in a market without access to order book data. It displays three lines in an oscillator below the price chart:
Green Line (Longs): Represents the strength of buying activity (bullish pressure).
Red Line (Puts): Represents the strength of selling activity (bearish pressure).
Yellow Line (Price): Shows the asset’s price in a scaled format for direct comparison.
The indicator uses price movements, volume, and momentum to estimate when buyers or sellers are active, providing a quick snapshot of market dynamics. It’s optimized for fast response to price changes (low latency), making it useful for both short-term and longer-term trading strategies.
How Does it Work?
Since TradingView doesn’t provide direct access to order book data (which shows real-time buy and sell orders), this indicator approximates buying and selling pressure using commonly available data: price, volume, and a momentum measure called Rate of Change (ROC). Here’s how it combines these elements:
Price Movement: The indicator checks if the price is rising or falling compared to the previous candlestick. A rising price suggests buying (longs), while a falling price suggests selling (puts).
Volume: Volume acts as a "weight" to measure the strength of these price moves. Higher volume during a price increase boosts the green line, while higher volume during a price decrease boosts the red line. This mimics how large orders in an order book would influence the market.
Rate of Change (ROC): ROC measures how fast the price is changing over a set period (e.g., 5 candlesticks). It adds a momentum filter—strong upward momentum reinforces buying signals, while strong downward momentum reinforces selling signals.
These components are calculated for each candlestick and summed over a short lookback period (e.g., 5 candlesticks) to create the green and red lines. The yellow line is simply the asset’s closing price scaled down to fit the oscillator’s range, allowing you to compare buying/selling strength directly with price action.
Why Combine These Elements?
The combination of price, volume, and ROC is intentional and synergistic:
Price alone isn’t enough—it tells you what happened but not how strong the move was.
Volume adds context by showing the intensity behind price changes, much like how order book volume indicates real buying or selling interest.
ROC ensures the indicator captures momentum, filtering out weak or random price moves and focusing on significant trends, similar to how aggressive order execution might appear in an order book.
Together, they create a balanced picture of market activity that’s more reliable than any single factor alone. The goal is to simulate the insights you’d get from an order book—where you’d see buy/sell imbalances—using data available in TradingView.
How to Use It
Setup:
Add the indicator to your chart via TradingView’s Pine Editor by copying and pasting the script.
Adjust the inputs to suit your trading style:
Lookback Period: Number of candlesticks (default 5) to sum buying/selling activity. Shorter = more responsive; longer = smoother.
Price Scale Factor: Scales the yellow price line (default 0.001). Increase for high-priced assets (e.g., 0.01 for indices like DAX) or decrease for low-priced ones (e.g., 0.0001 for crypto).
ROC Period: Candlesticks for momentum calculation (default 5). Shorter = faster response.
ROC Weight: How much momentum affects the signal (default 0.5). Higher = stronger momentum influence.
Volume Threshold: Minimum volume multiplier (default 1.5) to boost signals during high activity.
Reading the Oscillator:
Green Line Above Yellow: Strong buying pressure—price is rising with volume and momentum support. Consider this a bullish signal.
Red Line Above Yellow: Strong selling pressure—price is falling with volume and momentum support. Consider this a bearish signal.
Green/Red Crossovers: When the green line crosses above the red, it suggests buyers are taking control. When the red crosses above the green, sellers may be dominating.
Yellow Line Context: Compare green/red lines to the yellow price line to see if buying/selling strength aligns with price trends.
Trading Examples:
Bullish Setup: Green line spikes above yellow after a price breakout with high volume (e.g., DAX opening jump). Enter a long position if confirmed by other indicators.
Bearish Setup: Red line rises above yellow during a price drop with increasing volume. Look for a short opportunity.
Reversal Warning: If the green line stays high while price (yellow) flattens or drops, it could signal overbought conditions—be cautious.
What Makes It Unique?
Unlike traditional oscillators like RSI or MACD, which focus solely on price momentum or trends, this indicator blends price, volume, and momentum into a three-line system that mimics order book dynamics. Its low-latency design (short lookback and no heavy smoothing) makes it react quickly to market shifts, ideal for volatile markets like DAX or forex. The visual separation of buying (green) and selling (red) against price (yellow) offers a clear, intuitive way to spot imbalances without needing complex data.
Tips and Customization
Volatile Markets: Use a shorter lookback (e.g., 3) and ROC period (e.g., 3) for faster signals.
Stable Markets: Increase lookback (e.g., 10) for smoother, less noisy lines.
Scaling: If the green/red lines dwarf the yellow, adjust Price Scale Factor up (e.g., 0.01) to balance them.
Experiment: Test on your asset (stocks, crypto, indices) and tweak inputs to match its behavior.
Intraday Macro & Flow Indicator# IntraMacroFlow Indicator
## Introduction
IntraMacroFlow is a volume and delta-based indicator that identifies significant price movements within trading sessions. It generates signals when volume spikes coincide with quality price movement, filtered by RSI to avoid overbought/oversold conditions.
> **Note:** This indicator provides multiple signals and should be combined with additional analysis methods such as support/resistance, trend direction, and price action patterns.
## Inputs
### Volume Settings
* **Volume Lookback Period** (14) - Number of bars for volume moving average calculation
* **Volume Threshold Multiplier** (1.5) - Required volume increase over average to generate signals
* **Delta Threshold** (0.3) - Required close-to-open movement relative to bar range (higher = stronger movement)
### Session Configuration
* **Use Dynamic Session Detection** (true) - Automatically determine session times
* **Highlight Market Open Period** (true) - Highlight first third of trading session
* **Highlight Mid-Session Period** (true) - Highlight middle portion of trading session
* **Detect Signals Throughout Whole Session** (true) - Find signals in entire session
* **Session Time** ("0930-1600") - Trading hours in HHMM-HHMM format
* **Session Type** ("Regular") - Select Regular, Extended, or Custom session
### Manual Session Settings
Used when dynamic detection is disabled:
* **Manual Session Open Hour** (9)
* **Manual Session Open Minute** (30)
* **Manual Session Open Duration** (60)
* **Manual Mid-Session Start Hour** (12)
* **Manual Mid-Session End Hour** (14)
## How It Works
The indicator analyzes each bar using three primary conditions:
1. **Volume Condition**: Current volume > Average volume × Threshold
2. **Delta Condition**: |Close-Open|/Range > Delta threshold
3. **Time Condition**: Bar falls within configured session times
When all conditions are met:
* Bullish signals appear when close > open and RSI < 70
* Bearish signals appear when close < open and RSI > 30
## Display Elements
### Shapes and Colors
* Green triangles below bars - Bullish signals
* Red triangles above bars - Bearish signals
* Blue background - Market open period
* Purple background - Mid-session period
* Bar coloring - Green (bullish), Red (bearish), or unchanged
### Information Panel
A dynamic label shows:
* Current volume relative to average (Vol)
* Delta value for current bar (Delta)
* RSI value (RSI)
* Session status (Active/Closed)
## Calculation Method
```
// Volume Condition
volumeMA = ta.sma(volume, lookbackPeriod)
volumeCondition = volume > volumeMA * volumeThreshold
// Delta Calculation (price movement quality)
priceRange = high - low
delta = math.abs(close - open) / priceRange
deltaCondition = delta > deltaThreshold
// Direction and RSI Filter
bullishBias = close > open and entrySignal and not (rsi > 70)
bearishBias = close < open and entrySignal and not (rsi < 30)
```
## Usage Recommendations
### Suitable Markets
* Equities during regular trading hours
* Futures markets
* Forex during active sessions
* Cryptocurrencies with defined volume patterns
### Recommended Timeframes
* 1-minute to 1-hour (optimal: 5 or 15-minute)
### Parameter Adjustments
* For fewer but stronger signals: increase Volume Threshold (2.0+) and Delta Threshold (0.4-0.6)
* For more signals: decrease Volume Threshold (1.2-1.5) and Delta Threshold (0.2-0.3)
### Usage Tips
* Combine with trend analysis for higher-probability entries
* Focus on signals occurring at session boundaries and mid-session
* Use opposite signals as potential exit points
* Configure alerts to receive notifications when signals occur
## Additional Notes
* RSI parameters are fixed at 14 periods with 70/30 thresholds
* The indicator handles overnight sessions correctly
* Fully compatible with TradingView alerts
* Customizable visual elements
## Release Notes
Initial release: This is a template indicator that should be customized to suit your specific trading strategies and preferences.

Order Block Candle [TradeWithRon]Order Block Candle
This indicator is designed to help traders identify and visualize key movements within the market. These order blocks are areas where significant buying or selling has occurred, often leading to a strong price reaction. This script detects both bullish and bearish order blocks (with volume spike), marking them directly on your chart, and offers a variety of customization options to enhance your trading experience.
Features:
Bullish and Bearish Candles: Bullish Order Block: Identified when the current price creates a higher high and closes above the previous price, indicating a zone of potential buying activity by institutional traders.
Bearish Order Block: Identified when the current price creates a lower low and closes below the previous price, suggesting strong institutional selling.
Volume-Weighted Analysis: The indicator allows traders to incorporate volume into the order block detection. When a volume pivot (a significant change in volume) is detected, it strengthens the validity of the identified order block.
Customizable Visuals:
- Users can adjust the color and style of order block lines, including solid, dashed, or dotted styles, to suit personal preferences.
- Bullish Order Block Color: Choose from a range of colors to highlight bullish order blocks (default is green).
- Bearish Order Block Color: Choose a color for bearish order blocks (default is red).
- Users can also customize the color and style of the lines representing order blocks, helping traders visually track key levels.
Candle Body or. Wick: The indicator provides flexibility in defining the price range of the order block. Traders can choose whether to calculate the order block using the candle body (open and close) or the full wick (high and low) to suit their trading strategy.
Dynamic Line Extensions: Order block lines are dynamically extended to provide ongoing support and resistance levels. When a price breaks an order block line, the line changes to a dotted style, marking it as "broken." This allows traders to easily spot when the market invalidates an order block.
Alerts:
- Alert for Bullish Order Block: Get notified when a new bullish order block is detected.
- Alert for Bearish Order Block: Receive alerts when a bearish order block is identified.
- Alert for Broken Lines: Set up alerts to be notified when a bullish or bearish order block line is broken, giving traders a signal for potential market shifts.
Zone Management:
- The indicator tracks upper and lower zone information, marking significant price levels where institutional buying or selling might occur. Traders can adjust settings to define how many previous lines should be displayed on the chart for reference.
Optional Mitigated Order Blocks:
- A feature that highlights mitigated (neutralized) order blocks with a specific color and line style, offering additional insight into market behavior.
Input Settings:
- Length: The number of bars to the left and right of a pivot point for it to be considered a high or low.
- Candle Body: Option to use the candle body for calculations (as opposed to the wick).
- Bullish and Bearish Candle Color: Customizable colors for bullish and bearish order blocks.
- Open Line Style: Choose between solid, dashed, or dotted line styles for order block visualization.
- Removed Old Lines: Control the number of broken lines shown on the chart.
- Mitigated Line Style: Select line style for mitigated order blocks.
- Volume Use: Enable volume-based detection for stronger order block validation.
How to Use:
This indicator is ideal for traders looking to trade around institutional support and resistance levels. The bullish and bearish order blocks can serve as key entry or exit points, while broken lines offer dynamic support/resistance that adapt to market changes. Use the alerts to stay informed of critical market developments and adjust your trading strategy accordingly.
🔶 Disclaimer
Use with Caution: This indicator is provided for educational and informational purposes only and should not be considered as financial advice. Users should exercise caution and perform their own analysis before making trading decisions based on the indicator's signals.
Not Financial Advice: The information provided by this indicator does not constitute financial advice, and the creator (Tradewithron) shall not be held responsible for any trading losses incurred as a result of using this indicator.
Backtesting Recommended: Traders are encouraged to backtest the indicator thoroughly on historical data before using it in live trading to assess its performance and suitability for their trading strategies.
Risk Management: Trading involves inherent risks, and users should implement proper risk management strategies, including but not limited to stop-loss orders and position sizing, to mitigate potential losses.
No Guarantees: The accuracy and reliability of the indicator's signals cannot be guaranteed, as they are based on historical price data and past performance may not be indicative of future

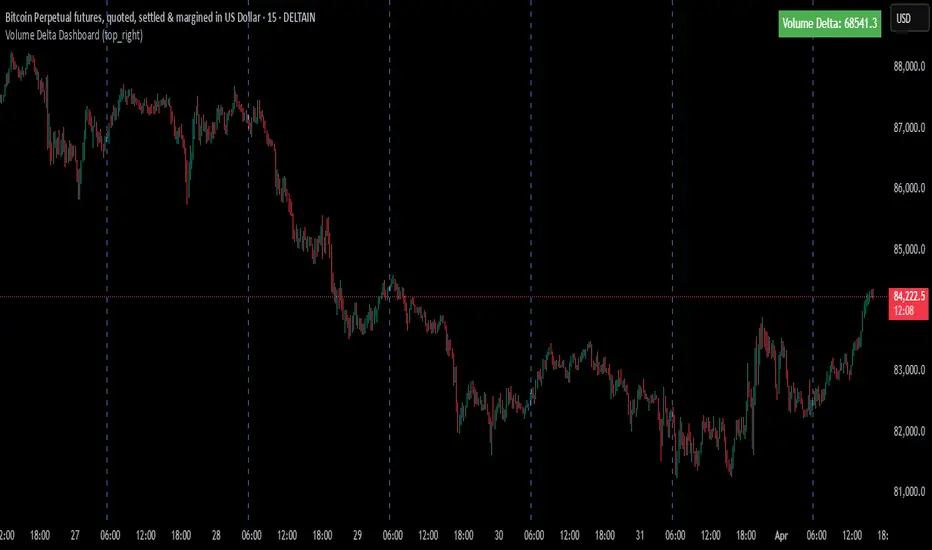
Volume Delta DashboardHow It Works:
This script creates a Volume Delta Dashboard on TradingView, which helps traders visualize the balance between buying and selling volume (Volume Delta) directly on the chart. Here's a breakdown of the key components:
Volume Delta Calculation:
The script calculates the Volume Delta by comparing the volume of bars where the price closed higher (buying pressure) to those where the price closed lower (selling pressure).
Positive Volume Delta (green background) indicates more buying activity than selling, suggesting upward price movement. Negative Volume Delta (red background) indicates more selling than buying, signaling a potential downward move.
Smoothing with EMA:
To make the volume delta trend smoother and more consistent, an Exponential Moving Average (EMA) of the Volume Delta is used. This helps to reduce noise and highlight the prevailing buying or selling pressure over a 14-period.
Dynamic Position Selection:
The user can choose where the Volume Delta dashboard table will appear on the chart by selecting a position: top-left, top-right, bottom-left, or bottom-right. This makes the indicator adaptable to different chart setups.
Coloring:
The background of the table changes color based on the value of the Volume Delta. Green indicates a positive delta (more buyers), and Red indicates a negative delta (more sellers).
Use of This Strategy:
This Volume Delta Dashboard strategy is particularly useful for traders who want to:
Monitor Market Sentiment:
By observing the volume delta, traders can get a sense of whether there is more buying or selling pressure in the market. Positive volume delta can indicate a bullish sentiment, while negative delta can point to bearish sentiment.
Confirm Price Action:
The Volume Delta can be used alongside price action to confirm the strength of a price move. For example, if the price is moving up and the volume delta is positive, it suggests that the price increase is supported by buying pressure.
Identify Divergences:
Volume delta can help traders spot divergences between price and volume. For example, if the price is moving higher but the volume delta is negative, it may suggest a weakening trend and a potential reversal.
Optimize Entry/Exit Points:
By understanding the relationship between price movement and volume, traders can make more informed decisions about entering or exiting positions. For instance, a sudden increase in buying volume (positive delta) may indicate a good entry point for a long position.
Overall, the Volume Delta Dashboard can serve as a powerful tool for improving decision-making, by providing real-time insights into market dynamics and trading sentiment.
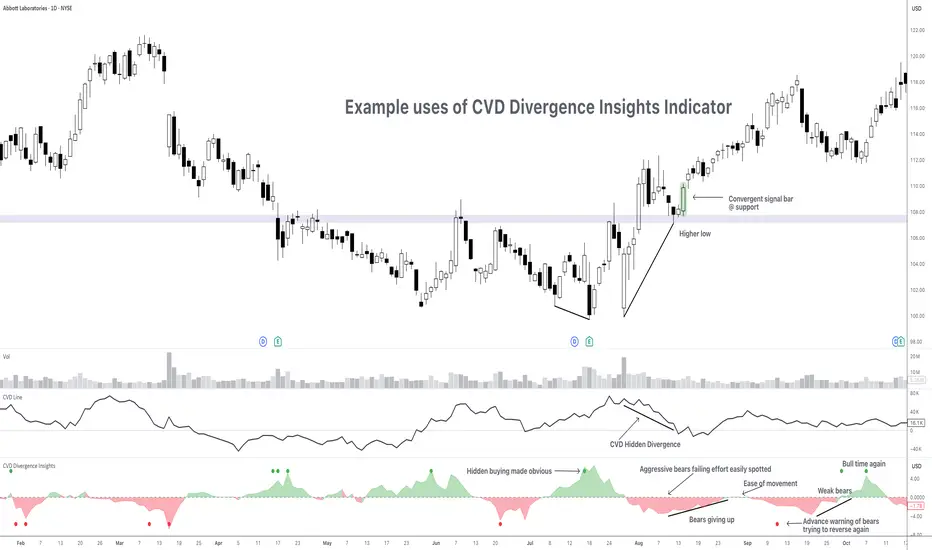
CVD Divergence Insights📘 CVD Divergence Insights – by Colicoid
Pine Script v6 | Volume Delta Divergence Oscillator with Spike Detection
⸻
🔍 Overview
CVD Divergence Insights is a volume-aware oscillator and divergence spike detector that helps you spot smart money activity, absorption, failed pressure, and hidden strength or weakness — even when price action alone gives little away.
It works by comparing normalized Cumulative Volume Delta (CVD) against normalized price movement, and optionally applying a volume-weighting layer to highlight when aggressive participation is truly behind the divergence. The result is a dynamic visual tool that identifies tension in the market, and helps you trade based on how that tension resolves.
⸻
🧠 Core Concept
• When price moves one way and CVD moves another, it reflects imbalance between aggression and result.
• Divergence is not a trigger — it’s a build-up of pressure.
• The real edge lies in the resolution of that pressure.
• Optional volume-weighting helps you ignore noise and focus on high-conviction moves only.
⸻
⚙️ How It Works
1. CVD Calculation
CVD is generated using lower-timeframe delta volume (buy vs. sell pressure), accumulated per bar.
2. Oscillator
A normalized divergence between the smoothed CVD and smoothed price.
3. Volume Weighting (optional)
Emphasizes divergences occurring on higher-than-normal volume, deprioritizes low-volume noise.
4. Signal Line (optional)
A short EMA of the oscillator to help track momentum shifts (hidden by default).
5. Divergence Spikes
Statistical spike detection using standard deviation — green/red dots highlight unusually large divergence activity.
⸻
🎛️ Inputs
Anchor Period
Higher timeframe where the CVD is accumulated and processed.
Lower Timeframe
Optional override for granularity of buy/sell volume data.
SMA Length
Used for smoothing both price and CVD before divergence is calculated.
Volume Weighted?
Enables adaptive weighting based on relative volume size.
Volume Normalization Length
Lookback period used to define what is “normal” volume.
Divergence Spike Threshold
StdDev-based threshold to detect abnormally large divergences.
Signal Line Length
Controls the EMA smoothing of the optional signal line (hidden by default).
⸻
📈 Trade Setup Example: Hidden Bullish Divergence
1. Price forms a higher low, but CVD forms a lower low — hidden bullish divergence.
2. This shows aggressive sellers are trying, but price is resilient — likely absorption.
3. You wait for a "convergent signal bar":
• A bullish candle with strong structure or body
• Confirmed by CVD starting to turn upward
4. That’s your trigger bar — the tension resolves upward.
⸻
🤝 Recommended Pairings
For best results, combine CVD Divergence Insights with the companion script:
🔗 Cumulative Volume Delta Line (also by Colicoid)
This lets you:
• See the raw CVD line and its SMA visually
• Spot standard and hidden divergences in price/CVD directly
• Use the Insights indicator to evaluate divergence quality and flag aggressive bull/bear behavior
• Use the same SMA length on both indicators for alignment
👉 Tip: To save screen space, drag the CVD Line indicator into the same panel as CVD Divergence Insights.
⸻
🧰 Why Use This?
• ✅ Catch absorption setups and failed pressure zones
• ✅ Filter out low-quality divergences using volume context
• ✅ Understand why price is hesitating or breaking out
• ✅ Add smart confirmation to breakout/reversal trades
• ✅ Align your execution with who’s actually in control
⸻
📎 Created by Colicoid
Built in Pine Script v6 for advanced price-volume analysis, with focus on effort vs result, market psychology, and smart money detection.
Volume Delta Average by Periods OscillatorVDAP Oscillator (Volume-Delta Average by Periods Oscillator) is a supercharged trading tool that helps you spot trends and assess their strength with ease! 🚀🔍 It's like a VZO on steroids—giving you an even more powerful and clear understanding of market shifts. By using the average volume delta across custom periods, it shows how market sentiment shifts, giving you a crystal-clear view of buying and selling pressures. With 12 vibrant color-coded zones, it’s like a rainbow for your charts! 🌈📊
Along with the colorful zones, this oscillator has an intuitive table that breaks down the trend, its strength, percentage, and visual rating using emojis. Whether you're a rookie or a seasoned pro, it’s designed to be ultra-accessible and easy to read! 📈✨ The table lets you see the trend's strength at a glance, so you can make quick decisions without any confusion. 🧠✅
Key Features:
✅ 12 color-coded zones for clear trend direction and strength 🌈
✅ Customizable periods to fit your analysis needs ⏳
✅ Trend strength table with easy-to-understand metrics 💪
✅ Change percentage 📉📈
✅ Emoji-based visual ratings ⭐️
✅ User-friendly interface for effortless reading 👀
✅ Accurate and efficient for better decision-making ⚡
What We're Missing:
❌ No overly complicated settings – keeping it simple, no unnecessary clutter ⚙️
❌ No complex back-testing options for deep strategy testing 📉
❌ No built-in real-time alerts for instant notifications ⏰
❌ Doesn’t overcomplicate things with endless features – it’s focused, and that’s a good thing! 🎯
In short, the VDAP Oscillator is your go-to, colorful tool for analyzing market trends quickly and accurately. Whether you're trading stocks 📉, crypto 💎, or forex 💱, this indicator will keep you in the loop and ahead of the game!

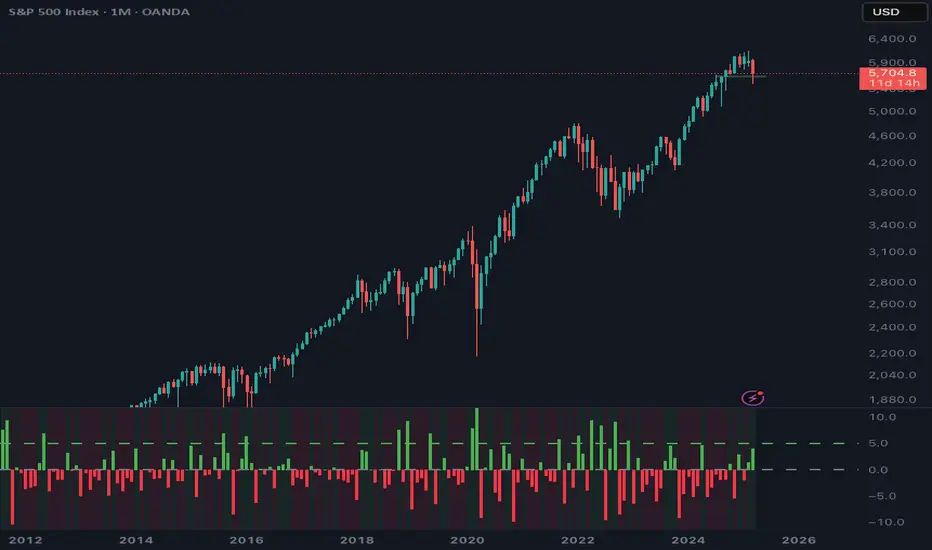
Money Flow Divergence IndicatorOverview
The Money Flow Divergence Indicator is designed to help traders and investors identify key macroeconomic turning points by analyzing the relationship between U.S. M2 money supply growth and the S&P 500 Index (SPX). By comparing these two crucial economic indicators, the script highlights periods where market liquidity is outpacing or lagging behind stock market growth, offering potential buy and sell signals based on macroeconomic trends.
How It Works
1. Data Sources
S&P 500 Index (SPX500USD): Tracks the stock market performance.
U.S. M2 Money Supply (M2SL - Federal Reserve Economic Data): Represents available liquidity in the economy.
2. Growth Rate Calculation
SPX Growth: Percentage change in the S&P 500 index over time.
M2 Growth: Percentage change in M2 money supply over time.
Growth Gap (Delta): The difference between M2 growth and SPX growth, showing whether liquidity is fueling or lagging behind market performance.
3. Visualization
A histogram displays the growth gap over time:
Green Bars: M2 growth exceeds SPX growth (potential bullish signal).
Red Bars: SPX growth exceeds M2 growth (potential bearish signal).
A zero line helps distinguish between positive and negative growth gaps.
How to Use It
✅ Bullish Signal: When green bars appear consistently, indicating that liquidity is outpacing stock market growth. This suggests a favorable environment for buying or holding positions.
❌ Bearish Signal: When red bars appear consistently, meaning stock market growth outpaces liquidity expansion, signaling potential overvaluation or a market correction.
Best Timeframes for Analysis
This indicator works best on monthly timeframes (M) since it is designed for long-term investors and macro traders who focus on broad economic cycles.
Who Should Use This Indicator?
📈 Long-term investors looking for macroeconomic trends.
📊 Swing traders who incorporate liquidity analysis in their strategies.
💰 Portfolio managers assessing market liquidity conditions.
🚀 Use this indicator to stay ahead of market trends and make informed investment decisions based on macroeconomic liquidity shifts! 🚀
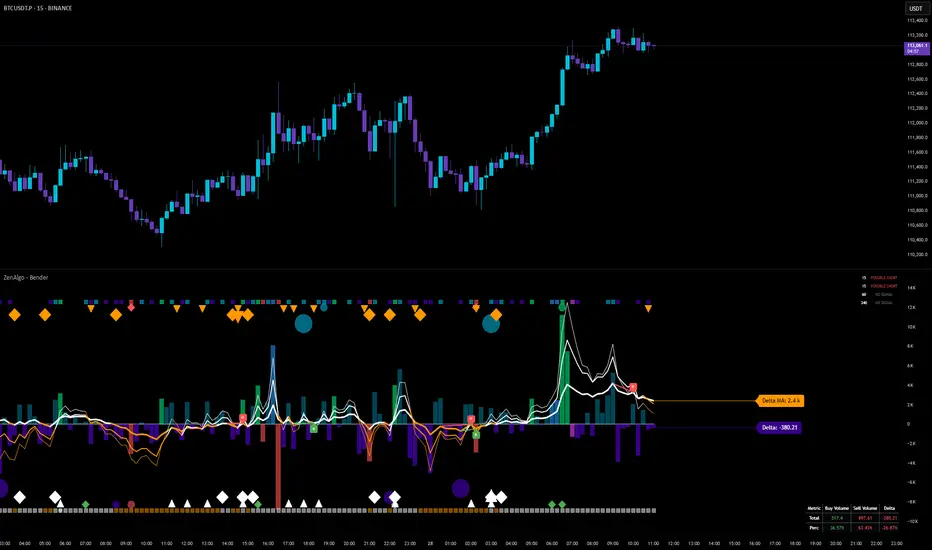
ZenAlgo - BenderThis script combines several volume-based methodologies into a single chart overlay to help traders analyze market participation and volume distribution. It aggregates volume from multiple sources—spot and perpetual markets across different exchanges—and processes it to display various insights directly on the chart.
The script provides a detailed view of both individual-bar volume and broader aggregated trends. It calculates certain values, plots different shapes and overlays, and includes an optional informational table. However, it does not offer financial signals or predict future price movements. Instead, it presents multiple volume and range-related highlights for educational or analytical observations.
Below is a detailed breakdown of the core elements in this script:
Core Data Calculation and Aggregation
To build a comprehensive volume picture, the script retrieves volume data from multiple predefined exchanges for both Spot and Perpetual pairs. The volume for each bar is processed in Aggregated mode , meaning it combines data across selected sources to produce a single composite volume value.
The script applies average-based aggregation to calculate the final volume figures. The total volume is then used as the basis for further calculations, such as buy/sell volume decomposition and Delta analysis.
Buy/Sell Volume Decomposition
Each bar’s total volume is separated into an estimated buy portion and a sell portion. This decomposition uses logic that considers wick length, body size, and whether the bar closed higher or lower than it opened. The script assigns fractions of the total volume to the upper wick, lower wick, and body, then multiplies these by the total aggregated volume to estimate buy and sell volumes.
This breakdown is calculated separately for spot-only volume , perp-only volume , and their aggregated sums, allowing traders to analyze how much of each bar’s volume is estimated as "buy" or "sell."
Delta and Cumulative Delta
The script computes a Delta (buy volume minus sell volume) for each bar. A positive Delta suggests more buying during that bar, while a negative Delta suggests more selling.
It also computes Cumulative Delta , summing this Delta over 14 bars (a fixed period). This allows users to observe how short-term buy/sell imbalances accumulate over time.
Visual Bar Coloring (PVSRA Logic)
The script includes logic based on PVSRA (Price Volume Support Resistance Analysis) , which examines average volume over a recent lookback period to determine whether a bar meets certain "climax" or "above-average" thresholds.
Bars are categorized as:
Climax Up or Climax Down: If a bar meets strong volume and range conditions, it is identified as a high-activity bar.
Neutral Colors: Bars that do not meet the threshold are identified as standard volume bars.
Table Summaries
The script includes an optional Spot vs. Perpetual volume table that provides:
Aggregated Spot vs. Perpetual buy/sell volumes
The net difference between buying and selling
The total sum across all included sources
Percentage breakdown of buying vs. selling
A separate multi-timeframe table calculates volume-related metrics for fixed timeframes (15, 60, and 240 minutes), allowing traders to compare their current timeframe with broader trends.
Highlighted Shapes and Diamonds
The script places shape markers above or below bars when certain conditions are met, including:
Dots (circles): Representing a significant increase in net Delta compared to the previous bar.
Diamonds: Markers that appear when volume-based conditions align with predefined thresholds. These vary in size and include an optional "Hardcore Mode" , which applies stricter filtering.
Crossover Triangles: These appear when the internally computed Delta MA (a moving average of Delta) crosses above or below a predefined EMA.
These markers highlight notable changes in volume, Delta, or price action but do not constitute predictive trading signals.
Delta Averages and Overlaid EMAs
The script plots a histogram of the current net Delta (buy minus sell) . Additionally, a Delta Moving Average (Delta MA) is used for tracking trends. The Delta MA is plotted alongside predefined Exponential Moving Averages (EMAs) , such as:
A Delta MA calculated using an exponential moving average (EMA) over 21 bars.
A set of predefined EMAs (lengths such as 3, 5, 7, 10, 13, 16, 21, 25, etc.) plotted to visualize momentum changes.
Areas between these EMAs can be filled with translucent shading to highlight momentum shifts.
Comparing the Delta MA to the overlaid EMAs helps track changes in Delta momentum over time.
Interpreting the Elements
When using this script, consider the following:
Volume Aggregation: The script aggregates volume across multiple Spot and Perpetual sources to provide a broad market view.
Delta and Cumulative Delta: The Delta histogram may spike positively or negatively, highlighting areas of potential buying or selling pressure.
Table Data: If enabled, the tables display buy/sell volume splits for Spot and Perpetual markets, along with multi-timeframe comparisons.
EMA Overlays on Delta: The stacked EMAs help visualize short-term vs. longer-term Delta changes.
Shape Markers: Dots, diamonds, and triangles emphasize notable shifts in volume or Delta but do not imply recommendations for action.
Usage Tips
Toggle "Hardcore Mode" to apply stricter filtering to highlight conditions.
Enable or disable the Spot vs. Perpetual Table to see if the breakdown of volume sources is useful.
Use the multi-timeframe table to compare intraday data with broader trends.
If the chart appears too cluttered, toggle off features like PVSRA color tints or some EMAs to focus on specific elements.
Final Thoughts
This script integrates multiple volume-based calculations, range analysis, aggregated volume from predefined tickers, and various moving averages for Delta. Its visual layers—color-coded bars, histograms, shape markers, and tables—offer a rich perspective on market activity.
Users can analyze these elements across any timeframe or market combination they prefer. The script does not provide buy/sell signals or make predictions —it is purely an analytical tool for understanding volume-based market dynamics.
Traders should interpret these visual elements according to their own strategy and trading approach.
Rolling Cumulative Volume DeltaRolling CVD is your market’s lie detector no resets, just raw volume truth! checks: close > open? Add volume (buyers flexing). Close < open? Subtract it (sellers sulking). Ties = zero. It rolls forever, plotting the vibe.
Use it when price fakes you out rising but CVD dips? Trouble. Dropping but CVD climbs? Sneaky strength. Perfect for scalpers sniffing momentum, swing traders riding waves, or that volume-obsessed buddy who overanalyses everything!
Shines best on timeframes under 15m to catch those sneaky price fibs in action!
Don’t bet your lunch money on Rolling CVD alone, you wild child! Pair it with your fave indicators RSI, moving averages, tea leaves, whatever because confluence is king. It’s a sly hint, not a crystal ball, so trade smart or the market’ll spank ya!
Volume Delta & Order Block Suite [QuantAlgo]Upgrade your volume analysis and order flow trading with Volume Delta & Order Block Suite by QuantAlgo, a sophisticated technical indicator that leverages advanced volume delta calculations, along with dynamic order block detection to provide deep insights into market participant behavior. By calculating the distribution of volume between buyers and sellers and tracking pivotal volume zones, the indicator helps traders understand the underlying forces driving price movements. It is particularly valuable for those looking to identify high-probability trading opportunities based on volume imbalances and key price levels where significant activity has occurred.
🟢 Technical Foundation
The Volume Delta & Order Block Suite utilizes sophisticated volume analysis techniques to estimate buying and selling pressure within each price candle. The core volume delta calculation employs a formula that estimates buy volume as: Volume × (Close - Low) ÷ (High - Low) , with sell volume calculated as the remainder of total volume. This approach assumes that when price closes near the high of a candle, most volume represents buying pressure, and when price closes near the low, most volume represents selling pressure.
For order block detection, the indicator implements a multi-step process involving volume pivot identification and price state tracking. It first detects significant volume pivot points using the ta.pivothigh function with a user-defined pivot period. It then tracks the market's order state based on whether the high exceeds the highest high or the low falls below the lowest low. When a volume pivot occurs, the indicator creates order blocks based on price levels at that pivot point. These blocks are continuously monitored for invalidation based on subsequent price action.
🟢 Key Features & Signals
1. Volume Delta Representation on Candles
The Volume Delta visualization on candles shows the buy/sell distribution directly on price bars, creating an immediate visual representation of volume pressure.
When buyers are dominant, candles are colored with the bullish theme color (default: green/teal).
Similarly, when sellers are dominant, candles are colored with the bearish theme color (default: red).
This visualization provides immediate insights into underlying volume pressure without requiring separate indicators, helping traders quickly identify which side of the market is in control.
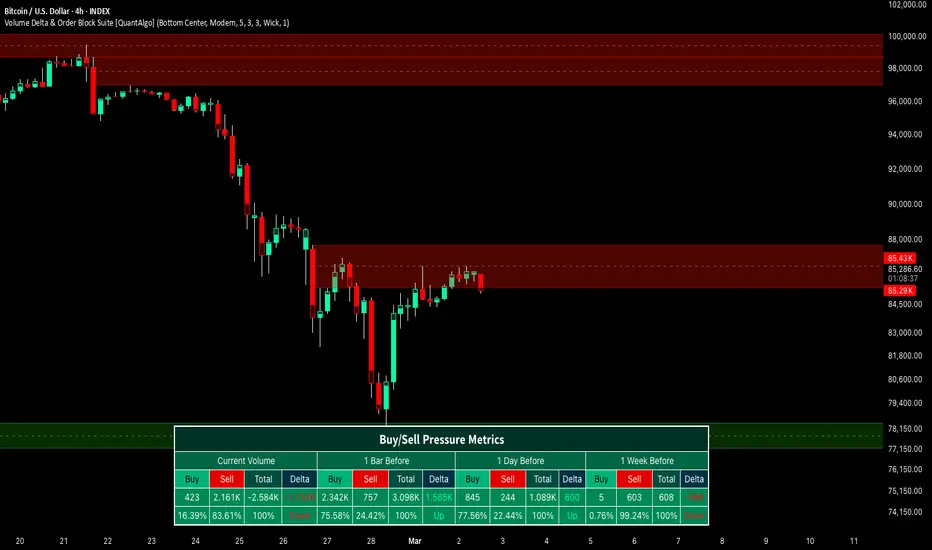
2. Buy/Sell Pressure Information Table
The Volume Analysis Table provides a comprehensive breakdown of volume metrics across multiple timeframes, helping traders identify shifts in market behavior.
The table is organized into four timeframe columns:
Current Volume
1 Bar Before
1 Day Before
1 Week Before
For each timeframe, the table displays:
Buy volume: The estimated buying volume based on price action
Sell volume: The estimated selling volume based on price action
Total volume: The sum of buy and sell volume
Delta: The difference between buy and sell volume (positive when buyers are dominant, negative when sellers are dominant)
Additionally, the table shows both absolute values and percentage distributions, with trend indicators (Up, Down, or Neutral) at the bottom row of each timeframe column.
This multi-timeframe approach helps traders:
→ Identify volume imbalances between buyers and sellers
→ Track changes in volume delta across different periods
→ Compare current conditions with historical patterns
→ Detect potential reversals by watching for shifts in delta direction
The delta values are particularly useful as they provide a clear indication of market dominance – positive delta (Up) when buyers are dominant, and negative delta (Down) when sellers are dominant.
3. Order Blocks and Their Confluence
Order blocks represent significant price zones where volume pivots occur, potentially indicating areas of significant market participant activity.
The indicator identifies two types of order blocks:
Bullish Order Blocks (support): Highlighted with a green/teal color, these represent potential support areas where price might bounce when revisited
Bearish Order Blocks (resistance): Highlighted with a red color, these represent potential resistance areas where price might reverse when revisited
Each order block is visualized as a colored rectangle with a dashed line showing the average price within the block. The blocks are extended to the right until they are invalidated.
Order blocks can serve as key reference points for trading decisions, for example:
Support/resistance identification
Stop loss placement (beyond the opposite edge of the block)
Potential reversal zones
Target areas for profit-taking
When price approaches an order block, traders should look for confluence with the volume delta on candles and the information in the volume analysis table. Strong setups occur when all three components align – for example, when price approaches a bearish order block with increasing sell volume shown on the candles and in the volume table.
🟢 Practical Usage Tips
→ Volume Analysis and Interpretation: The indicator visualizes the buy/sell volume ratio directly on price candles using color intensity, allowing traders to immediately identify which side (buyers or sellers) is dominant. This information helps in assessing the strength behind price movements and potential continuation or reversal signals.
→ Order Block Trading Strategies: The indicator highlights significant price zones where volume pivots occur, marking these as potential support (bullish order blocks) or resistance (bearish order blocks). Traders can use these levels to identify potential reversal points, stop placement, and profit targets.
→ Multi-timeframe Volume Comparison: Through its comprehensive volume analysis table, the indicator enables traders to compare volume patterns across current, recent, daily, and weekly timeframes. This helps in identifying shifts in market behavior and confirming the strength of ongoing trends.
🟢 Pro Tips
Adjust Pivot Period based on your timeframe:
→ Lower values (3-5) for more frequent order blocks
→ Higher values (7-10) for stronger, less frequent order blocks
Fine-tune Mitigation Method based on your trading style:
→ "Wick" for more conservative invalidation
→ "Close" for more lenient order block survival
Look for confluence between components:
→ Strong volume delta in the expected direction when price touches an order block
→ Corresponding patterns in the volume analysis table
→ Overall market context aligning with the expected direction
Use for multiple trading approaches:
→ Support/resistance trading at order blocks
→ Trend confirmation with volume delta
→ Reversal detection when volume delta changes direction
→ Stop loss placement using order block boundaries
Combine with:
→ Trend analysis using trend-following indicators for trade confirmation
→ Multiple timeframe analysis for strategic context
ZenAlgo - DetectorThis script combines multiple volume data sources, calculates several forms of volume-based metrics, displays a table for Spot vs. Perpetual volumes, and visualizes several technical elements (such as cumulative delta, divergences, fractals, and specialized moving averages). The primary objective is to help analyze volume activity across different exchanges, compare Spot vs. Perpetual markets, and observe how shifting volumes may coincide with price action characteristics. This description aims to clarify each component, explain how the calculations are performed, and show you how to interpret the various chart markings.
Why Combine These Metrics in One Script?
Many publicly available volume-related tools focus only on a single exchange or a single type of volume (like spot or futures). This script merges multiple exchange sources for spot and perpetual data into a unified view. By doing so, users can detect discrepancies or confirm alignment between different markets without juggling multiple indicators. It also processes volume-derived signals (delta, divergences, fractals, etc.) in one place, sparing you from manually combining various standalone scripts. Through this integration, it becomes easier to observe how price and volume interact across different market segments.
Core Concept: Aggregated Volume
The script begins by collecting volumes from multiple exchanges in two categories:
Spot volumes – Typically aggregated under symbols ending with "USDT" or a user-selected currency, and
Perpetual volumes – From perpetual futures contracts (e.g., symbols ending in "USD.P" or "USDT.P").
All these exchange volumes are requested via the built-in request.security() function in a single line for each exchange. The user can enable or disable each exchange in the inputs. The script then calculates an "aggregated volume" for Spot, an aggregated volume for Perpetual, and an overall combined total.
This aggregated volume is used later to break down how much of each bar's volume can be considered "buy" or "sell" based on the bar's candle structure (body vs. wicks).
Volume-Based Calculations: Buy vs. Sell Volume and Delta
For each bar, the script estimates how much of the aggregated volume can be associated with a "buy side" and a "sell side."
Volume Buy is computed if the bar's close is above the open , giving more weight to the candle's body and allocating some portion of volume to the wicks as well.
Volume Sell is similarly computed if the bar's close is below the open .
This results in a Delta value: Delta = (Buy Volume) – (Sell Volume).
Additionally, the script accumulates these values over a user-defined "lookback length" to provide Cumulative Delta . This can help show longer-term directional volume bias.
Table: Spot vs. Perpetual Comparison
There is a toggle ("Show Spot vs Perpetual Table") that displays an on-chart table comparing volumes:
Buy Volume and Sell Volume for each aggregated category (Spot, Perp, and their sum).
Delta (the difference between Buy and Sell).
Percentage breakdowns of buy vs. sell portions.
This table only appears on the most recent bar and helps users quickly assess how Spot and Perpetual volumes compare, plus the overall total.
PVSRA Color Coding
A "PVSRA-style" color approach classifies each bar based on volume and candle range:
Climax Up (lime) or Climax Down (red) occurs if volume is extremely high relative to a simple moving average of volume and range.
Above-Average Up (blue) or Down (fuchsia) occurs if volume is moderately higher than average.
Otherwise, colors fall back to neutral up/down colors.
This allows you to spot potentially high-volume "climax" bars vs. bars with only moderate or typical volume levels.
Fractals and Divergences
The script detects certain fractal points on the aggregated volumes (sum of buy or sell volumes). It looks for a 5-bar pattern (with the current bar in the middle for top or bottom fractals).
When a fractal is confirmed on buy volume, the script checks if new higher price highs coincide with lower buy-volume peaks (or vice versa) to highlight regular or hidden divergences.
Similar logic is applied on the sell-volume side if new lower price lows occur alongside higher sell-volume troughs (or the opposite).
If enabled in the settings, lines and labels may appear on the chart to mark these divergence points.
"Delta Dot" Events
This script draws small circles above or below bars when the total delta changes magnitude relative to the previous bar by certain user-defined multipliers. It segregates "tiny," "small," "large," and "extra" expansions in bullish or bearish delta.
Bullish Dots : Appear above the bar when the new positive delta is multiple times bigger than the previous positive delta.
Bearish Dots : Appear below the bar in a similar fashion for negative delta.
These dots emphasize large or sudden shifts in buy/sell pressure from one bar to the next.
Delta MA and its Direction
A moving average is calculated on the total delta and optionally multiplied by a factor (in the code, by 4) to make it visually prominent. The user can pick from SMA, EMA, WMA, RMA, or HMA as the smoothing technique.
Delta MA Direction : The script compares the current delta MA to a short SMA of itself to define whether it is rising or falling.
A color is assigned—blue if rising, orange if falling, gray if they're roughly equal.
This helps quickly visualize longer-term momentum in the net delta metric.
Divergences on the Delta MA
After computing the "Delta MA" line, the script detects pivot highs or lows on that line. If the price makes a new high but the Delta MA pivot is lower (and vice versa), it draws lines and small labels indicating potential divergence.
Bearish Divergence : Price makes a higher high, while the Delta MA pivot forms a lower high.
Bullish Divergence : Price makes a lower low, while the Delta MA pivot forms a higher low.
RSI + MFI Computation
The script also calculates a simplified form of RSI+MFI by comparing (close – open) / (high – low) * a multiplier , then smoothing it with a simple average. This is purely for an optional observational measure to see if the price action is leaning bullish or bearish in terms of these combined indicators.
EMA Overlay and Diamond Shapes
There are two standard EMAs (13 and 21). The script checks whether price is above or below these EMAs, in addition to other conditions (like changes in delta, volume, or RSI+MFI direction) to draw diamond shapes at the top or bottom of the chart:
Green Diamonds near the bottom if the conditions line up to suggest that the environment is more favorable for bullish pressure.
Red Diamonds near the top if the environment suggests more bearish pressure.
These diamonds come in two sizes:
Normal – More pronounced, typically plotted if RSI+MFI result is above/below zero.
Small – Plotted if RSI+MFI is on the other side of that threshold.
An optional "Hardcore Mode" adds special tiny diamonds under specific delta color/condition mismatches.
How to Interpret the Chart Elements
Line Plots of Buy and Sell Volumes : A positive line for buy volume, a negative line for sell volume, and a zero-line for reference. This provides at-a-glance perspective on how buy or sell volumes add up per bar.
Histogram "Total Delta" : A color-coded bar that quickly shows whether overall buy vs. sell volume is dominant. The color is governed by the PVSRA logic (e.g., potential climax or above-average conditions).
Volume Table (when enabled): Summarizes volumes in numeric and percentage form for Spot, Perp, and total categories on the last bar.
Delta Dots : Small circles highlighting abrupt changes in delta magnitude. Larger multiples indicate bigger jumps compared to the previous bar.
Fractals & Divergence Lines : Connect pivot points in buy/sell volume or in the Delta MA line with price highs/lows to indicate potential divergences.
Delta MA Plot : Smooth curve (scaled up x4) to reflect longer-term accumulation or distribution in the delta. Colored by whether the MA is above or below a short average of itself.
Diamonds : Appear when certain volume, price, RSI+MFI, and delta conditions converge. Green diamonds near the bottom typically coincide with bullish conditions, red diamonds near the top with bearish conditions.
Practical Usage Notes
Use the Spot vs. Perp breakdown to see if these two market segments differ significantly in their contributions to total volume. This can be informative when a certain type of market (futures vs. spot) might be "driving" price action.
The PVSRA color scheme highlights "climax" or "above-average" volume bars, which can sometimes appear around major reversals or breakouts.
Observing divergences in aggregated buy/sell volume (or in the Delta MA line) can provide additional context on whether certain price moves are backed by strong volume involvement.
The script's fractal divergences rely on short pivot detection. Signals will appear only after enough bars have passed for confirmation, so these are effectively "after-the-fact" notations to illustrate possible volume/price divergences.
The diamonds do not necessarily instruct any buy/sell action; rather, they mark conditions where multiple volume and momentum criteria line up in one direction.
Important Considerations
This script displays aggregated volumes from potentially multiple exchanges. Each exchange or pair might have different time zones, liquidity, or data availability, which can occasionally result in incomplete or zero values.
All references to "buy" or "sell" volume are approximate breakdowns based on candle structure. They are not absolute measures of real-time order flow.
Divergences and fractal points are provided strictly for analytical insight. They can repaint or shift if the fractal conditions were not fully confirmed in real time.
The color-coded lines, histograms, diamonds, and tables are strictly to guide analysis of volume fluctuations and do not claim to predict future price performance.
If you enable "Hardcore Mode," you will see additional diamond markers. This mode is mainly intended as an extra highlight of certain "contradictory" delta conditions.
Summary
The "ZenAlgo - Detector" script brings together a variety of volume-based analyses:
Aggregated volumes from multiple exchanges
A breakdown into Spot vs. Perpetual activity
Delta calculations, fractal divergences, and a specialized Delta Moving Average
Color-coded bars reflecting possible PVSRA concepts
A table to highlight numeric differences and percentages
Additional overlays (e.g., diamonds, RSI+MFI synergy, etc.)
In contrast to many free, single-exchange indicators, this script centralizes multiple exchange volumes in one place, making it easier to observe and compare volume flows across different market types (spot vs. perpetual). Users no longer need to rely on scattered tools or separate overlays to check volume divergences, fractals, or specialized MA calculations—everything is unified here. By carefully monitoring the table, Delta histogram, color-coded bars, divergence lines, and diamond markers, traders can more comprehensively evaluate how volume and price interact. Each plot is designed to showcase different aspects of volume flow—such as whether spot or derivatives markets dominate, if volume is skewed toward buying or selling, and if there are divergences between volume momentum and price movement.
All computations are displayed to help you carry out a more informed market analysis. It is strongly advised to combine these observations with other risk management or analytical methods, rather than relying on any single indicator alone.

Orderblocks | iSolani
Revealing Institutional Footprints: The iSolani Volume-Powered Order Block System
Where Smart Money Leaves Its Mark – Automated Zone Detection for Discretionary Traders
Core Methodology
Pressure-Weighted Volume Analysis
Calculates directional commitment using candle position:
Buying Pressure = Total Volume × (Closing Price – Low) / (High – Low)
Selling Pressure = Total Volume × (High – Closing Price) / (High – Low)
Normalizes values against 31-period EMAs to filter retail noise
Adaptive Block Triggering
Identifies significant zones when:
Absolute Buy/Sell Difference > 4× SMA of Historical Differences (default)
Price closes bullishly (green block) or bearishly (red block)
Self-Maintaining Visualization
Blocks auto-extend rightward until price breaches critical level
Invalidated zones removed in real-time via array management
Technical Innovation
Dynamic Threshold Adjustment
Multiplier parameter (default 4) automatically scales with market volatility
Institutional-Grade Metrics
Blocks display:
Volume disparity in absolute terms
Percentage deviation from 33-period average
Directional bias through color-coding
Efficient Memory Handling
O(n) complexity cleanup routine prevents chart lag
System Workflow
Calculates real-time buy/sell pressure ratios
Compares to historical average (31-period default)
Generates semi-transparent zones (85% opacity) at spike locations
Monitors price interaction with block boundaries
Automatically retracts invalid zones
Standard Configuration
Sensitivity : 4× multiplier (ideal for 15m-4h charts)
Visuals : Red/green blocks with white text labels
Duration : 50-bar default extension
Volume Baseline : 33-period EMA filter
Boundary Check : Close beyond block high/low triggers deletion
This system transforms raw market data into a institutional roadmap – not by predicting turns, but by revealing where concentrated volume makes turns statistically probable. The color-coded blocks serve as persistent yet adaptive markers of where professional liquidity resides.

Footprint IQ Pro [TradingIQ]Hello Traders!
Introducing "Footprint IQ Pro"!
Footprint IQ Pro is an all-in-one Footprint indicator with several unique features.
Features
Calculated delta at tick level
Calculated delta ratio at tick level
Calculated buy volume at tick level
Calculated sell volume at tick level
Imbalance detection
Stacked imbalance detection
Stacked imbalance alerts
Value area and POC detection
Highest +net delta levels detection
Lowest -net delta levels detection
CVD by tick levels
Customizable values area percentage
The image above thoroughly outlines what each metric in the delta boxes shows!
Metrics In Delta Boxes
"δ:", " δ%:", " ⧎: ", " ◭: ", " ⧩: "
δ Delta (Difference between buy and sell volume)
δ% Delta Ratio (Delta as a percentage of total volume)
⧎ Total Volume At Level (Total volume at the price area)
◭ Total Buy Volume At Level (Total buy volume at the price area)
⧩ Total Sell Volume At Level (total sell volume at the price area)
Each metric comes with a corresponding symbol.
That said, until you become comfortable with the symbol, you can also turn on the descriptive labels setting!
The image above exemplifies the feature.
The image above shows Footprint IQ's full power!
Additionally, traders with an upgraded TradingView plan can make use of the "1-Second" feature Footprint IQ offers!
The image above shows each footprint generated using 1-second volume data. 1-second data is highly granular compared to 1-minute data and, consequently, each footprint is exceptionally more accurate!
Imbalance Detection
Footprint IQ pro is capable of detecting user-defined delta imbalances.
The image above further explains how Footprint IQ detects imbalances!
The imbalance percentage is customizable in the settings, and is set to 70% by default.
Therefore,
When net delta is positive, and the positive net delta constitutes >=70% of the total volume, a buying imbalance will be detected (upwards triangle).
When net delta is negative, and the negative net delta constitutes >=70% of the total volume, a buying imbalance will be detected (downwards triangle).
Stacked Imbalance Detection
In addition to imbalance detection, Footprint IQ Pro can also detect stacked imbalances!
The image above shows Footprint IQ Pro detecting stacked imbalances!
Stacked imbalances occur when consecutive imbalances at sequential price areas occur. Stacked imbalances are generally interpreted as significant price moves that are supported by volume, rather than a significant result with disproportionate effort.
The criteria for stacked imbalance detection (how many imbalances must occur at sequential price areas) is customizable in the settings.
The default value is three. Therefore, when three imbalances occur at sequential price areas, golden triangles will begin to print to show a stacked imbalance.
Additionally, traders can set alerts for when stacked imbalances occur!
Highest +Delta and Highest -Delta Levels
In addition to being a fully-fledged Footprint indicator, Footprint IQ Pro goes one step further by detecting price areas where the greater +Delta and -Delta are!
The image above shows price behavior near highest +Delta price areas detected by Footprint IQ!
These +Delta levels are considered important as there has been strong interest from buyers at these price areas when they are traded at.
It's expected that these levels can function as support points that are supported by volume.
The image above shows a similar function for resistance points!
Blue lines = High +Delta Detected Price Areas
Red lines = High -Delta Detected Price Areas
Value Area Detection
Similar to traditional volume profile, Footprint IQ Pro displays the value area per bar.
Green lines next to each footprint show the value area for the bar. The value area % is customizable in the settings.
CVD Levels
Footprint IQ Pro is capable of storing historical volume delta information to provide CVD measurements at each price area!
The image above exemplifies this feature!
When this feature is enabled, you will see the CVD of each price area, rather than the net delta!
And that's it!
Thank you so much to TradingView for offering the greatest charting platform for everyone to create on!
If you have any feature requests you'd like to see for Footprint IQ, please feel free to share them with us!
Thank you!
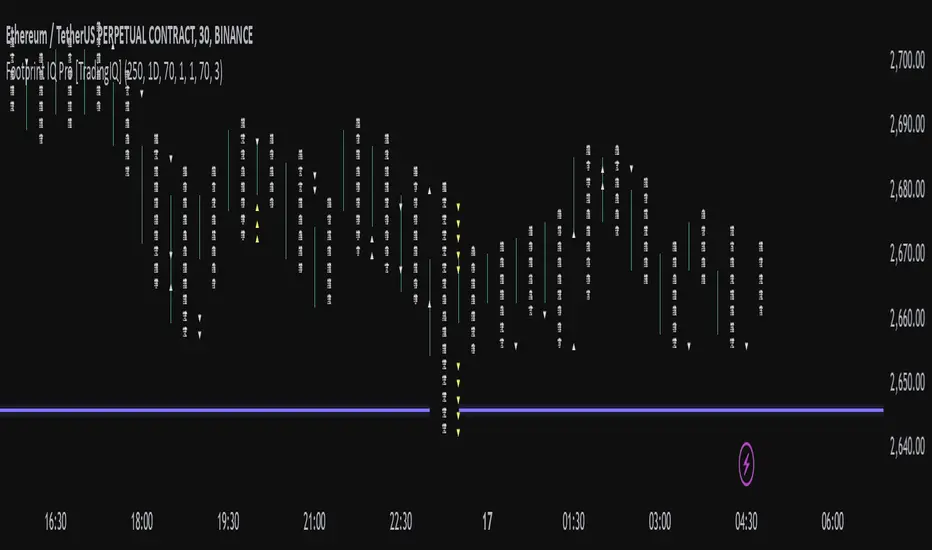
Volume Delta with Custom Colors and Min Delta Input### Indicator Description: **Volume Delta with Custom Colors and Min Delta Input**
---
Volume Delta with Custom Colors and Min Delta Input is a powerful and flexible indicator for analyzing volume delta (the difference between buying and selling volume) on TradingView charts. This indicator visualizes volume delta with customizable colors and allows filtering based on a minimum delta value. It is an ideal tool for traders who want to gain deeper insights into market activity and identify significant volume changes.
---
### Key Features:
Volume Delta Visualization:
- The indicator displays volume delta as candlesticks, where:
- Green candles indicate positive delta (buying volume dominance).
- Red candles indicate negative delta (selling volume dominance).
Customizable Colors:
- Users can choose their preferred colors for positive and negative delta to tailor the indicator to their preferences.
Minimum Delta Volume Filter:
- Added functionality to set a minimum delta volume threshold. This helps ignore insignificant volume changes and focus on important movements.
Flexible Timeframe Selection:
- The indicator supports analyzing volume delta on a different timeframe than the current chart. For example, you can analyze hourly volume delta on a daily chart.
Adaptive Settings:
- Users can configure the moving average (SMA) period and standard deviation multiplier to calculate the delta threshold.
---
### How to Use the Indicator:
Add the Indicator to Your Chart:
- Search for the indicator in the TradingView library and add it to your chart.
Configure the Settings:
- Positive Delta Bar Color: Choose the color for bars with positive delta.
- Negative Delta Bar Color: Choose the color for bars with negative delta.
- Minimum Delta Volume: Set the minimum delta volume value to be displayed.
- Use Custom Timeframe: Enable if you want to analyze volume on a different timeframe.
- Timeframe: Specify the desired timeframe for volume analysis (e.g., "1H" for hourly).
- SMA Period: Set the moving average period for delta calculation.
- Delta Multiplier: Adjust the standard deviation multiplier to fine-tune the delta threshold.
Analyze the Chart:
- Green candles indicate buying volume dominance, while red candles indicate selling volume dominance.
- Use the minimum delta volume filter to focus on significant movements.
---
### Benefits of the Indicator:
Flexibility: Customizable colors, timeframe selection, and filtering make the indicator versatile for various trading strategies.
Clarity: Volume delta visualization as candlesticks allows for quick assessment of market activity.
Noise Reduction: The minimum delta volume filter helps ignore insignificant changes and focus on important movements.
---
### Example Use Cases:
For Scalping: Use a minute timeframe and set a minimum delta volume filter to identify short-term volume anomalies.
For Long-Term Trading: Analyze volume delta on daily or weekly timeframes to identify key support and resistance levels.
---
### Recommendations:
Use the indicator in combination with other technical analysis tools (e.g., support/resistance levels or trendlines) to improve signal accuracy.
Experiment with the settings to adapt the indicator to your trading strategies.
---
Volume Delta with Custom Colors and Min Delta Input is an essential tool for traders who want to gain a deeper understanding of market dynamics and make more informed trading decisions. Try it out today and see its effectiveness for yourself!
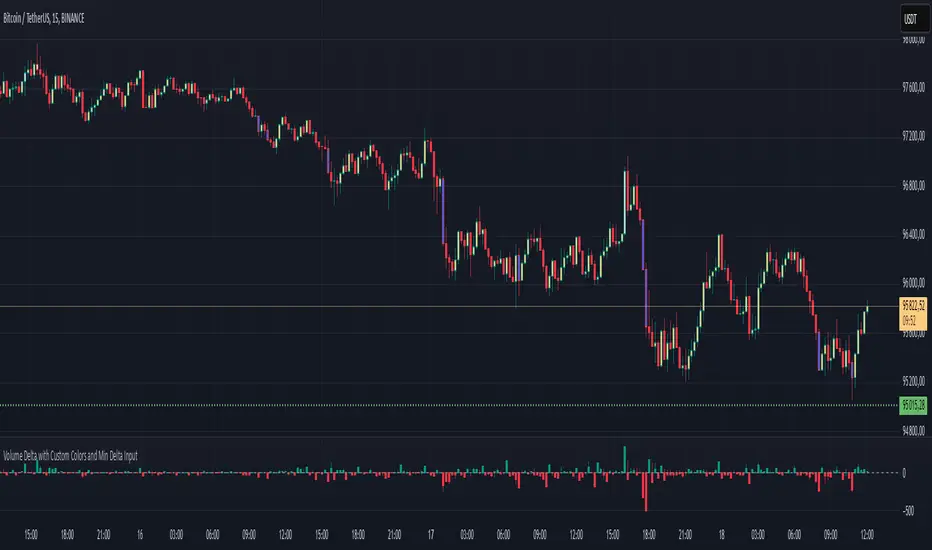
Volume Delta with PVSRAVolume Delta with PVSRA
Volume Delta with PVSRA is an advanced volume indicator that dissects each bar’s volume into its directional components using higher resolution data. It visually distinguishes between buying and selling volume, so that for a bullish candle the bottom portion represents buying volume and for a bearish candle it represents selling volume. A dot is plotted at the 50% mark of the candle’s total volume, serving as a clear reference point.
Key Features:
Directional Volume Breakdown:
The indicator calculates the delta volume by analyzing lower timeframe data. The bottom portion of a bullish candle (displayed in green) represents buying volume, while that of a bearish candle (displayed in red) represents selling volume.
PVSRA Analysis:
Using Price-Volume Spread Range Analysis, the indicator compares the current volume to the 10-bar average. When volume is significantly higher (using thresholds of 150% and 200%), the candle borders are highlighted in custom colors, indicating medium or strong volume conditions.
Volume Moving Averages:
Three moving averages are plotted:
Total Volume MA (yellow): Tracks overall volume.
Buying Volume MA (green) and Selling Volume MA (red): These are re-centered around the total volume MA. A crossover of the green over the red typically signals rising buying pressure, while the opposite indicates increasing selling pressure.
Scalable Volume Bars:
The indicator scales the volume bars to provide optimal visualization on your chart.
Setup Instructions:
For best results, open your chart settings, navigate to the Canvas tab, and set the bottom margin to 0%. This ensures the indicator displays like a standard volume indicator without any unwanted gaps at the bottom.
Customize the various settings—including colors, border opacity, and moving average parameters—to suit your trading style.