Ultimate Trend Strength Meter Using TechnoBloom’s IndicatorsOverview
The Ultimate Trend Strength Meter Using TechnoBloom’s Indicators is a powerful trend analysis tool developed using TechnoBloom’s proprietary indicators. This indicator helps traders assess trend strength, momentum, and potential reversals by combining three essential market factors:
• Market Participation Ratio (MPR) – Measures trader engagement and volume strength.
• Volume Weighted Moving Average (VWMO) – Confirms momentum and trend direction.
• Fibonacci-Based Support & Resistance – Identifies key reversal zones and breakout points.
⸻
Key Features:
✅ Color-Coded Trend Strength Meter:
• 🟢 Green – Strong Trend (High Confidence): High participation, strong momentum, and no major resistance.
• 🟡 Yellow – Weak Trend (Caution): Moderate participation, possible resistance ahead, and trend uncertainty.
• 🔴 Red – Reversal Risk / No Trend: Low market engagement, momentum uncertainty, and proximity to major Fibonacci levels.
✅ Eliminates False Signals & Weak Trends:
• Prevents choppy market entries by ensuring high-volume confirmation.
• Ideal for filtering fake breakouts and exhaustion phases.
✅ Works for All Trading Styles & Markets:
• Scalping (1m-5m), Day Trading (15m-1H), and Swing Trading (4H-Daily).
• Suitable for Forex, Stocks, Crypto, Indices, and Commodities (XAUUSD, US30, BTCUSD, etc.).
✅ Customizable for Any Strategy:
• Adjustable MPR thresholds, VWMO smoothing, and Fibonacci sensitivity.
• Built-in alerts notify traders when trend conditions change.
⸻
How to Use It:
1️⃣ Enter trades when the meter turns Green (Strong Trend) and aligns with your strategy.
2️⃣ Avoid or exit trades when it turns Red (Reversal Risk) to prevent unnecessary losses.
3️⃣ Use Yellow as a caution zone – wait for confirmation before making a move.
4️⃣ Combine with breakout strategies or support/resistance setups for high-probability entries.
⸻
About TechnoBlooms
TechnoBlooms is committed to developing high-precision trading indicators that enhance decision-making for traders across all markets. This tool is a result of our in-depth market research and algorithmic advancements to provide traders with an edge.
🚀 Upgrade your trading with the Ultimate Trend Strength Meter – Developed by TechnoBlooms! 🚀
Volume

VSA Volume + Fibonacci (Volunacci)Overview
This indicator combines Volume Spread Analysis (VSA) with Fibonacci levels to identify key price zones based on volume behavior. It helps traders determine potential support and resistance levels influenced by volume strength.
How It Works
Volume Calculation
The indicator calculates volume levels based on the selected timeframe.
It identifies high volume spikes and low volume dips, which are critical for detecting supply and demand shifts.
It uses a simple moving average (SMA) of volume to smooth fluctuations.
Fibonacci Levels Integration
When a high-volume event is detected, the indicator records the highest high and lowest low of that candle.
It then plots Fibonacci retracement and extension levels to highlight potential price reaction zones.
Negative Fibonacci levels are included to identify possible deep retracements.
Visual Features
The indicator adapts to both light and dark themes for better visibility.
Fibonacci lines are color-coded based on key retracement and extension levels.
A table displaying key Fibonacci levels and their corresponding prices is provided for quick reference.
Why Is This Indicator Useful?
It helps traders spot accumulation and distribution phases by analyzing volume at key price points.
The combination of VSA and Fibonacci allows traders to confirm trend strength and identify potential reversal points.
Works well for trend-following strategies, scalping, and breakout trading.
How to Use This Indicator?
Use it to confirm breakouts or reversals at Fibonacci levels when volume supports the move.
Watch for high-volume spikes near key Fibonacci zones—these can signal strong trend continuation or reversal.
Use the displayed Fibonacci table to quickly assess price reaction levels.
Credits
This script was inspired by the Hidden Gap’s VSA Volume indicator by HPotter and has been enhanced by integrating Fibonacci-based analysis.

XGBoost Approximation Indicator with HTF Filter Ver. 3.2XGBoost Approx Indicator with Higher Timeframe Filter Ver. 3.2
What It Is
The XGBoost Approx Indicator is a technical analysis tool designed to generate trading signals based on a composite of multiple indicators. It combines Simple Moving Average (SMA), Relative Strength Index (RSI), MACD, Rate of Change (ROC), and Volume to create a composite indicator score. Additionally, it incorporates a higher timeframe filter (HTF) to enhance trend confirmation and reduce false signals.
This indicator helps traders identify long (buy) and short (sell) opportunities based on a weighted combination of trend-following and momentum indicators.
How to Use It Properly
Setup and Configuration:
Add the indicator to your TradingView chart.
Customize input settings based on your trading strategy. Key configurable inputs include:
HTF filter (default: 1-hour)
SMA, RSI, MACD, and ROC lengths
Custom weightings for each component
Thresholds for buy and sell signals
Understanding the Signals:
Green "Long" Label: Appears when the composite indicator crosses above the buy threshold, signaling a potential buy opportunity.
Red "Short" Label: Appears when the composite indicator crosses below the sell threshold, signaling a potential sell opportunity.
These signals are filtered by a higher timeframe SMA trend to improve accuracy.
Alerts:
The indicator provides alert conditions for long and short entries.
Traders can enable alerts in TradingView to receive real-time notifications when a new signal is triggered.
Safety and Best Practices
Use in Conjunction with Other Analysis: Do not rely solely on this indicator. Combine it with price action, support/resistance levels, and fundamental analysis for better decision-making.
Adjust Settings for Your Strategy: The default settings may not suit all markets or timeframes. Test different configurations before trading live.
Backtest Before Using in Live Trading: Evaluate the indicator’s past performance on historical data to assess its effectiveness in different market conditions.
Avoid Overtrading: False signals can occur, especially in low volatility or choppy markets. Use additional confirmation (e.g., trendlines or moving averages).
Risk Management: Always set stop-loss levels and position sizes to limit potential losses.

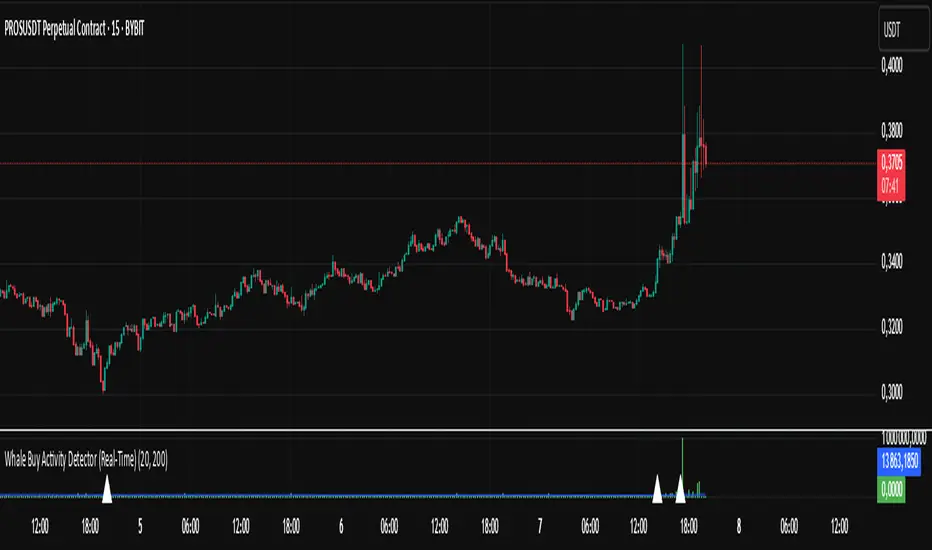
Whale Buy Activity Detector (Real-Time)Whale Buy Activity Detector (Real-Time)
This indicator helps to identify abnormal spikes in the volume of purchases, which may indicate the activity of large players ("whales"). It analyzes the volume of purchases and compares it with the average volume over a certain period of time. If the volume of purchases exceeds a set threshold, the indicator marks this as potential whale activity.
Basic parameters:
Volume Threshold (x Average): The coefficient by which the current purchase volume must exceed the average volume in order to be considered abnormal. The default value is 2.0, which means that the purchase volume should be 2 times the average volume for the selected time period. This parameter can be adjusted in the range from 1.0 and higher in increments of 0.1.
Example: If you set the value to 1.5, the indicator will mark situations when the volume of purchases exceeds the average volume by 1.5 times.
Lookback Period: The time period used to calculate the average purchase volume. The default value is 20, which means that the average purchase volume will be calculated for the last 20 candles. This parameter can be set in the range from 1 and above.Example: If you set the value to 10, the average purchase volume will be calculated for the last 10 candles.
How to use:
Buy Volume: Shows the volume of purchases on each candle. This is the volume that was sold at a price higher than the opening price of the candle.
Average Buy Volume: The average volume of purchases over a given time period (Lookback Period). This parameter helps to determine the "normal" level of purchase volume.
Whale Buy: Notes abnormal spikes in the volume of purchases, which may indicate the activity of "whales". The indicator draws a mark on the top of the candle when the purchase volume exceeds the threshold set by the Volume Threshold parameter.
Notifications:
The indicator can send notifications when an abnormal volume of purchases is detected. You can set up notifications via the TradingView menu to receive real-time alerts.
Usage example:
If you are trading in a highly volatile market, you can increase the Volume Threshold to filter out small volume spikes.
If you trade in a low-volatility market, you can reduce the Volume Threshold to capture even small anomalies.
Liquidity Sweep Filter Strategy [AlgoAlpha X PineIndicators]This strategy is based on the Liquidity Sweep Filter developed by AlgoAlpha. Full credit for the concept and original indicator goes to AlgoAlpha.
The Liquidity Sweep Filter Strategy is a non-repainting trading system designed to identify liquidity sweeps, trend shifts, and high-impact price levels. It incorporates volume-based liquidation analysis, trend confirmation, and dynamic support/resistance detection to optimize trade entries and exits.
This strategy helps traders:
Detect liquidity sweeps where major market participants trigger stop losses and liquidations.
Identify trend shifts using a volatility-based moving average system.
Analyze volume distribution with a built-in volume profile visualization.
Filter noise by differentiating between major and minor liquidity sweeps.
How the Liquidity Sweep Filter Strategy Works
1. Trend Detection Using Volatility-Based Filtering
The strategy applies a volatility-adjusted moving average system to determine trend direction:
A central trend line is calculated using an EMA smoothed over a user-defined length.
Upper and lower deviation bands are created based on the average price deviation over multiple periods.
If price closes above the upper band, the strategy signals an uptrend.
If price closes below the lower band, the strategy signals a downtrend.
This approach ensures that trend shifts are confirmed only when price significantly moves beyond normal market fluctuations.
2. Liquidity Sweep Detection
Liquidity sweeps occur when price temporarily breaks key levels, triggering stop-loss liquidations or margin call events. The strategy tracks swing highs and lows, marking potential liquidity grabs:
Bearish Liquidity Sweeps – Price breaks a recent high, then reverses downward.
Bullish Liquidity Sweeps – Price breaks a recent low, then reverses upward.
Volume Integration – The strategy analyzes trading volume at each sweep to differentiate between major and minor sweeps.
Key levels where liquidity sweeps occur are plotted as color-coded horizontal lines:
Red lines indicate bearish liquidity sweeps.
Green lines indicate bullish liquidity sweeps.
Labels are displayed at each sweep, showing the volume of liquidated positions at that level.
3. Volume Profile Analysis
The strategy includes an optional volume profile visualization, displaying how trading volume is distributed across different price levels.
Features of the volume profile:
Point of Control (POC) – The price level with the highest traded volume is marked as a key area of interest.
Bounding Box – The profile is enclosed within a transparent box, helping traders visualize the price range of high trading activity.
Customizable Resolution & Scale – Traders can adjust the granularity of the profile to match their preferred time frame.
The volume profile helps identify zones of strong support and resistance, making it easier to anticipate price reactions at key levels.
Trade Entry & Exit Conditions
The strategy allows traders to configure trade direction:
Long Only – Only takes long trades.
Short Only – Only takes short trades.
Long & Short – Trades in both directions.
Entry Conditions
Long Entry:
A bullish trend shift is confirmed.
A bullish liquidity sweep occurs (price sweeps below a key level and reverses).
The trade direction setting allows long trades.
Short Entry:
A bearish trend shift is confirmed.
A bearish liquidity sweep occurs (price sweeps above a key level and reverses).
The trade direction setting allows short trades.
Exit Conditions
Closing a Long Position:
A bearish trend shift occurs.
The position is liquidated at a predefined liquidity sweep level.
Closing a Short Position:
A bullish trend shift occurs.
The position is liquidated at a predefined liquidity sweep level.
Customization Options
The strategy offers multiple adjustable settings:
Trade Mode: Choose between Long Only, Short Only, or Long & Short.
Trend Calculation Length & Multiplier: Adjust how trend signals are calculated.
Liquidity Sweep Sensitivity: Customize how aggressively the strategy identifies sweeps.
Volume Profile Display: Enable or disable the volume profile visualization.
Bounding Box & Scaling: Control the size and position of the volume profile.
Color Customization: Adjust colors for bullish and bearish signals.
Considerations & Limitations
Liquidity sweeps do not always result in reversals. Some price sweeps may continue in the same direction.
Works best in volatile markets. In low-volatility environments, liquidity sweeps may be less reliable.
Trend confirmation adds a slight delay. The strategy ensures valid signals, but this may result in slightly later entries.
Large volume imbalances may distort the volume profile. Adjusting the scale settings can help improve visualization.
Conclusion
The Liquidity Sweep Filter Strategy is a volume-integrated trading system that combines liquidity sweeps, trend analysis, and volume profile data to optimize trade execution.
By identifying key price levels where liquidations occur, this strategy provides valuable insight into market behavior, helping traders make better-informed trading decisions.
Key use cases for this strategy:
Liquidity-Based Trading – Capturing moves triggered by stop hunts and liquidations.
Volume Analysis – Using volume profile data to confirm high-activity price zones.
Trend Following – Entering trades based on confirmed trend shifts.
Support & Resistance Trading – Using liquidity sweep levels as dynamic price zones.
This strategy is fully customizable, allowing traders to adapt it to different market conditions, timeframes, and risk preferences.
Full credit for the original concept and indicator goes to AlgoAlpha.

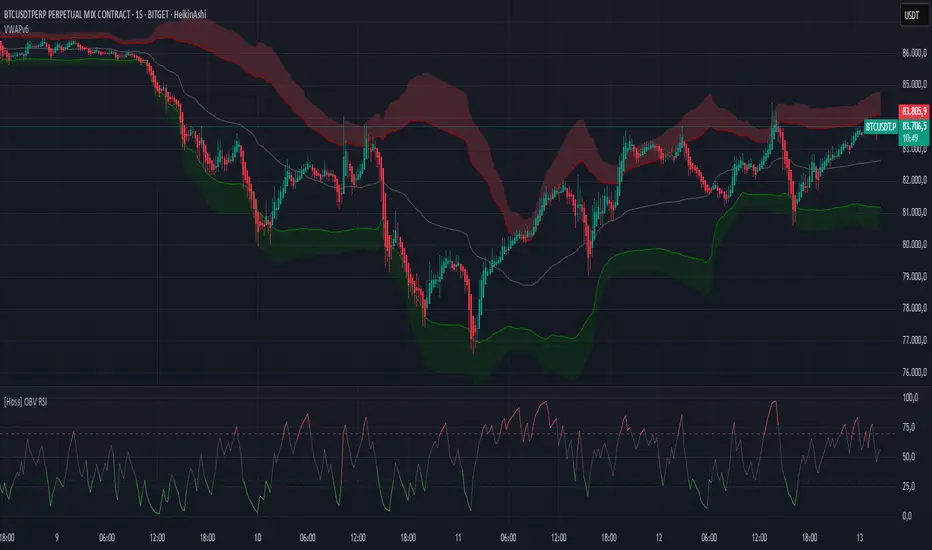
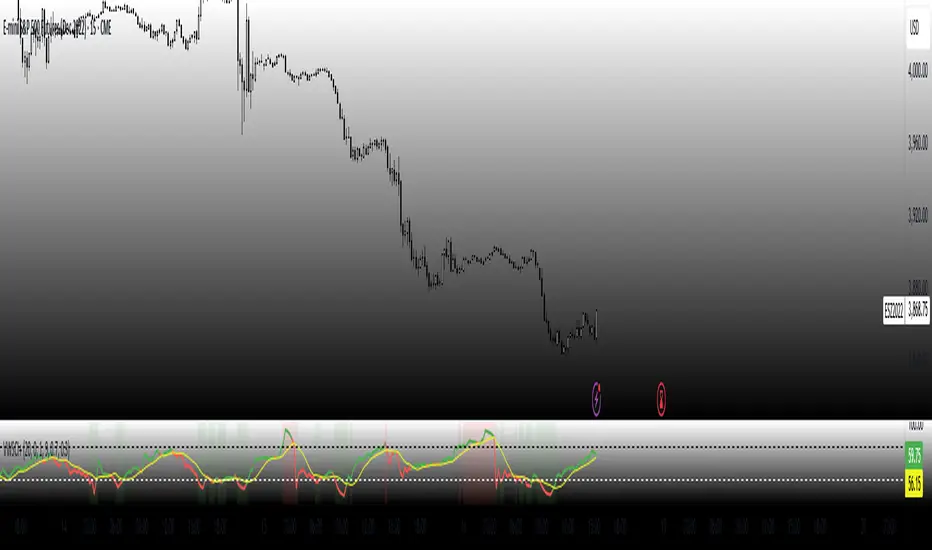
VWAPv6The VWAP ( Volume Weighted Average Price ) Deviation script is a powerful tool designed for traders to analyze the relationship between price and volume . By calculating deviations around the VWAP , the script allows users to identify key support and resistance levels that can help in making better-informed trading decisions.
The script calculates VWAP based on the chosen data source (default is closing price) and then computes deviations above and below the VWAP using either the Average Deviation or the Standard Deviation method. The user can select the desired method through the script's input options. These deviations are then plotted as bands on the chart, providing a visual representation of the areas where the price may potentially revert or experience a breakout.
A unique and valuable feature of this script is the addition of a monitor that counts the number of times the price crosses above the Upper Deviation level 2 and below the Lower Deviation level 2 within a user-defined lookback period. This monitor is displayed as a table in the bottom right corner of the chart and can be enabled or disabled through an input option.
The cross count monitor serves as a valuable aid to traders by providing insights into the historical frequency of price crossing the deviation levels. This information can be used to identify potential trading opportunities based on historical price behavior around these levels.
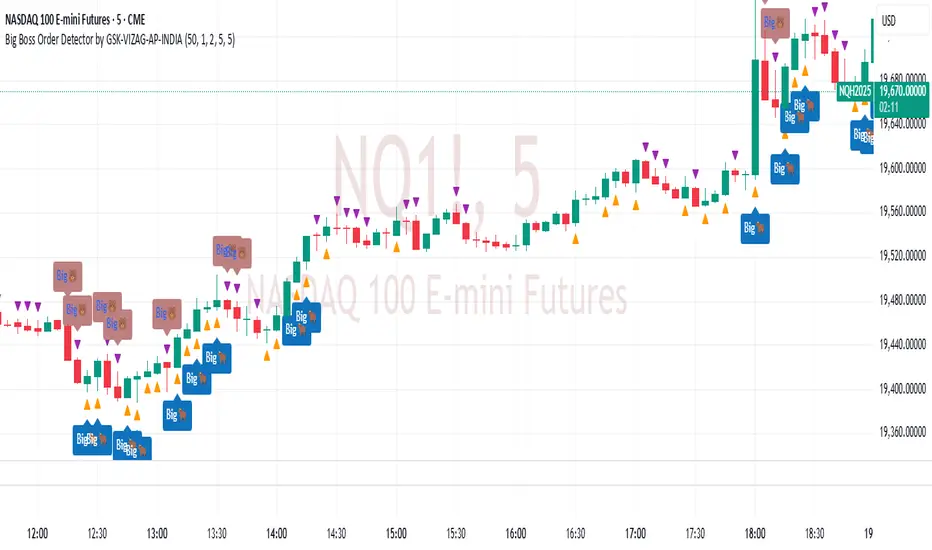
Big Boss Order Detector by GSK-VIZAG-AP-INDIABig Boss Order Detector by GSK-VIZAG-AP-INDIA
Overview
The Big Boss Order Detector is designed to help traders identify significant buying and selling activity based on volume and price action. It filters out normal transactions and highlights large institutional orders, helping traders spot potential smart money movements.
This indicator classifies large orders into two categories:
Large Orders – These are detected when the volume exceeds a predefined multiple of the volume SMA, with minimal price movement between open and close.
High Volume Orders – Stricter conditions apply, where volume is even higher, and the price movement remains within a tighter threshold.
By tracking these key market activities, traders can gain insights into potential reversals, breakouts, or the presence of institutional buying and selling.
How It Works
The indicator calculates a Simple Moving Average (SMA) of volume over a user-defined period (default: 50 candles). It then sets two volume-based thresholds:
Large Orders: When the volume is greater than a multiple (default: 2×) of the SMA and price movement between open and close is within a certain percentage threshold (default: 0.05%).
High Volume Orders: When the volume surpasses an even higher threshold (default: 3× the SMA) with stricter price movement (default: 0.02%).
Key Conditions for Order Detection
Large Buy Order: Volume exceeds the threshold, and the closing price is greater than the opening price.
Large Sell Order: Volume exceeds the threshold, and the closing price is lower than the opening price.
High Volume Buy Order: A stricter volume condition is met, and the price closes higher than it opened.
High Volume Sell Order: A stricter volume condition is met, and the price closes lower than it opened.
Indicator Features
🔹 Visual Signals on Chart
Orange Up Arrow (▲) → Large Buy Order
Purple Down Arrow (▼) → Large Sell Order
"Big🐂" (Blue Label Up) → High Volume Buy Order
"Big🐻" (Red Label Down) → High Volume Sell Order
🔹 Alerts for Trading Opportunities
Large Orders Alerts: Notifies when a large buy or sell order is detected.
High Volume Orders Alerts: Identifies potential high volume buy or sell orders.
Traders can set up these alerts in TradingView for real-time notifications.
Use Cases & Trading Insights
Detect High-Impact Trades: Large orders often indicate activity from big market participants who can influence price movements.
Confirm Trend Strength: When large buy orders appear in an uptrend, it may signal trend continuation. Similarly, large sell orders in a downtrend could confirm further weakness.
Spot Potential Reversals: High-volume orders with limited price movement may suggest accumulation (bullish) or distribution (bearish).
🔹 ⚠️ Important Note:
Not every large buy represents fresh buying; some could be short covering. Similarly, large selling could be long liquidation rather than fresh shorting. Always use this indicator with other technical tools and risk management strategies.
Additional Tip: Using This Indicator on Heikin-Ashi Charts
While this indicator is designed for standard candlestick charts, traders who use Heikin-Ashi candles may find it helpful for smoother trend visualization. Since Heikin-Ashi modifies price calculations, volume-based signals may appear slightly different compared to regular candles. Use it as a complementary tool rather than a strict signal generator.
Customization Options
Volume SMA Length (default: 50 candles) – Adjust the sensitivity of volume detection.
Volume Multipliers – Change the thresholds for detecting large and high-volume orders.
Price Difference Thresholds – Modify how strictly price movements are considered for filtering orders.
This flexibility allows traders to fine-tune the indicator to match different trading styles and asset classes.
Importance of Input Settings.
Setting Recommended Values Purpose
Volume SMA Length 20, 30, 50 Defines the baseline average volume for comparison. A shorter SMA (20) reacts faster, while a longer SMA (50) smooths out fluctuations.
Large Order Multiplier 1, 2, 3 Determines how much higher the volume should be compared to the SMA to qualify as a large order. A lower value captures more signals; a higher value filters out noise.
High Volume Order Multiplier 1.5, 2, 2.5 Stricter volume threshold for detecting high-impact trades. Use higher values for highly liquid markets.
Price Difference Threshold (Points) 5, 10, or more Defines the max allowed difference between open and close for large orders. Higher values capture more trades but may include noise.
High Volume Price Threshold (Points) 20 or based on price Stricter price movement condition for high-volume orders. For low-priced stocks, 20 points may be too much—adjust based on asset volatility.
The effectiveness of this indicator depends on its input settings, as they allow traders to fine-tune the detection of high-impact trades based on market conditions. Adjusting parameters like Volume SMA Length, Volume Multipliers, and Price Difference Thresholds can help optimize signals for different assets, timeframes, and volatility levels.
For best results, experiment with these settings and adapt them to suit your trading strategy.
Final Thoughts
The Big Boss Order Detector is a powerful tool for tracking institutional activity and understanding volume dynamics in the market. However, it should be used alongside other indicators and price action analysis to make informed trading decisions.
Give it a try and enhance your market insights! 🚀📈
📢 Share Your Experience!
Your feedback is valuable! If you find this indicator useful, leave a comment with your experience—how it worked for you, any improvements you suggest, or the best settings you discovered.
Let’s build a community of traders refining strategies together! 🚀📊
Disclaimer:
This indicator is for educational and informational purposes only. It does not guarantee profitable trades and should be used with proper risk management. Always conduct your own research before making trading decisions.
VWAP anchored with Previous VWAPVWAP with Persistent Previous VWAP Levels
🔹 Overview
This indicator calculates and displays Daily, Weekly, and Monthly VWAP (Volume Weighted Average Price) along with their previous period VWAP levels, helping traders analyze key price points used by institutional players. Unlike traditional VWAP indicators that reset at the start of each period, this script extends the previous VWAP levels across the current period, providing strong reference points for support and resistance.
🔹 Key Features
✅ Multiple Timeframe VWAPs – Displays Daily, Weekly, and Monthly VWAPs for better trend analysis.
✅ Persistent Previous VWAPs – Keeps and extends previous period VWAP levels as horizontal lines.
✅ Customizable Appearance – Modify colors, line widths, and visibility of each VWAP level.
✅ VWAP Labels – Optional labels for quick reference to VWAP and previous VWAP values.
✅ Efficient Calculation – Optimized for smooth performance on all chart timeframes.
🔹 How It Works
VWAP Calculation
Uses hlc3 (high + low + close) / 3 as the default VWAP price source.
Accumulates price-volume data within each time period (day, week, or month).
Previous VWAP Line Extension
When a new period begins, the final VWAP value of the previous period is stored.
A horizontal line is drawn at this level and extends across the current period.
Customizable Display
Enable/disable Daily, Weekly, and Monthly VWAPs independently.
Choose colors for VWAP and Previous VWAP lines.
Toggle labels for better visibility.
🔹 Why Use This Indicator?
📌 Identify Institutional Trading Zones – VWAP is widely used by hedge funds, banks, and algorithmic traders.
📌 Detect Key Support & Resistance Levels – Previous VWAP levels act as dynamic support and resistance.
📌 Improve Trade Entries & Exits – Use VWAP bounces and breaks for confirmation.
📌 Works on All Timeframes – Useful for scalpers, swing traders, and long-term investors.
🔹 Best Use Cases
📍 Trend Confirmation – Price above VWAP suggests an uptrend; below VWAP indicates a downtrend.
📍 Support & Resistance Trading – Use previous VWAP levels as key reaction zones.
📍 Breakout & Mean Reversion Strategies – Combine with price action for high-probability trades.
📢 Try it out and elevate your trading strategy with institutional-grade VWAP levels! 🚀

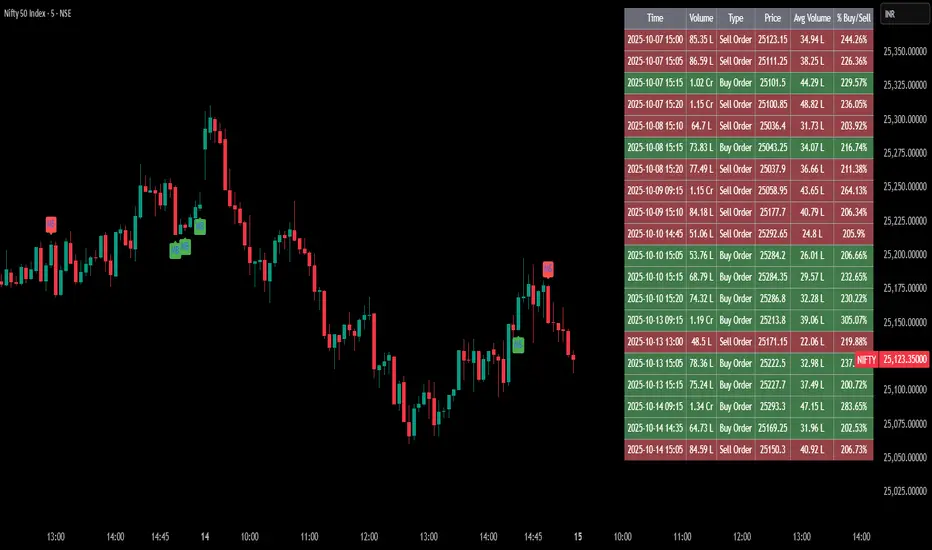
Massive Market Order Detector by GSK-VIZAG-AP-INDIA
Massive Market Order Detector by GSK-VIZAG-AP-INDIA
Purpose of the Indicator:
This indicator is designed to detect massive market orders (high-volume trades) in real-time, helping traders identify potential accumulation or distribution zones. It highlights sudden spikes in volume that exceed a calculated threshold, signaling strong buying or selling pressure.
Core Logic & Unique Aspects:
Volume Spike Detection: Compares the current volume to the average volume over a user-defined lookback period. If the volume exceeds the threshold (calculated using a multiplier), it is classified as a Massive Order.
Buy vs. Sell Order Identification: Determines whether the detected massive order is a buy (green marker) or a sell (red marker) based on candlestick price action.
Time Zone Adjustment: Allows traders to adjust the timestamp according to their local timezone, ensuring accurate interpretation of order timings.
Table Display of Recent Orders: A table is created within the chart to list the last 15 detected massive orders, showing key details such as time, volume, type (buy/sell), price, and volume percentage change.
How It Works:
The indicator calculates the average volume over a lookback period (default: 20 bars).
If the current volume exceeds the threshold (average volume × multiplier), it is marked as a Massive Order.
The order is classified as:
Massive Buy Order (MB) → If the closing price is higher than the opening price.
Massive Sell Order (MS) → If the closing price is lower than the opening price.
The detected orders are visually represented as green (MB) and red (MS) labels on the chart.
The most recent 15 massive orders are logged in a table for easy reference.
Intended Use Cases:
🔹 Scalping & Intraday Trading – Spot unusual market activity to enter or exit trades quickly.
🔹 Swing Trading – Identify strong buying or selling pressure at key support/resistance levels.
🔹 Breakout Confirmation – Validate if price breakouts are backed by significant volume.
🔹 Market Manipulation Detection – Recognize potential institutional buying/selling activity.
Input settings:
Lookback Period: Adjust the number of bars to calculate average volume.
Volume Multiplier: Set the threshold as 1/2/3 for defining a massive order.
Time Zone Offset: Modify timestamps to match your local market time.
Max Signals in Table: Control how many signals are displayed in the table.
Why Use This Indicator?
✅ Identifies smart money activity
✅ Works across multiple timeframes (5m, 15m, 1H, Daily, etc.)
✅ No repainting – Reliable real-time signals
✅ Easy-to-read visual cues & table logs
Disclaimer:
"This indicator is for educational and informational purposes only and should not be considered financial advice. Always do your own research (DYOR) and consult with a qualified financial professional before making investment decisions. Trading involves significant risk, and past performance does not guarantee future results. I am not a licensed financial advisor and hold no liability for any losses incurred. This indicator may not work in all market conditions, and results are based on backtesting or hypothetical scenarios. Use at your own discretion and ensure compliance with local regulations."
VWAP Balance Zones - SessionsVWAP Balance Zones Sessions Version is an alternate take on the Original VWAP Balance Zones indicator. The Sessions version allows users to select a specific session to view the VWAP Balance Zones at while still utilizing the full ETH Data.
The Session version provides a better focused display while still maintaining the core functions of the original script with mindful optimizations.
Author's Note: "VBZ Sessions was made with logistics in mind, for the users who only trade within certain times of the day. While it displays the same core concepts, it is not as "Raw" of a display as the Original. For this reason, some users may prefer the Original VWAP Balance Zones, which is why I have opted to release this alternate version instead of updating the original."
> What are VWAP Balance Zones?
"VWAP Balance Zones" is an original concept aimed at identifying the equilibrium area between market participants within the current trend by averaging the Daily Extremes and the Daily VWAP.
Refer to the illustration below for a better understanding of exactly how VWAP Balance Zones are formed:
These zones are displayed for the Daily, Weekly, and Monthly VWAPs, with the most interactive timeframe being the Daily.
> Features
1. The Session Version uses ETH data at all times, and does not solely rely on the chart's data to create the VWAPs or Zones.
This allows the user to focus on a specific trading session, while not losing out on the full VBZ Calculation, with the notable benefit of a cleaner display.
The Original VBZ starts drawing at the beginning of the chart's "Day", and would produce different results when using an RTH chart vs an ETH chart. Along with creating a bird's nest of unusable data at the beginning of the day.
2. Session Start and End lines are displayed for easier identification of the designated trading session.
3. The extreme "Close" Lines are no longer displayed to reduce noise and redundancy.
4. Additionally, the interior VWAP lines are no longer displayed. Ultimately, this was to reduce noise and focus the script on the 50% zones.
5. Weekly and Monthly Zones are now displayed due to the reduced noise!
6. As with the original, the weekly display will yield to the daily, and the monthly display will yield to the weekly.
In the screenshot below, you can observe this behavior.
Enjoy!
Multiple AVWAP [OmegaTools]The Multiple AVWAP indicator is a sophisticated trading tool designed for professional traders who require precision in volume-weighted price tracking. This indicator allows for the deployment of multiple Anchored Volume Weighted Average Price (AVWAP) calculations simultaneously, offering deep insights into price movements, dynamic support and resistance levels, and trend structures across multiple timeframes.
This indicator caters to both institutional and retail traders by integrating flexible anchoring methods, multi-timeframe adaptability, and enhanced visualization features. It also includes deviation bands for statistical analysis, making it a comprehensive volume-based trading solution.
Key Features & Functionalities
1. Multiple AVWAP Configurations
Users can configure up to four distinct AVWAP calculations to track different market conditions.
Supports various anchoring methods:
Fixed: A traditional AVWAP that starts from a defined historical point.
Perpetual: A rolling VWAP that continuously adjusts over time.
Extension: An extension-based AVWAP that projects from past calculations.
High Volume: Anchors AVWAP to the highest volume bar within a specified period.
None: Option to disable AVWAP calculation if not required.
2. Advanced Deviation Bands
Implements standard deviation bands (1st and 2nd deviation) to provide a statistical measure of price dispersion from the AVWAP.
Serves as a dynamic method for identifying overbought and oversold conditions relative to VWAP pricing.
Deviation bands are customizable in terms of visibility, color, and transparency.
3. Multi-Timeframe Support
Users can assign different timeframes to each AVWAP calculation for macro and micro analysis.
Helps in identifying long-term institutional trading levels alongside short-term intraday trends.
4. Z-Score Normalization Mode
Option to standardize oscillator values based on AVWAP deviations.
Converts price movements into a statistical Z-score, allowing traders to measure price strength in a normalized range.
Helps in detecting extreme price dislocations and mean-reversion opportunities.
5. Customizable Visual & Aesthetic Settings
Fully customizable line colors, transparency, and thickness to enhance clarity.
Users can modify AVWAP and deviation band colors to distinguish between different levels.
Configurable display options to match personal trading preferences.
6. Oscillator Mode for Trend & Momentum Analysis
The indicator converts price deviations into an oscillator format, displaying AVWAP strength and weakness dynamically.
This provides traders with a momentum-based perspective on volume-weighted price movements.
User Guide & Implementation
1. Configuring AVWAPs for Optimal Use
Choose the mode for each AVWAP instance:
Fixed (set historical point)
Perpetual (rolling, continuously updated AVWAP)
Extension (projection from past AVWAP levels)
High Volume (anchored to highest volume bar)
None (disables the AVWAP line)
Adjust the length settings to fine-tune calculation sensitivity.
2. Utilizing Deviation Bands for Market Context
Activate deviation bands to see statistical boundaries of price action.
Monitor +1 / -1 and +2 / -2 standard deviation levels for extended price movements.
Consider price action outside of deviation bands as potential mean-reversion signals.
3. Multi-Timeframe Analysis for Institutional-Level Insights
Assign different timeframes to each AVWAP to compare:
Daily VWAP (institutional trading levels)
Weekly VWAP (swing trading trends)
Intraday VWAPs (short-term momentum shifts)
Helps identify where institutional liquidity is positioned relative to price.
4. Activating the Oscillator for Momentum & Bias Confirmation
The oscillator converts AVWAP deviations into a normalized value.
Use overbought/oversold levels to determine strength and potential reversals.
Combine with other indicators (RSI, MACD) for confluence-based trading decisions.
Trading Applications & Strategies
5. Trend Confirmation & Institutional VWAP Tracking
If price consistently holds above the primary AVWAP, it signals a bullish trend.
If price remains below AVWAP, it indicates selling pressure and a bearish trend.
Monitor retests of AVWAP levels for potential trend continuation or reversal.
6. Dynamic Support & Resistance Levels
AVWAP lines act as dynamic floating support and resistance zones.
Price bouncing off AVWAP suggests continuation, whereas breakdowns indicate a shift in momentum.
Look for confluence with high-volume zones for stronger trade signals.
7. Mean Reversion & Statistical Edge Trading
Prices that deviate beyond +2 or -2 standard deviations often revert toward AVWAP.
Mean reversion traders can fade extended moves and target AVWAP re-tests.
Helps in identifying exhaustion points in trending markets.
8. Institutional Liquidity & Volume Footprints
Institutions often execute large trades near VWAP zones, causing price reactions.
Tracking multi-timeframe AVWAP levels allows traders to anticipate key liquidity areas.
Use higher timeframe AVWAPs as macro support/resistance for swing trading setups.
9. Enhancing Momentum Trading with AVWAP Oscillator
The oscillator provides a momentum-based measure of AVWAP deviations.
Helps in confirming entry and exit timing for trend-following trades.
Useful for pairing with stochastic oscillators, MACD, or RSI to validate trade decisions.
Best Practices & Trading Tips
Use in Conjunction with Volume Analysis: Combine with volume profiles, OBV, or CVD for increased accuracy.
Adjust Timeframes Based on Trading Style: Scalpers can focus on short-term AVWAP, while swing traders benefit from weekly/daily AVWAP tracking.
Backtest Different AVWAP Configurations: Experiment with different anchoring methods and lookback periods to optimize trade performance.
Monitor Institutional Order Flow: Identify key VWAP zones where institutional traders may be active.
Use with Other Technical Indicators: Enhance trading confidence by integrating with moving averages, Bollinger Bands, or Fibonacci retracements.
Final Thoughts & Disclaimer
The Multiple AVWAP indicator provides a comprehensive approach to volume-weighted price tracking, making it ideal for professional traders. While this tool enhances market clarity and trade decision-making, it should be used as part of a well-rounded trading strategy with risk management principles in place.
This indicator is provided for informational and educational purposes only. Trading involves risk, and past performance is not indicative of future results. Always conduct your own analysis and due diligence before executing trades.
OmegaTools - Enhancing Market Clarity with Precision Indicators
Capitulation Volume Detector by @RhinoTradezOverview
Hey traders, want to catch the market when it’s totally losing it? The Capitulation Volume Detector is your go-to buddy for spotting those wild moments when panic selling takes over. Picture this: prices plummet, volume explodes, and everyone’s bailing out—that’s capitulation, and it might just signal a turning point. This script throws a bright marker on your chart whenever the chaos hits, so you can decide if it’s time to jump in or sit tight. Built fresh in Pine Script v6, it’s sleek, customizable, and packs an alert to keep you posted—perfect for stocks, indices like SPY, or even crypto chaos.
Inspired by epic sell-offs like March 2020’s COVID crash, this tool’s here to help you navigate the storm with a smile (and maybe a profit).
What It Does
Capitulation volume is that “everyone’s out!” moment: a steep price drop meets a massive volume surge, hinting that sellers are tapped out. It’s not a guaranteed reversal—sometimes the bleeding continues—but it’s a loud clue that fear’s peaked. Here’s the magic:
Volume Check : Measures current volume against a customizable average (default: 20 bars).
Price Plunge : Tracks the percentage drop from the last close.
Capitulation Cal l: When volume rockets past your threshold (e.g., 2x average) and price tanks (e.g., -5%), you get a red triangle above the bar.
Stay Alert : Fires off a detailed message (e.g., “Volume 300M > 200M, Drop -10%”) so you’re never caught off guard.
Think of it as your market meltdown radar—simple, effective, and ready to roll.
Functionality Breakdown
Volume Surge Spotter :
Uses a 20-bar Simple Moving Average (SMA) of volume as your baseline.
Flags any bar where volume exceeds this average by your chosen multiplier (default: 2x).
Price Drop Detector :
Calculates the percentage change from the prior close.
Triggers when the drop’s bigger than your set limit (default: -5%).
Capitulation Marker:
Combines both signals: high volume + sharp drop = capitulation.
Slaps a red triangle above the bar for instant “whoa, there it is!” vibes.
Real-Time Alerts :
Sends a custom alert with volume and drop details, keeping you in the loop without babysitting the chart.
Customization Options
Tune it to your trading style with these easy settings:
Volume Multiplier (x Avg): Starts at 2.0 (2x average volume). Bump it to 3.0 for only the wildest spikes or dial it to 1.5 for more frequent catches. Range: 1.0-10.0, step 0.1.
Price Drop Threshold (%): Default 5.0 (a -5% drop). Go big with 10.0 for crash-level falls or ease to 3.0 for lighter dips. Range: 1.0-20.0, step 0.1.
Average Volume Period: Default 20 bars. Stretch it to 50 for a broader view or shrink to 10 for quick reactions. Range: 1-100.
Capitulation Marker Color: Red by default—because panic’s loud! Switch it to blue, green, or pink to match your chart’s personality.
How to Use It
Drop It On : Add it to any chart with volume data—SPY daily for market moves, /ES 15-minute for intraday action, or your go-to stock.
Play with Settings : Hit the indicator’s config gear and tweak the multiplier, drop threshold, period, or marker color to fit your vibe.
Set an Alert : Right-click the indicator, add an alert with “Any alert() function call,” and get pinged when capitulation strikes.
Watch the Action : Look for those red triangles on big drop days—pair with your favorite reversal signals for extra oomph.
Pro Tips
Daily Charts : Catch market-wide capitulations like March 23, 2020 (SPY: -10%, 3x volume).
Intraday : Spot flash crashes or sector sell-offs on 15-minute or 5-minute bars.
Context Matters : High volume alone isn’t enough—check the VIX or candlestick patterns (e.g., hammers) to confirm a bottom.
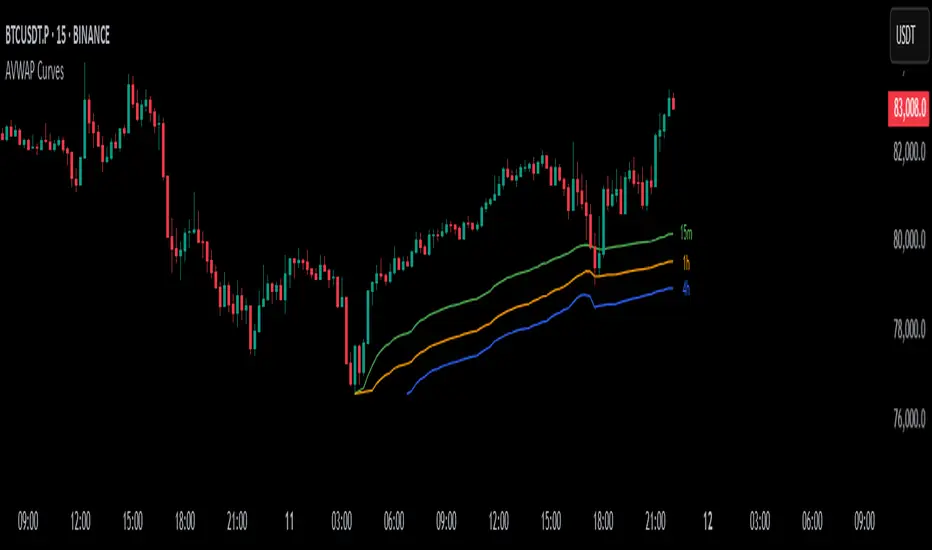
AVWAP CurvesThis indicator calculates and displays Anchored Volume-Weighted Average Price (AVWAP) for the 15-minute, 1-hour, and 4-hour timeframes. It helps identify volume-weighted support/resistance levels and trends based on volume and price data.
Multiple Timeframes: Displays AVWAP curves for 15m, 1h, and 4h. Users can toggle visibility for each timeframe.
Price Anchor Selection: Choose between Low, High, or HL2 as the price anchor for the AVWAP calculation.
Custom Date & Time Anchor: Set a specific start time for the AVWAP calculation.
Alerts: Alerts are triggered when the price crosses above or below any AVWAP curve.
Volume Weighted Sign ChangeThe VWSCI measures the relationship between price reversals and volume. Specifically, it calculates the proportion of total volume in a given window that occurs at bars where the price changes direction—i.e., where the price difference switches from positive to negative or vice versa, indicating a local maximum or minimum.
• Low VWSCI values (close to 0) suggest that little volume is associated with price reversals, which typically occurs in strong trending markets where price moves consistently in one direction with high volume, and pullbacks (if any) occur on low volume.
• High VWSCI values (closer to 100) indicate that a significant portion of the volume is tied to price turning points, which is characteristic of a ranging or choppy market with frequent reversals.
This approach combines price action (via sign changes in price differences) and volume, offering a novel twist on traditional momentum or volume-based indicators like RSI, OBV, or the Volume-Price Trend.
FTB Smart Trader System — Market Maker Levels, EMAs & VectorsThe FTB Trade Engine is an indicator suite I built for myself as a crypto trader. It's designed specifically for trading Institution levels, EMAs, PVSRA Volume Candles, and Session Timings. It helps me spot high probability trade setups without overcomplicating things.
🔑 Features of this Indicator
📌 🔥 Key Session Levels (extend lines in settings as needed)
✅ Weekly High & Low (HOW/LOW) — Automatically plots the previous week's high and low
✅ Daily High & Low (HOD/LOD) — Marks the prior day's range
✅ Asia Session High & Low — Plots the Asian session’s high and low, helping you detect potential breakouts or fakeouts, as Asia often sets the initial high and low of the day.
✅ 50% Asia Level — Automatically calculates and displays the midpoint between Asia’s high and low, an important level for intraday trading.
📌 🔥 Advanced EMA Suite
✅ Includes 10, 20, 50, 200, and 800 EMAs — providing key zones of support, resistance, and trend direction.
👀 Good to know: the break of the 50EMA WITH a vector candle is significant for reversals.
📌 🔥 PVSRA Candles
(👀 IMPORTANT: To properly view PVSRA candles, make sure to UNCHECK all default candle settings — Color Bars, Body, Borders, and Wick — in your chart's candle settings.)
✅ Price, Volume, Support & Resistance Analysis (PVSRA) Candles — These special candles combine price action with volume analysis, color-coded to highlight areas potentially influenced by market makers, institutions, and large players. Perfect for identifying key volume zones and quickly analyzing any coin or pair without switching tools.
Candle Colors Explained:
Bullish Candles:
🟢 Green — 200% increase in volume on bullish moves (strong buyer presence).
🔵 Blue — 150% increase in bullish volume, but may also indicate fatigue or possible reversal.
⚪ White — Normal bullish volume (standard green candles).
Bearish Candles:
🔴 Red — 200% increase in bearish volume compared to the last 10 candles (strong selling).
🟣 Magenta — 150% increase in bearish volume, signaling possible continuation or exhaustion.
⚫ Gray — Normal bearish volume (standard red candles).

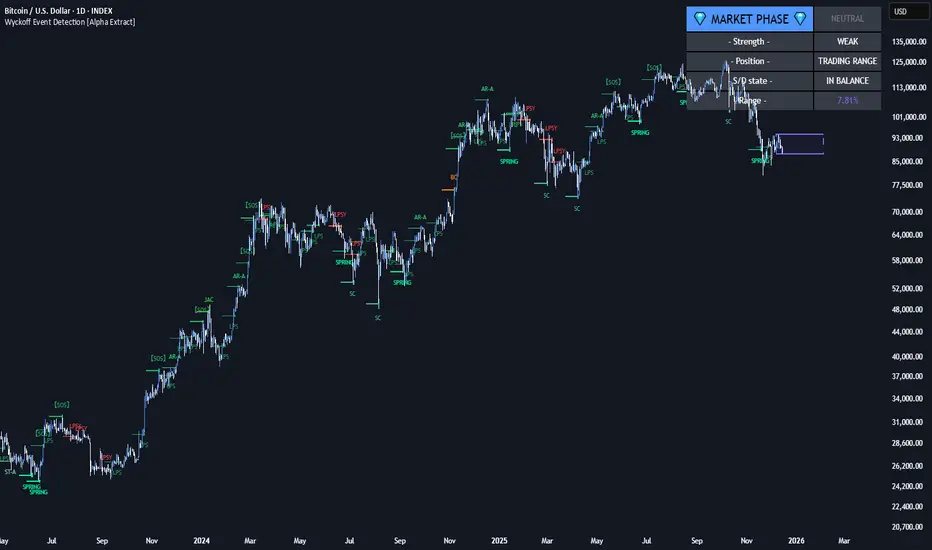
Wyckoff Event Detection [Alpha Extract]Wyckoff Event Detection
A powerful and intelligent indicator designed to detect key Wyckoff events in real time, helping traders analyze market structure and anticipate potential trend shifts. Using volume and price action, this script automatically identifies distribution and accumulation phases, providing traders with valuable insights into market behavior.
🔶 Phase-Based Detection
Utilizes a phase detection algorithm that evaluates price and volume conditions to identify accumulation (bullish) and distribution (bearish) events. This method ensures the script effectively captures major market turning points and avoids noise.
🔶 Multi-Factor Event Recognition
Incorporates multiple event conditions, including upthrusts, selling climaxes, and springs, to detect high-probability entry and exit points. Each event is filtered through customizable sensitivity settings, ensuring precise detection aligned with different trading styles.
🔶 Customizable Parameters
Fine-tune event detection with adjustable thresholds for volume, price movement, trend strength, and event spacing. These inputs allow traders to personalize the script to match their strategy and risk tolerance.
// === USER INPUTS ===
i_volLen = input.int(20, "Volume MA Length", minval=1)
i_priceLookback = input.int(20, "Price Pattern Lookback", minval=5)
i_lineLength = input.int(15, "Line Length", minval=5)
i_labelSpacing = input.int(5, "Minimum Label Spacing (bars)", minval=1, maxval=20)
❓How It Works
🔶 Event Identification
The script scans for key Wyckoff events by analyzing volume spikes, price deviations, and trend shifts within a user-defined lookback period. It categorizes events into bullish (accumulation) or bearish (distribution) structures and plots them directly on the chart.
// === EVENT DETECTION ===
volMA = ta.sma(volume, i_volLen)
highestHigh = ta.highest(high, i_priceLookback)
lowestLow = ta.lowest(low, i_priceLookback)
🔶 Automatic Filtering & Cleanup
Unconfirmed or weak signals are filtered out using customizable strength multipliers and volume thresholds. Events that do not meet the minimum conditions are discarded to keep the chart clean and informative.
🔶 Phase Strength Analysis
The script continuously tracks bullish and bearish event counts to determine whether the market is currently in an accumulation, distribution, or neutral phase. This allows traders to align their strategies accordingly.
🔶 Visual Alerts & Labels
Detects and labels key Wyckoff events directly on the chart, providing immediate insights into market conditions:
- PSY (Preliminary Supply) and UT (Upthrust) for distribution phases.
- PS (Preliminary Support) and SC (Selling Climax) for accumulation phases.
- Labels adjust dynamically to avoid chart clutter and improve readability.
🔶 Entry & Exit Optimization
By highlighting supply and demand imbalances, the script assists traders in identifying optimal entry and exit points. Wyckoff concepts such as springs and upthrusts provide clear trade signals based on market structure.
🔶 Trend Confirmation & Risk Management
Observing how price reacts to detected events helps confirm trend direction and potential reversals. Traders can place stop-loss and take-profit levels based on Wyckoff phase analysis, ensuring strategic trade execution.
🔶 Table-Based Market Analysis (Table)
A built-in table summarizes:
- Market Phase: Accumulation, Distribution, or Neutral.
- Strength of Phase: Weak, Moderate, or Strong.
- Price Positioning: Whether price is near support, resistance, or in a trading range.
- Supply/Demand State: Identifies whether the market is supply or demand dominant.
🔶 Why Choose Wyckoff Market Phases - Alpha Extract?
This indicator offers a systematic approach to understanding market mechanics through the lens of Wyckoff's time-tested principles. By providing clear and actionable insights into market phases, it empowers traders to make informed decisions, enhancing both confidence and performance in various trading environments.
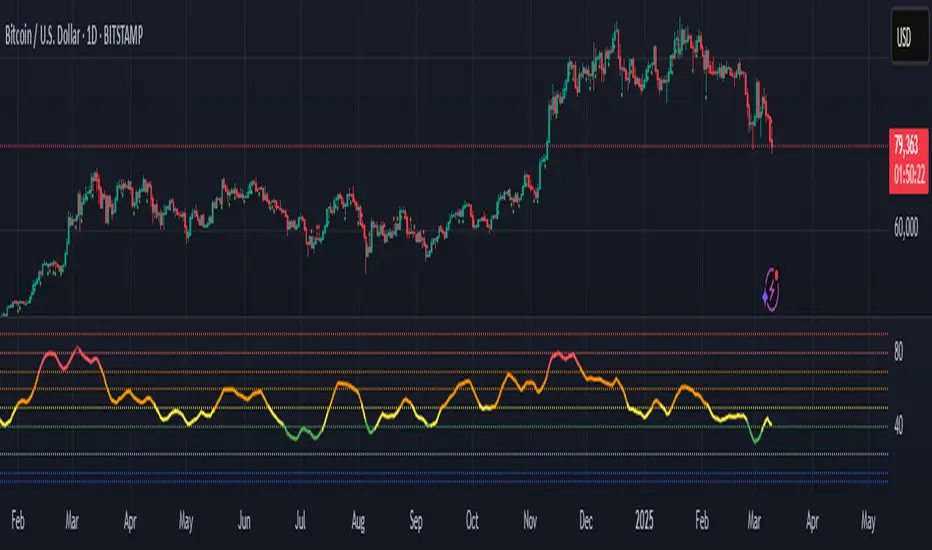
Custom TABI Model with LayersCustom Top and Bottom Indicator (TABI) (Is a Trend Adaptive Blow-Off Indicator) -
User Guide & Description
Introduction
The TABI (Trend Adaptive Blow-Off Indicator) is a refined, multi-layered RSI tool designed to enhance trend analysis, detect momentum shifts, and highlight overbought/oversold conditions with a more nuanced, color-coded approach. This indicator is useful for traders seeking to identify key reversal points, confirm trend strength, and filter trade setups more effectively than traditional RSI.
By incorporating volume-based confirmation and divergence detection, TABI aims to reduce false signals and improve trade timing.
How It Works
TABI builds on the Relative Strength Index (RSI) by introducing:
A smoothed RSI calculation for better trend readability.
11 color-coded RSI levels, allowing traders to visually distinguish weak, neutral, and extreme conditions.
Volume-based confirmation to detect high-conviction moves.
Bearish & Bullish Divergence Detection, inspired by Market Cipher methods, to spot potential reversals early.
Overbought & Oversold alerts, with optional candlestick color changes to highlight trade signals.
Key Features
✅ Color-Coded RSI for Better Readability
The RSI is divided into multi-layered color zones:
🔵 Light Blue: Extremely oversold
🟢 Lime Green: Mild oversold, potential trend reversal
🟡 Yellow & Orange: Neutral, momentum consolidation
🟠 Dark Orange: Caution, overbought conditions developing
🔴 Red: Extreme overbought, possible exhaustion
✅ Divergence Detection
Bearish Divergence: Price makes higher highs, RSI makes lower highs → Potential top signal
Bullish Divergence: Price makes lower lows, RSI makes higher lows → Potential bottom signal
✅ Volume Confirmation Filter
Requires a 50% above-average volume spike for strong buy/sell signals, reducing false breakouts.
✅ Dynamic Labels & Alerts
🚨 Blow-Off Top Warning: If RSI is overbought + volume spikes + divergence detected
🟢 Oversold Bottom Alert: If RSI is oversold + bullish divergence
Candlestick color changes when extreme conditions are met.
How to Use
📌 Entry & Exit Signals
Buy Consideration:
RSI enters Green Zone (oversold)
Bullish divergence detected
Volume confirms the move
Sell Consideration:
RSI enters Red Zone (overbought)
Bearish divergence detected
Volume confirms exhaustion
📌 Trend Confirmation
Use the yellow/orange levels to confirm strong trends before entering counter-trend trades.
📌 Filtering Trade Noise
The RSI smoothing helps reduce false whipsaws, making it easier to read true momentum shifts.
Customization Options
🔧 User-Defined RSI Thresholds
Adjust the overbought/oversold levels to match your trading style.
🔧 Divergence Sensitivity
Modify the lookback period to fine-tune divergence detection accuracy.
🔧 Volume Thresholds
Set custom volume multipliers to control confirmation requirements.
Why This is Unique
🔹 Unlike traditional RSI, TABI visually maps RSI zones into layered gradients, making it easy to spot momentum shifts.
🔹 The multi-layered color scheme adds an intuitive, heatmap-like effect to RSI, helping traders quickly gauge conditions.
🔹 Incorporates CCF-inspired divergence detection and volume filtering, making signals more robust.
🔹 Dynamic labeling system ensures clarity without cluttering the chart.
Alerts & Notifications
🔔 TradingView Alerts Included
🚨 Blow-Off Top Detected → RSI overbought + volume spike + bearish divergence.
🟢 Oversold Bottom Detected → RSI oversold + bullish divergence.
Set alerts to receive notifications without watching the charts 24/7.
Final Thoughts
TABI is designed to simplify RSI analysis, provide better trade signals, and improve decision-making. Whether you're day trading, swing trading, or long-term investing, this tool helps you navigate market conditions with confidence.
🔥 Use it to detect high-probability reversals, confirm trends, and improve trade entries/exits! 🚀
Liquidity Market Seeking SwiftEdgeThis indicator is designed to identify potential liquidity levels on the chart by detecting swing highs and lows, which are often areas where stop-loss orders or significant orders accumulate. It visualizes these levels with horizontal lines and labels on the right side of the chart, color-coded based on volume to help traders understand where the market might seek liquidity.
How It Works
Swing Highs and Lows: The indicator uses the ta.pivothigh and ta.pivotlow functions to identify significant swing points over a user-defined lookback period (Swing Length). These points are considered potential liquidity levels where stop-loss orders might be placed.
Volume Analysis: The indicator compares the volume at each swing point to the average volume over a specified period (Volume Average Length). Levels with above-average volume are colored red, indicating higher liquidity, while levels with below-average volume are colored green.
Liquidity Visualization: Horizontal dashed lines are drawn at each identified level, extending across the chart. Labels on the right side display the estimated liquidity amount (simulated based on volume and a multiplier, Volume Multiplier for Liquidity).
Sell Signal: A "SELL NOW" label appears when the price approaches a liquidity level after an uptrend (detected using a simple moving average crossover). This suggests a potential reversal as the market may target liquidity at that level.
Strategy Concept: Market Seeking Liquidity
The indicator is based on the concept that markets often move toward areas of high liquidity, such as clusters of stop-loss orders or significant order accumulations. These liquidity pools are typically found around swing highs and lows, where traders place their stop-losses or large orders. By identifying these levels and highlighting those with higher volume (red lines), the indicator aims to show where the market might move to "grab" this liquidity. For example, after an uptrend, the market may reverse at a swing high to take out stop-losses above that level, providing liquidity for larger players to enter or exit positions.
Settings
Swing Length: The number of bars to look back for detecting swing highs and lows. Default is 20.
Liquidity Threshold: The price threshold for merging nearby levels to avoid duplicates. Default is 0.001.
Volume Average Length: The period for calculating the average volume to compare against. Default is 20.
Volume Multiplier for Liquidity: A multiplier to scale the volume into a simulated liquidity amount (displayed as "K"). Default is 1000.
Usage Notes
Use this indicator on any timeframe, though it may be more effective on higher timeframes (e.g., 1H, 4H) where swing points are more significant.
Red lines indicate levels with higher volume, suggesting stronger liquidity pools that the market might target.
Green lines indicate levels with lower volume, which may be less significant.
The "SELL NOW" signal is a basic example of how to use liquidity levels for trading decisions. It appears when the price approaches a liquidity level after an uptrend, but it should be used in conjunction with other analysis.
Adjust the Volume Multiplier for Liquidity to scale the displayed liquidity amounts based on your instrument (e.g., forex pairs may need a higher multiplier than indices).

THMA VWAP Oscillator [by Oberlunar]The THMA VWAP Oscillator of Oberlunar is a trend-following and liquidity-sensitive indicator that blends the Triple Hull Moving Average (THMA) with Volume Weighted Average Price (VWAP) deviation bands to highlight high-probability trading setups. It helps traders differentiate between healthy momentum moves and market noise , making it an effective tool for spotting trend continuations, reversals, and mean reversion trades .
At its core, the THMA is an advanced moving average that smooths price action while minimizing lag. Unlike conventional moving averages that react slowly, the THMA dynamically adapts to market conditions by applying a weighted smoothing process. This allows it to react more efficiently to momentum shifts , making it ideal for trend-following and breakout strategies .
The VWAP acts as a volume-weighted price equilibrium, giving traders a framework for understanding institutional positioning. Since VWAP considers both price and volume , it helps determine whether the market is trading at a premium or a discount relative to where most of the volume has transacted. The inclusion of VWAP deviation bands , derived from standard deviations, enhances the ability to detect overbought and oversold conditions , ensuring that signals align with key liquidity levels.
The indicator generates buy and sell signals based on a structured methodology that incorporates trend direction, liquidity positioning, and momentum confirmation . A buy signal is triggered when the THMA on a higher timeframe is positioned below the THMA of the current timeframe, indicating that the broader trend is supportive of an upward move. Additionally, the THMA must be trading below the lower VWAP deviation band , suggesting that price is in a discounted liquidity zone, which is often an area where institutional buyers step in. To ensure that the signal is not just a random fluctuation, the THMA must also show positive slope , meaning it is actively rising, confirming that price is attempting to reverse or continue its upward move with strength.
A sell signal follows the same logic in reverse. The THMA on a higher timeframe must be above the THMA of the current timeframe, confirming alignment with a broader downtrend. The THMA must also be positioned above the upper VWAP deviation band , signaling that price is extended and potentially due for a reversal. To validate that the momentum is actually weakening, the THMA must be in a declining slope , ensuring that price is not simply pausing but actually entering a phase of downward acceleration.
One of the key nuances of the THMA VWAP Oscillator is how it visually represents momentum through the serpentine line , which dynamically shifts color as it develops. When the serpentine line maintains a consistent color—green in an uptrend or red in a downtrend—it signals strong trend conviction . However, when the color fluctuates rapidly between green and red, it indicates a weakening signal , suggesting that price action is becoming choppy and trend strength is deteriorating. This alternation in color serves as an early warning of potential reversals, false breakouts, or trend exhaustion. Traders should be cautious when signals appear in conjunction with an unstable serpentine, as they are less likely to be reliable in such conditions.
To further enhance signal quality, the indicator incorporates a signal alternation mechanism , ensuring that consecutive buy or sell signals do not appear unless the previous trade setup has been invalidated. This helps prevent overtrading in consolidating markets and reduces the chances of chasing false breakouts. Additionally, the placement of buy and sell labels is optimized using ATR-based scaling , positioning them strategically above or below price action to maintain chart clarity without interfering with live price movements.
By integrating trend structure, liquidity positioning, and signal validation , the THMA VWAP Oscillator provides a structured approach to trade execution. It is particularly effective for traders looking to capture breakout moves, pullback entries, and mean reversion opportunities , as it ensures that entries are aligned with market momentum, institutional positioning, and price equilibrium dynamics . The ability to filter out weak signals while identifying strong momentum trends makes it an indispensable tool for trend-followers, breakout traders, and mean reversion specialists alike .
I am very pleased to share that I am publicly releasing one of my private indicators, which I usually provide exclusively to my community. This is a significant moment for me, as this tool has been carefully refined and tested to offer high-quality trading insights.
I also want to take this opportunity to thank my entire community for the incredible support I have received over the past few months. Your feedback, engagement, and enthusiasm continue to inspire me, and I truly appreciate being part of this journey with all of you.
Stay tuned for more updates, and as always, trade smart! 🚀

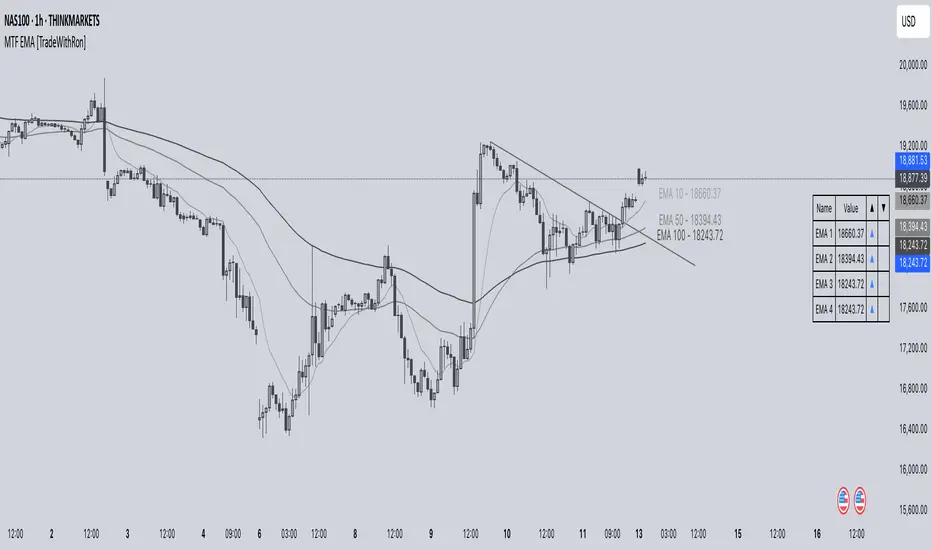
Multi-Timeframe EMA [TradeWithRon]Multi-Timeframe EMA Indicator
This indicator displays an Exponential Moving Average (EMA) from a higher timeframe on a lower timeframe chart. The EMA is a type of moving average that gives more weight to recent prices, making it more responsive to price changes compared to a Simple Moving Average (SMA). By overlaying a higher timeframe EMA on a lower timeframe chart, you can gain insights into the broader trend while analyzing price action at a more granular level.
🔶 FEATURES
* 5 MTF EMA with price and timeframe labels
* Smoothing: Alter the smoothness of the back-end EMA calculations.
* VWAP
Why Use EMA
Trend Identification: When the price is above the EMA, it suggests an uptrend, while a price below the EMA indicates a downtrend. The steeper the slope of the EMA, the stronger the trend.
Crossovers : A common strategy is to look for crossovers, such as when a short-term EMA crosses above a long-term EMA, signaling a potential buying opportunity (bullish crossover), or when a short-term EMA crosses below a long-term EMA, signaling a potential selling opportunity (bearish crossover).
Support and Resistance : EMAs can act as dynamic support and resistance levels. In an uptrend, the price may bounce off the EMA as support, while in a downtrend, it can act as resistance.
Convergence and Divergence: Traders look for divergences between price and the EMA to spot potential trend reversals. For example, if price makes a new high but the EMA doesn't, it could signal weakening momentum.
Overall, the EMA helps traders follow the market trend, spot potential reversals, and make more informed trading decisions.
After EMA Crosses you may experience A MSS, CISD, SFP. You can use all of these as confluence for a higher probability trade. This is a good way to capitalize on a trade
Another Case
How I Personally Use It:
Shortest EMA ( Example: 10 EMA ) = Entry
Middle EMA ( Example: 50 EMA ) = Short Term Support / Resistance
Longest EMA ( Example: 100 EMA ) = Long Term Support / Resistance
• WARNING
- If your MAIN chart TimeFrame its lower than ( selected TimeFrame ) the Table will not display signals
- Historical Data Unavailable for this resolution is under 2 minute chart, So you will have to use 2 minute and higher
🔶 Disclaimer
Use with Caution: This indicator is provided for educational and informational purposes only and should not be considered as financial advice. Users should exercise caution and perform their own analysis before making trading decisions based on the indicator's signals.
Not Financial Advice: The information provided by this indicator does not constitute financial advice, and the creator (Tradewithron) shall not be held responsible for any trading losses incurred as a result of using this indicator.
Backtesting Recommended: Traders are encouraged to backtest the indicator thoroughly on historical data before using it in live trading to assess its performance and suitability for their trading strategies.
Risk Management: Trading involves inherent risks, and users should implement proper risk management strategies, including but not limited to stop-loss orders and position sizing, to mitigate potential losses.
No Guarantees: The accuracy and reliability of the indicator's signals cannot be guaranteed, as they are based on historical price data and past performance may not be indicative of future results.
Volume v2 by Koenigsegg📌 Custom Volume Indicator (Separate Panel with original Alerts & Built-in Sounds)
🔹 Overview
The Custom Volume Indicator is designed for traders who prefer to view volume in a dedicated sub-window below the price chart, similar to RSI or MACD. Unlike TradingView’s built-in volume indicator, which overlays directly on the main chart, this version provides a cleaner layout by displaying volume in a separate panel.
🔹 Why Use This Indicator?
While TradingView provides a default volume indicator, this version is built for traders who prefer a separate volume panel for improved clarity and focus. Key differences:
✅ Dedicated Lower Panel Display – Unlike the default volume indicator, this version is displayed in a standalone sub-window, keeping the price chart clear.
✅ Better Chart Visibility – Helps traders separate volume analysis from price action, making trend confirmation easier.
🔹 Features
✅ Displays volume in a separate panel below the price chart for a clearer trading view.
✅ Custom color-coded volume bars for bullish volume and bearish volume.
✅ Optional Volume Moving Average (MA) for tracking volume trends.
✅ Sound Alerts on Volume Spikes, Drops and more – Get notified of significant changes in volume.
✅ Built-in Alert Sound Options – Choose from different TradingView notification sounds.
✅ Customizable settings:
- Toggle the MA on/off as needed.
- Adjust the MA length (default: 20).
- Set alert thresholds for high or low volume warnings.
📊 How to Use
- Identify high-volume breakouts and low-volume consolidations.
- Use the Volume Moving Average to confirm trends and market participation.
- Spot bullish/bearish volume surges to strengthen trade decisions.
⚠️ Disclaimer
This indicator is for educational and informational purposes only. It does not provide financial advice or trade signals. Always conduct your own research before making any trading decisions.
Crabs Multi-Timeframe Chaikin Money FlowThis indicator uses the classic Chaikin Money Flow formula, which consists of two main components:
Money Flow Multiplier: This determines whether money is flowing into or out of an asset during a period.
Money Flow Volume: This is the volume weighted by the multiplier.
This indicator adds to the basic CMF by using calculations for separate timeframes (1W, 1D, 4H, 1H). It will average the selected timeframes to create a composite line as well as a composite moving average. The indicator is completely customizable for colors/shading and will display a background shading change (when selected) indicating a change in direction of CMF. Each timeframe is selectable to display or not as desired - this will change the overall map of the CMF and the composites.
The indicator also ads user defined smoothing factors to reduce potential false signals.
A scaling feature is included which will allow for a very detailed numerical scale for the plot. If used in conjunction with the optional user defined upper and lower level lines, this can assist traders in identifying deeply overbought or oversold areas. These lines can also be selected to trigger alerts when hit.
It is also possible to use this indicator with traditional bullish/bearish divergence similar to how some might interpret the same with other popular indicators such as rsi/macd, etc.
This indicator can be used on larger timeframes to help identify possible swings and is a robust tool for visualization of potentially large market moves.

Liquidity Depth [AlgoAlpha]OVERVIEW
This script visualizes market liquidity by identifying key price levels where significant volume has transacted. It highlights zones of high buying and selling interest, helping traders understand where liquidity is accumulating and how price may respond to these areas. By dynamically tracking volume at highs and lows, the script builds a real-time liquidity profile, making it a powerful tool for identifying potential support and resistance levels.
CONCEPTS
Liquidity depth analysis helps traders determine how price interacts with supply and demand at different levels. The script processes historical volume data to distinguish between high-liquidity and low-liquidity zones. It assigns transparency levels to plotted lines , ensuring that more relevant liquidity areas stand out visually. The script adds a profile to show the depth of liquidity (derived from historical volume data) for levels above and below the current price
FEATURES
Liquidity Levels: Tracks liquidity levels based on volume concentration at price high and lows.
Volume-Based Transparency: More significant liquidity levels are displayed with higher visibility, showing their significance.
Interpolation: interpolates the bullish and bearish liquidity depth at a user defined range away from the price, helping in comparing the liquidity amounts between bullish and bearish.
Depth Profile: Allows traders to visualize depth of liquidity in a more quantitative and clearer way than the liquidity levels/list]
USAGE
This indicator is best used to track liquidity levels and potential price reaction areas. Traders can adjust the Liquidity Lookback setting to analyze past liquidity levels over different historical periods. The Profile Resolution setting controls the granularity of liquidity depth visualization, with higher values providing more detail. The script can be applied across different timeframes, from intraday scalping to swing trading analysis. The plotted liquidity zones provide traders with insights into where price may encounter strong support, resistance, or potential liquidity-driven reversals.

Enhanced VSA Volume & Candle Colors with MA SelectionOverview:
This script aims to enhance the visualization of volume spikes and price action by coloring volume bars and price candles dynamically based on the volume behavior. It allows traders to customize the type of volume moving average (SMA, EMA, or VWMA) used and apply various color schemes to highlight high, low, and extreme volume conditions. Additionally, alerts are generated when extreme or low-volume conditions occur.
---------------------------------------------------------------------------------------------------------------------
Key Features:
Customizable Volume Lookback Period:
The script allows users to define the period for calculating the moving average of volume (default: 200).
Volume Multiplier Settings:
High and low volume thresholds are defined using multipliers. Users can adjust these to customize how volume is categorized (default multipliers: 1.5 for high volume, 0.5 for low volume).
Percentile-Based Extreme Volume Detection:
The script calculates a percentile threshold for extreme volume (default: 90th percentile) based on the volume data, highlighting exceptionally high volume spikes.
Moving Average Selection:
Users can choose between Simple Moving Average (SMA), Exponential Moving Average (EMA), or Volume Weighted Moving Average (VWMA) to track volume trends over the selected lookback period.
Volume-Based Price Bar Coloring:
Price bars can be colored according to the volume conditions (high, low, or extreme). This feature can be toggled on or off.
Dynamic Transparency and Color Customization:
The script allows users to set custom colors for different volume conditions (high, low, neutral, extreme) and adjusts the transparency of volume bars based on the relative size of the volume.
Alerts:
Alerts can be set for when extreme volume spikes or low volume conditions are detected.
---------------------------------------------------------------------------------------------------------------------
Script Components:
Volume Histogram Plot:
Displays the volume bars with dynamic coloring based on the volume condition (high, low, or extreme). The color of the bars adjusts for clarity, with transparency based on volume levels.
Moving Average Plot:
Plots the selected volume moving average (SMA, EMA, or VWMA) to visualize the trend of volume over the chosen lookback period.
Smoothed Average Volume (EMA of Volume):
A smoothed EMA line is plotted to provide a clear representation of volume trends over time.
Price Bar Coloring:
If enabled, price bars are colored according to the current volume condition, providing immediate visual feedback to the trader.
---------------------------------------------------------------------------------------------------------------------
How It Can Be Used:
Volume Analysis for Entry/Exit Points: Traders can use the volume conditions (high, low, and extreme) to identify potential entry or exit points. High-volume bars often signal strong market activity, while low-volume bars may indicate consolidation or indecision.
Volume Confirmation for Trend Reversal: Extreme volume spikes can sometimes precede significant price movements. Traders can monitor these spikes for potential trend reversal signals.
Customizing Alerts: Alerts based on volume conditions help traders stay updated on important volume events without constantly monitoring the chart.
Color-Coded Price Action: The dynamic coloring of price bars makes it easier to identify periods of strong or weak market participation, allowing traders to make informed decisions quickly.
---------------------------------------------------------------------------------------------------------------------
Compliance with TradingView's House Rules:
No Promotion of Financial Products: The script does not promote any specific financial instruments or products, ensuring compliance with TradingView’s content guidelines.
Clear Functionality: The script provides clear, functional analysis tools without making unsupported claims about predicting market movements.
No Automated Trading: The script does not include any automated trading or order execution features, which complies with TradingView’s policy on non-automated scripts.
This breakdown ensures clarity on the script’s purpose, features, and how it might be used by traders. It's written in a way that fits TradingView's content guidelines, keeping the focus on providing valuable analytical tools rather than making promises or promoting any financial product.
