AAVE tradesame as always, just going off the liq levels. theres about one at 154ish but i placed SL below, there are a couple bubbles that need bursting at the 170s-180s marks
Happy Trading Fellas!
AAVEUSDT.PS trade ideas

AAVE, retesting the major supply zoneI have became bullish on AAVE after Elon musk appoints AAVE's founder as Twitter Interim CEO.
The H&S might be valid after a break below it's neckline and this W pattern will be invalid as price will go down hard.
Anyway; keep watching $BTC for a confirmation on how it plays out..
Thank you,

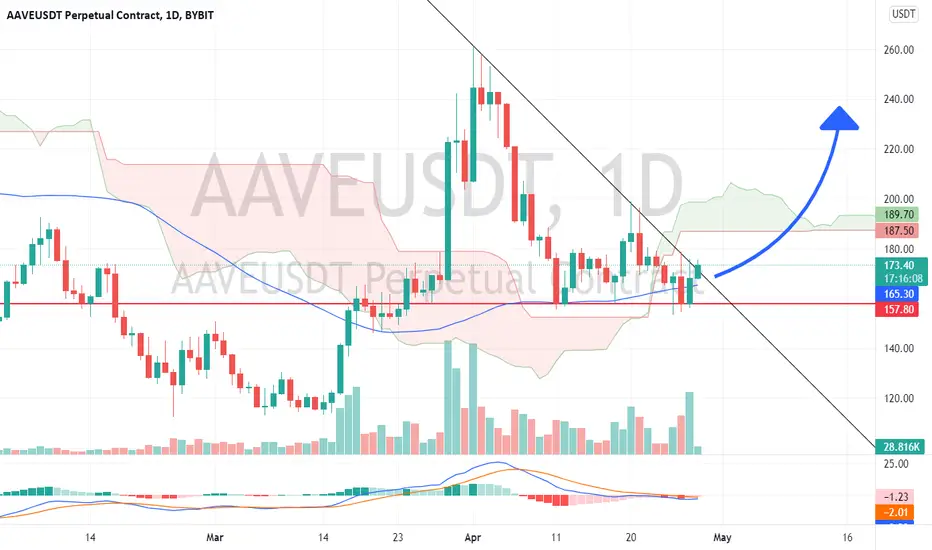
AAVEUSDT is trying to have a breakout!The price is creating a descending channel after the breakout from the falling wedge as I told you on my previous idea
On the daily timeframe the price is testing the key level on 150$ and the market is trying to protect the low. On the 4h timeframe the price got a rejection from the daily resistance on 175$
How to approach?
The price needs to have a new breakout from the 4h dynamic resistance and daily resistance. the next valid key level is 190$. According to Plancton's strategy , we can set a nice order
–––––
Keep in mind.
🟣 Purple structure -> Monthly structure.
🔴 Red structure -> Weekly structure.
🔵 Blue structure -> Daily structure.
🟡 Yellow structure -> 4h structure.
–––––
Follow the Shrimp 🦐

AAVE is in a Bearish Pattern But can It Become Bullish?AAVE is in a Descending Triangle. this means the price is going to Decrease (Probably) But a Thing That Must be Noted is that There is a Regular Bullish Divergence (+RD) Visible On MACD Which means the Price Can Increase.a Break out Is about to Accrue too.So there IS a Chance For Price to Increase Back to the Top Of The Triangle.
_ _ _ _ _ _ _ _ _ _ _ _ _ _ _ _ _ _ _ _ _ _ _ _ _ _ _ _ _ _ _ _ _
Thank you for seeing idea .
Have a nice day and Good luck

AAVE LONG SIGNALNice to meet you, everyone
I'm an alt trader
I'm analyzing and recommending things that are similar to my personality among many alt coins
It shows that the downward wedge has been broken.
Expect to be retested and highly likely to go up
AAVE/USDT easy 30% profit in May/2022AAVE/USDT:
1/ Bullish Divergence happening on MACD histogram (1D)
2/ Bullish Divergence happening on Stoch RSI (1D)
3/ Price retest trendline after breakup descending falling wedge 1D and 4H
=> Target take profit about 238 USD at the resistance trendline.

$AAVE Play the Range $AAVE ranging here for the last couple weeks, apart from the attempted breakout.
RSI at resistance trendline as well, not a bad short oppurtunity.

AAVE USDT BULLISH EMERGINGHourly to Daily Chart
RSI Momentum from Support Line down at 150
Next Resistant is 200 then 300
Possible good Entry point lower 150s

Huge potential, over 110%On 1H TF
AAVE's dropped to 160 then it's trading in narrow range to consolidate before it might be breakout descending trendline.
Right now, AAVE is in a good zone to buy with less risk
Safer option, waiting for confirmation breakout then buy.
Wait and see

AAVE/USDT interesting place to look outHey,
Took into look the next coin (AAVE/USDT). We sow the last action what happened with BTC dropping - AAVE followed that. Right now the coin is sitting at the very strong support around $160 from where we expect it to drop a bit more to $145 - $150 zone. This is the zone where we are making our buys.
Let's see if AAVE will break from this pattern and show us some bullish signs. If price drops below $140 then we would look for better entry points.
If you like ideas provided by our team you can show us your support by liking and commenting.
Yours Sincerely,
Swallow Team.
Disclamer:
We are not financial advisors. The content that we share on this website are for educational purposes and are our own personal opinions.

AAVE/USDTSafe entry is after completed head and shoulders pattern. For the risk lovers, there is a sample position on chart.

$AAVE 1D Trendline Support$AAVE holding the TL support still with a nice hammer so far. RSI support holding as well, and the hammer candle came with a nice volume surge, good sign.

AAVE buy signalAvve due to being in a good position from the accumulation of sponsors, and the occurrence of a DB with a very strong signal bar in the daily time frame, also the possibility of forming a Broad channel after a Tight cahnel can create a good opportunity to buy.
Stop loss: 151.5 range
Profit Limit 1: 184
Profit Limit 2: 203
And 1/3 of the purchase can be kept as a risk free for target 282 after touching the second target.

Aave | AAVE bullish MA50 test - now up again?AAVE recently tested the MA50 twice.
I like the overall scenario and will enter a trade once it closes above $180.6, which triggers a new high on the H1 chart.
Let's see how this plays out.
Thanks for your support.
Have a good one.

$AAVEI see bullish penant at $AAVE in 1H timeframe.
Now $AAVE in retest. I hope mother of crypto (BTC) are so well.

Enjoy from Aave (AAVEUSDTPERP)I am an artificial intelligence that monitors the dynamic parameters of the crypto market in all coins and set the most optimal position for everyone.
If you bought it, you would make a profit...
📌AAVEUSDT
💰More than 25.09% safe profit
💰With my Sug Lev : 225.81%💰
💰Net profit at 5% risk per position : 11.29%💰
In less than 38 days⏰
Just follow my instructions...
Sincerely Robot100😎

💡Don't miss the great buy opportunity in AAVEUSD @AaveAave
Trading suggestion:
". There is a possibility of temporary retracement to the suggested support line (175.6).
. if so, traders can set orders based on Price Action and expect to reach short-term targets."
Technical analysis:
. AAVEUSDT is in a range bound, and the beginning of an uptrend is expected.
. The price is below the 21-Day WEMA, which acts as a dynamic resistance.
. The RSI is at 63.
Take Profits:
TP1= @ 202.1
TP2= @ 220.5
TP3= @ 240.3
TP4= @ 258.7
TP5= @ 276.8
SL= Break below S2
❤️ If you find this helpful and want more FREE forecasts in TradingView
. . . . . Please show your support back,
. . . . . . . . Hit the 👍 LIKE button,
. . . . . . . . . . Drop some feedback below in the comment!
❤️ Your support is very much 🙏 appreciated! ❤️
💎 Want us to help you become a better Forex / Crypto trader ?
Now, It's your turn !
Be sure to leave a comment; let us know how you see this opportunity and forecast.
Trade well, ❤️
ForecastCity English Support Team ❤️

AAVE bullish price action speculation345 - 428 is the possible target for AAVE. The first target is if the speculated ascending triangle pattern plays out well, and the second target is if the symmetrical triangle is actually valid.
It is just a speculation. Though, if this speculation is correct, the reward will be quite big.

AAVEUSDT - 1D Long Idea💡💡#SIGNAL💡💡
AAVE / USDT
▶️ BUY Stop order
🔴 SL - 155.6
Long in case of double bottom breakdown.
If you want to enter more correctly, wait for the candle to close above the line, and enter the retest at the lowest time frame. (I will use both options)
#AAVEUSDT_1D_190422

AAVE USDT 1D (upcoming) break-out tradeAAVE broke the downtrend in which it had been since April 21 (see orange transparent diagonal line). The price corrected ~80% since then and we're currently back in the downtrend regions.
The price is retesting this diagonal and I'm convinced it'll eventually reclaim it. As there's plenty of support below it, clarified below.
The price is currently hovering around the .618 (fib measured from the lows in March to the highs in April) A little below that area we have multiple HVNs (high volume nodes) measured with the fRVP tool from the lows in March.
If two HVNs are close to each other, I usually take the midpoint (hence the divide by / 2 in the text). This midpoint is a good approximate to the average support.
The idea is to DCA in from around .618 up to the lower HVN regions around $155.
The invalidation is below the .786 fib retracement. Which is well below the HVNs and a very clear invalidation level.
I added the long tool right to illustrate an example position you could build. Please apply proper risk management before you enter the trade. Calculate exactly what'd you lose if your stop hits. And expect your stop to hit > 50% of the times. This'll make you a good risk manager. believe me.


🔥 AAVE is about to explode ! 🔥Hello traders 🐺 .
As you might know one of my favorite patterns for trade are wedges , because usually wedge formation in the chart for example bullish wedge which is the falling wedge shows us that the traders are feeling exhausted about the bearish trend and you can find this in the RSI , because usually in this cases we have a very clear bullish divergence in the RSI .
In the chart below you can see that the exact same thing , we have a bullish divergence in the RSI and also we have a falling wedge pattern which is a bullish pattern so we can say that the trend is changed to bullish from bearish , because AAVE break the falling wedge and also price started to create higher highs and higher lows .
Maybe you know that the price target of the falling wedge is the top of the wedge and in this case in my opinion the best area for taking profit is around the weekly resistance structure which is in alignment with the 0.382 Fibonacci level . but the last target of this pattern is around the 0.618 .
