Short set upPrice Action Broke through C leg of the ABCD pattern. Currently short and looking for a retest of D leg, which will set up a triple bottom
EEM trade ideas

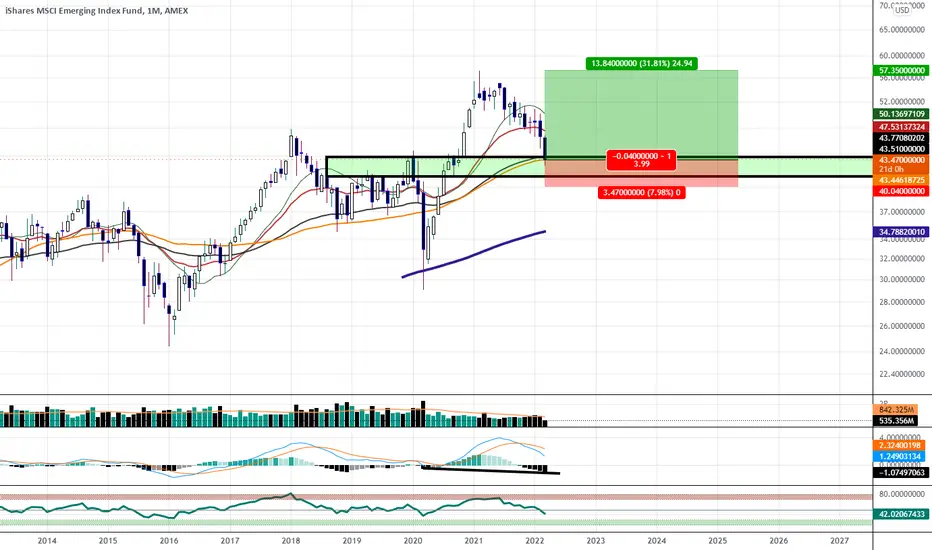
Emerging Markets ETF Showing Bullishness at SupportWe are at the 55 Month Moving Average and it happens to align with an old Monthly Resistance that we are now testing as Support; If at any point we start to rally we will have MACD Hidden Bullish Divergence Develop on the Monthly Timeframe.
$EEM SHORTWar and Russia's weight on the ETF itself made it brake support and enter bear territory. Extreme volatility and high risk means SELL, given the confirmation in price action.
AMEX:EEM

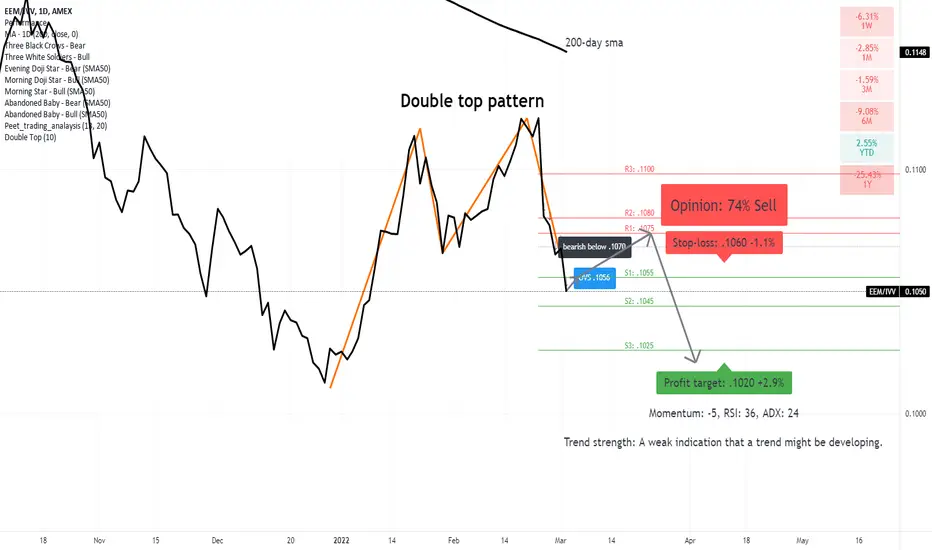
Emerging equities continue to underperform Developed equities?Below 0.1070 supports a bearish trend direction. Emerging market equities are likely to underperform Developed market equities.
Downside price momentum supports the bearish bias.
RSI leaves some room for downside potential.
Expect a pullback before the leg downwards might continue.
An M-top pattern also supports a bearish trend direction.
EEM:BIG BULLFLAG & A DIAMOND at big support zone.I think it is time for Emerging mkt to rise after falling near 20%. It has made a big flagpole & the flag is now at the 38.2% Fib retracement which is also a big support zone (45.68 to 47.50).
It had broken out of a BIG multi-year consolidation WEDGE last Jan 2021 to extend the 3rd leg of the flagpole & has re-entered inside this wedge to retest this impt support zone.
This would be the best place for EEM to reverse up. Given how big the flagpole, retracement may be limited.
Could it get lower? Possible too… as low as 41, a 61.8% retracement of the flagpole.
Any which way…wave 3 continues.
Not trading advice

Emerging Markets likely to outperform the S&P500A bullish divergence with RSI has appeared on the daily relative strength chart of EEM/SPX
Also a falling wedge has broken out upwards
A period of "Relative" outperformance wrt to the S&P500 may be near for the Emerging Markets

emerging vs. spyemerging vs. spy, the concept of mean reversion, "So it is. Everyone who is now last will be first, and everyone who is first will be last."

EM showing signs of life vs S&P500Emerging Markets are showing signs of life at least for the short term. After years of underperformance discussed in previous graphs. EM is at extreme oversold lvls vs DM and showing signs of life. A weekly close above the recent downtrend (blue line) would be encouraging for a period of outperformance with eyes on our longer term charts previously published where we made our case for EM outperformance for the next decade based on technicals and fundamentals.

EM vs. SPY...close to inflection point.Similar charts making the rounds today and reinforce our view that EM will be a better place to be over the next 10yrs. This relative value chart indicates that EM has gotten too cheap vs S&P and showing signs of being oversold and close/at an inflection point on different TA indicators. Long EM/short DM is the trade for the next 10yrs. For naked EM longs look for our other charts and lvls.

$EEM Bullish Reverse Head and Shoulders?Emerging Markets looking to me like we have put in a low with this Reverse Head and Shoulders Pattern. I've drawn in what I feel would be a proper neck line that we are over at this point. It is under both the 50 and 200 SMAs but it has regained both the 10 and 20 EMAs. I've taken a small position and my stop will be 48.80 where I would deem this idea void. Ideas, not investing / trading advice.

$EEM naked PUT, high PoP #option #trade #Trades #OptionsTrading The iShares MSCI Emerging Markets ETF is a good choice for today high IVR credit trade. High PoP, very predictable profit.
Reasons:
- high reward for Jan21 monthly expiry (mangeable with rolling) -> collecting credit
- breakeven point is far
- RSI is oversold.
Max profit: $92
Probability of 50%Profit: 84%
Profit Target relative to my Buying Power: 14%
Req. Buy Power: $633 (max loss without management before expiry, no way to let this happen!)
Tasty IVR: 104 (very high)
Expiry: 49 days
SETUP : NAKED PUT for $EEM, because IVR is high, for 0.92cr
* Sell 1 $EEM JAN21'46 PUT
Management : ROLLING if daily candle is closing below of BE.
Take profit strategy : 50% of max.profit in this case with auto buy order at 0.46db
Of course I'll not wait until expiry in any case!
If you liked this article, check my other ideas.
Anyway: HIT THE LIKE BUTTON BELOW , and for fresh option ideas FOLLOW ME( @mrAnonymCrypto ) on tradingview !

Emergin Market ETF USA Sun Storm Investment Trading Desk & NexGen Wealth Management Service Present's: SSITD & NexGen Portfolio of the Week Series
Focus: Worldwide
By Sun Storm Investment Research & NexGen Wealth Management Service
A Profit & Solutions Strategy & Research
Trading | Investment | Stocks | ETF | Mutual Funds | Crypto | Bonds | Options | Dividend | Futures |
USA | Canada | UK | Germany | France | Italy | Rest of Europe | Mexico | India
Disclaimer: Sun Storm Investment and NexGen are not registered financial advisors, so please do your own research before trading & investing anything. This is information is for only research purposes not for actual trading & investing decision.
#debadipb #profitsolutions

EEM Possible BreakdownEEM is looking weak at the bottom of this range its been in for a few weeks, if market sell of continues we may see this break below 49/48.75 which is a clear break of the channel support. Next key level below 46.25, may see sell off to this level before prior bulls come in to defend.

Emerging Markets Indicates Deeper Correction On StocksHello traders and investors!
Today we want to show you an interesting chart with clear Elliott Wave pattern suggesting deeper correction, which may have an impact on stocks across the globe.
We are talking about Emerging markets (EEM), where we clearly see a completed five-wave cycle from March 2020 lows following by bigger and deeper (A)-(B)-(C) correction. As you can see, after we noticed a bearish triangle pattern in wave B), we can now see it breaking even lower, ideally for wave (C) that can send the price down to 42 support area.
If that's the case and EEM goes sharply and impulsively for wave (C) then be aware of a bigger decline on stocks now at the end of the year.
Trade and invest smart!
If you like what we do, then please like and share our idea.
Disclosure: Please be informed that information we provide is NOT a trading recommendation or investment advice. All of our work is for educational purposes only.

Still Looking bullish.Using Elliott Waves thurst measurements on this triangle would give a target of around 90.


2021-10-03 EEM - shortPotential for a move lower on EEM. There's a gap from current levels to previous resistance which can act as support.

MSCI Emerging Index Dropping. EEMWave A being followed by Wave B in an overall upward Zigzag. Momentum dropping and pivot already confirmed. Good luck and stay safe.
We are not in the business of getting every prediction right, no one ever does and that is not the aim of the game. The Fibonacci targets are highlighted in purple with invalidation in red. Fibonacci goals, it is prudent to suggest, are nothing more than mere fractally evident and therefore statistically likely levels that the market will go to. Having said that, the market will always do what it wants and always has a mind of its own. Therefore, none of this is financial advice, so do your own research and rely only on your own analysis. Trading is a true one man sport. Good luck out there and stay safe!

$EEM Massive Bull Wedge$EEM Massive bull wedge on verge of breakout.
I post a limited number of posts publicly, but many more on my private Twitter feed. Be sure to check it out if you're interested.

2021-08-17 EEM - shortBroke short term support level. May consolidate for a few days. I'm looking for a move to 45 maybe 40

Emerging markets under pressureEmerging markets are heavily short for moment... cant see it turning up for moment!

EEM pullback a chance to accumulate some length ?Looks like a bullish continuation pattern has emerged and further upside can take place holding the support zone.
Look to scoop and add on further breakouts.

Hiding in EEM not a bad idea EEM has been consolidating above the trend line entire 2021. As long as it above $50, I am hiding in China names till we correct in US names
