GDX Gold miner ETF looking promising right now GDX Gold miner ETF looking promising right now
Similar to other precious metal price action right now
GDX trade ideas

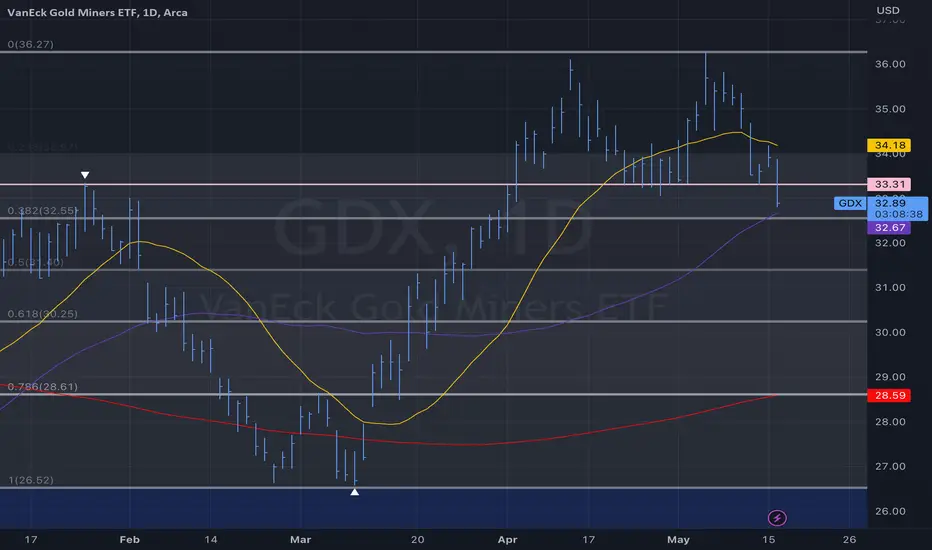
#GDX possible reversal levelsThe activity of the options market confirms the liquidity that shown on the graph.
Which side will they choose?
Stay tuned and will find out.
We consider levels to be activity zones, but not to be a super-fine level for establishing a limit order. Use them in combination with our own strategy, not in alone.

Gold Miners ETF (GDX) Bullish View Showing Impulsive RallyRally in Gold Miners ETF (GDX) from 6.29.2023 low is in progress as a 5 waves impulse, favoring further upside. Up from 6.29.2023 low, wave 1 ended at 30.8 as the chart below shows. Pullback in wave 2 ended at 28.91 with internal subdivision as a zigzag structure. Down from wave 1, wave ((a)) ended at 29.74, rally in wave ((b)) ended at 30.03, and wave ((c)) lower ended at 28.91 which also completed wave 2. Wave 3 is currently in progress with internal subdivision as a 5 waves impulse in lesser degree.
Up from wave 2, wave ((i)) ended at 29.82 and dips in wave ((ii)) ended at 29.20. The ETF then extends higher again in wave ((iii)). Up from wave ((ii)), wave (i) ended at 30.47 and pullback in wave (ii) ended at 30.03. The ETF then extends higher again in wave (iii) towards 32.26 and pullback in wave (iv) ended at 31.96. The ETF made another leg higher in wave (v) towards 32.4 which completed wave ((iii)). Pullback in wave ((iv)) ended at 31.48 as a zigzag. Down from wave ((iii)), wave (a) ended at 31.9, wave (b) ended at 32.38 and wave (c) lower ended at 31.48. Expect the ETF to make 1 more push higher to complete wave ((v)) of 3. Afterwards, it should pullback in wave 4 to correct cycle from 7.6.2023 low before it resumes higher. Near term, as far as pivot at 28.91 low stays intact, expect dips to find support in 3, 7, or 11 swing for further upside.

GDX could shoot as high as $40.00 in the next 30 or so daysGDX is forming a heads and shoulder pattern that potential shows the stock rising as high as $40.00. There are a few resistances that GSX will need to break through. I believe the first one is around 32.33 (Very close now), then between ($33.00 and $33.40) and finally around $36.40. What are your thoughts?


GDX - Time to shine ? GDX showing signs of green shoots. If it can break $30.60 we could see a relief rally back towards $35.
RSI divergence + some bullish candle closes.
A move below $27 negates the idea.

GDX heading down... It has been more than 6 months since I looked at GDX proper. Yes, I might have missed the last Gold/GDX rally, but I think that short run is about over...
Looking at the weekly chart for GDX, a decisive lowest close since March 2023 is representative of a end of a bull trend, if it is not already obvious enough. The near marubozu type down candle came after a quick dip and a lower high, to get a close near the lower low... which just prevails the downward momentum.
Few other notes...
1. a trendline support breakdown this coming week would accentuate the downside bias;
2. the MACD and VolDiv have crossed down and looks determined to crossunder the zero line;
3. any further breakdown bring it into the previous consolidation range. And a break in into the range suggest an extrusion on the other (lower) side of the range;
4. Noted that the USD appear to be gaining strength and the equity markets are about ripe for a retracement. Furthermore, the Gold analysis point to a further slide in Gold prices. Taken together, these 3 critical pillars for GDX are impacted, whcih gives little for the bullish case on GDX.
Down it goes... heads up!

GDXBuy some GDX here in the FED channel bottom area and we are constantly finding dollar strength selling pressure on gold
By closing the previous week on the chart, we find selling pressure, and by breaking the channel drawn on the charts, we find it at the next levels
26.55
25.16


$GDX #GDX why no one is yelling here ?reaching out to the bottom of current trend is not an option , trades are made daily here , little oversold doesn't counts here either .. in my opinion dips are must to be bough today , yes it's Friday

GDX: Will you make it? 💪This is what we ask GDX regarding our primary scenario. The ETF has shown momentum in both directions: upward and downward. However, we expect the bulls to win this fight, pushing GDX above the resistance at $32.58 and into the turquoise zone between $33.93 and $35.57. There it should finish wave ii in turquoise and turn southward again, heading back below $32.58. However, our secondary scenario shouldn’t be disregarded! There is a 40% chance for the bears to triumph. In that case, we would have to wait for wave alt.(5) in yellow to expand first, which would then include a new low.

GDX ETF BullishHI again ..... see this chart really bullish on That ... I am looking to enter my long on that littile by little ....
observe dollar cost aweraging .....dont fomo.....little by little do that not by whole of your account ..
comments below

Bearish on DXY dollar indexGuys lets mention this relation : inverse correlation between DXY and GDX chart ,,,,, that is clean for your decision ....
I am sure we find big resistance around 105 for DXY .......
Good luck

manage risk Hi guys when you want to buy the thing like this we know the probability favours to increase and every thing shows us we may have good bounce up .........
But you should manage your risk and as an example put 300$ in 1 stage and put 600$ and ......3
this protect you from loss
consider in these kinds of stuff me personally use mental stop loss not physical type .
lets argue about that on comment section .......
Good luck .

Gold Miners 2 Day TF I anticipate a 20% movement in gold miners in the upcoming weeks, following its breakthrough of a resistance level which now serves as a support level. Additionally, silver has broken and found support in above a channel , indicating a potential bullish swing in gold. Once gold closes above its declining trend line, which I expect to happen, it may accelerate towards the 2050 mark.


Bullish on GDXHi .... Guys you want to make money by good bounce ? dont miss this opportunity .....
look at 30 odd number good support to get a bounce from that ...
but consider price could pierce 29 and dont forget aweraging your entry point .....
always chase high probability....
what is in your mind ??

GDX PLAYBULLISH ABOVE 32.24
BEARISH BELOW 31.48
I may take an intraday put position below 32.02
Price is testing weekly 32.24 level if it break and hold I’m looking to go bullish.

$GDX short term support & major supportAMEX:GDX short term support at the 50 day moving average next major support will be around $30
Gold miners long term triangleThis chart pattern has been forming since 2011. It is a triangle merging an uptrend and a downtrend that are potentially converging in the near future.

Raining Gold"When it's raining gold, reach for a bucket, not a thimble."
- Warren Buffet
Hello friends. We think that this is a big opportunity to get bullish exposure to gold miners, and it's good to adjust the sizing according to the edge so we are building a big long position for gold miners.
There are several factors that make this a great time to get long.
For one thing, gold miners are simply priced well. They are trading at a cheap P/E ratio average of 16.6 presently, down by a lot from the bubble highs.
Another factor to consider is seasonality. Gold enters an enormously bullish period in September and then continues to rally through the end of the year with the exception of October.
A big factor that the market isn't even seeming to consider is the fact that gasoline futures have now fallen by around 40%, which is a good sign that inflation has peaked and also means a lower cost basis for the gold produced by gold miners since they use up gasoline and many other commodities within their process of extracting gold. Cheaper gasoline will mean the other commodities used in production can also get cheaper.

Imminent breakout setup in GDXSo many indicators and time frames are bullish GDX right now with bull divergences and montly MacD cross. Classic cup n handle formation with a backtest of cup in progress. Im no EW guru but it looks like we are at the beginning of wave 3. Good RR here with a stop at $31. Let me know what you think of analysis. Cheers.

Elliott Wave Expects Gold Miners ETF (GDX) Buyers expect soonGold Miners ETF (GDX) shows a bullish sequence from 9.26.2022 low favoring further upside. The 100% – 161.8% Fibonacci extension target from 9.26.2022 low comes at 38.3 – 45.7 area. Rally from there is unfolding as a nest where wave ((1)) ended at 33.34 and wave ((2)) pullback ended at 26.64. Wave ((3)) is in progress as another 5 waves in lesser degree. Up from wave ((2)), wave (1) ended at 36.10. Pullback in wave (2) is in progress to correct cycle from 2.24.2023 low in 3, 7, or 11 swing before the rally resumes.
Internal of wave (2) is in progress as a double three Elliott Wave structure. Down from wave (1), wave ((a)) ended at 34.38, wave ((b)) ended at 35.19, and wave ((c)) ended at 34.07. This completed wave W in higher degree. Corrective rally in wave X ended at 35.19. Wave Y lower is in progress as a zigzag structure. Down from wave X, wave ((a)) ended at 33.60, wave ((b)) ended at 34.63, and wave ((c)) of Y should reach the extreme area at 31.9 – 33.15 blue box area. From this area, the ETF can extend higher in wave (3) or rally in 3 waves at least.
