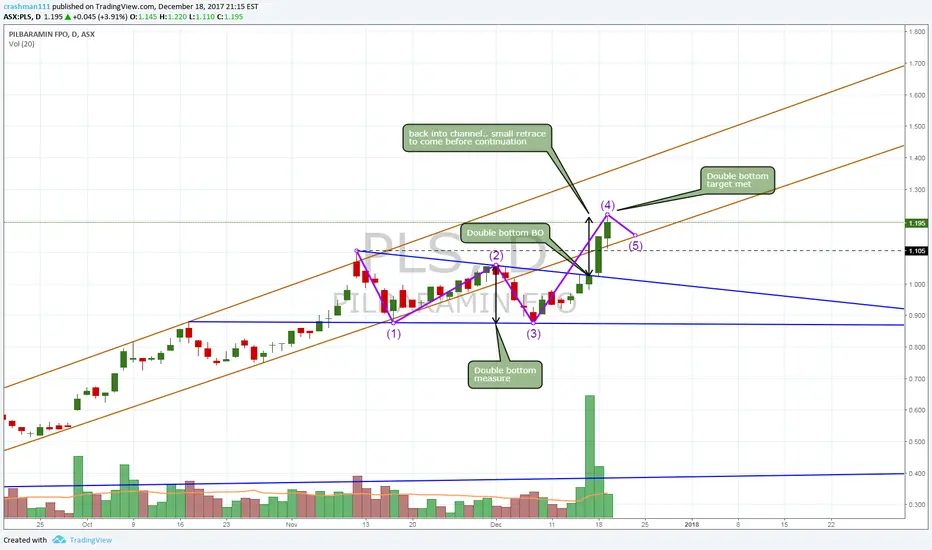
$PLS Pilbara one more lithium boost$PLS Pilbara seems to be on the Elliot Wave 5 path now.
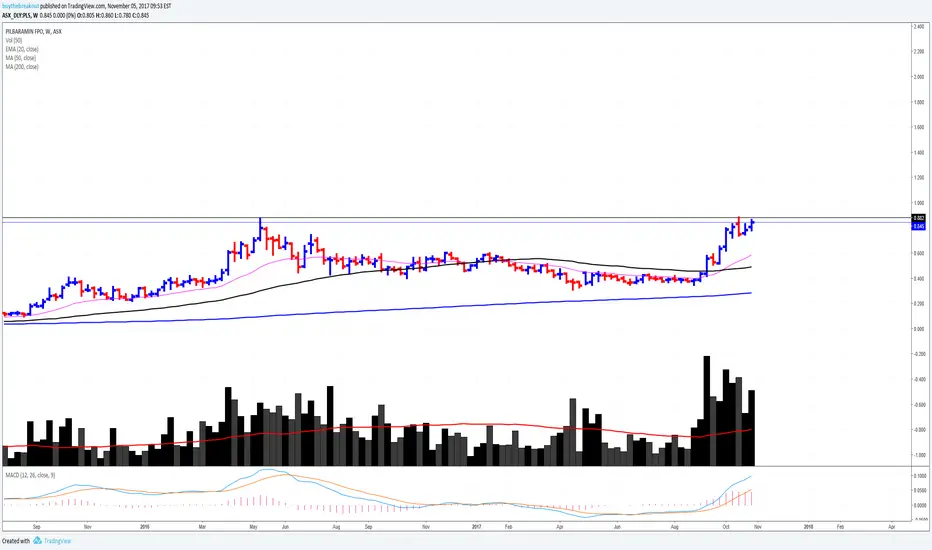
Anyhow, in Ichimoku terms,
1. TK cross bullish
2. Chikun above price - Bullish
3. Break above clouds
4. Target: $1.00
5. SL @ $0.91
PLS trade ideas

$PLS Price target $1, > $1.015 would confirm a breakoutBuyers have stepped in at support zone 0.79 - 0.80 with volume showing a bullish divergence on the RSI chart. The bounce was followed by a bull pennant with another break above 0.875 level. Looking very bullish atm with RSI holding above 60 and FA still looking strong relative to peers.

Will Pilbara Minerals continue it's uptrend? $PLS
Fundamental analysis: PLS.AX continues to secure landmark deals with top tier companies with the most recent: Binding Subscription Agreement executed with POSCO and its wholly-owned subsidiary, POSCO Australia Limited (POSCO, market cap: $28t) , for an immediate upfront A$79.6M equity investment at A$0.97/share in Pilbara Minerals, with the proceeds to contribute towards accelerating the Stage 2 (5Mtpa) development this year.
The market reacted with a huge gap up resulting in a 12% increase on high volume. The next 5 candles showed signs of profit taking. The reaction to the POSCO deal mimics greatly to the reaction given on 02 May 2017 when PLS secured a BOA + finance with Ganfeng (SHE: 002460 , market cap: $50b) i.e. gap up on high volume, followed by profit taking.
Market sentiment: Lithium sentiment has been greatly diminished by the Morgan Stanley report on prices reaching a peak, with fear of uncertainty and over supply. I am of the personal opinion that lithium demand is still greatly underestimated and market is showing gradual positive signs of recovery.
Technical analysis: 3month chart is showing higher lows and (slightly) higher highs. The next candle or 2 (if a doji appears) should determine whether PLS will continue it's uptrend or continue sideways.

When patterns fail...We have H&S failure on 4H chart, Bearish Engulfing failure on W chart.
We are a bit worry on the rising triangle pattern on D chart. Although the base of the triangle aligned on a critical resistance level, it has only one reversal. Theoretically, the breakout doesn't work.
Then, what if this pattern failed? The answer will be a downward breakout instead.

Watch $PLS for a continuation move w/volume through resistancePLS is forming a pennant like setup. Clearing of 88c would signify strength.
$PLS Head & Shoulders on declining volHead and shoulders BO on declining volume
to Fib 50% level.
Momentum may close the gap at 55.5c at 61.8% level.
.
See annotations

Pinbara PLS.ASX - lithium minerSo far we could see modest pullback with decreasing volume. There are clear supports level incl. gap, Lets try to scale in with long term core position targeting .85 (and above) & short term position targeting .60.

Strong momentum - lithium miner PLSLooking to add to position during possible pullback or after breakout of 0,60 resistance. Scaling in/out during trend with partial positions.


Pilbara (ASX:PLS) Possible Bottom Possible bottom in place for PLS.
T1 - 0.48 ; T2 - 0.52 ; T3 - 0.60 ; SL 0:41

Pilbara Minerals Breakout - long - lithium projectPossible breakout from 4 month rectangle. Daily/weekly close above S/R zone, above fib, price above SMAs. possible impulsive move as in Apr/May.
Developing fundamentals - emerging lithium mine in Australia. PLS-ASX
