AUDUSD Potential 1:3 up to 1:11 RR | POSITION | LONGAs seen in the chart, it was expected that the ideal "supply" zone was swept. As a retailer, your normal reaction is to buy on that support area; however, looking at the bigger picture, due to the momentum of the bears, there was no clear indication for us to buy in that area, hence using SMC, we should be buying at our actual discount/supply zone. By buying in this area, we can potentially reach 1:11 RR with a minimum RR of 1:3, a reward I am sure that most of us would like, especially for those trading with big lots.
Reminder: Do not risk more than 1-3% of your port so you can make up your losses.
Disclaimer: I am not a guru or a professional trader, I am simply sharing my insight based on my understanding of the market.
AUDUSD trade ideas

AUDUSD Set To Fall! SELL!
My dear followers,
This is my opinion on the AUDUSD next move:
The asset is approaching an important pivot point 0.6274
Bias - Bearish
Safe Stop Loss - 0.6310
Technical Indicators: Supper Trend generates a clear short signal while Pivot Point HL is currently determining the overall Bearish trend of the market.
Goal - 0.6211
About Used Indicators:
For more efficient signals, super-trend is used in combination with other indicators like Pivot Points.
———————————
WISH YOU ALL LUCK

AUDUSD future projectionUsing the top down analysis from the 4hrs to determine and confirm a bearish trend changed bullish plus a break of trendline. going don to the 1hr timeframe i can see a CHOCH happening then i scale to my 15min timeframe which is my entry confirmation and wait

USDAUD PRICE FORECAST UP TREND 📈 USD/AUD Price Forecast: Uptrend in Focus! 🚀
🕒 1-Hour Timeframe Insight:
USD/AUD is showing a strong uptrend with bullish momentum. Supported by the EMA 50, this trend offers a great opportunity!
📍 Entry Point: 1.6080
🎯 Target Levels:
1.6200
1.6300
📊 Indicator in Focus: EMA 50
🔥 Stay Ahead of the Market!
Like, comment, and follow for precise updates and expert trade ideas. Let’s maximize profits together!

audusd today looking for short at critical level marked in boxshort aud usd when market goes in the green box. The box is between 0.618 and 0.786 level. We are with thetrend of 4 hr chart as well expecting a market shift down side in 4 hr. In a5 mins market has shifted to downside. So we are looking for only short from here.

Watching and Waiting for a Trend Line break on AUDUSDReasons I think this pair will rise:
- RSI was oversold on H4
- Bullish RSI divergence on H4
Currently waiting for a trendline break on H4.
What do you think?

Audusd sellThe trend is bearish and from this particular timeframe if price breaks above then we can say that the trend of the market is changing

Bearish drop?THE Aussie (AUD/USD) has reacted off the pivot and could drop to the 50% Fibonacci support.
Pivot: 0.6292
1st Support: 0.6217
1st Resistance: 0.6345
Risk Warning:
Trading Forex and CFDs carries a high level of risk to your capital and you should only trade with money you can afford to lose. Trading Forex and CFDs may not be suitable for all investors, so please ensure that you fully understand the risks involved and seek independent advice if necessary.
Disclaimer:
The above opinions given constitute general market commentary, and do not constitute the opinion or advice of IC Markets or any form of personal or investment advice.
Any opinions, news, research, analyses, prices, other information, or links to third-party sites contained on this website are provided on an "as-is" basis, are intended only to be informative, is not an advice nor a recommendation, nor research, or a record of our trading prices, or an offer of, or solicitation for a transaction in any financial instrument and thus should not be treated as such. The information provided does not involve any specific investment objectives, financial situation and needs of any specific person who may receive it. Please be aware, that past performance is not a reliable indicator of future performance and/or results. Past Performance or Forward-looking scenarios based upon the reasonable beliefs of the third-party provider are not a guarantee of future performance. Actual results may differ materially from those anticipated in forward-looking or past performance statements. IC Markets makes no representation or warranty and assumes no liability as to the accuracy or completeness of the information provided, nor any loss arising from any investment based on a recommendation, forecast or any information supplied by any third-party.

AUDUSD - 23 Jan 2025 SetupAUDUSD Market structure are now on a slightly Bullish mode. Spotted demand area (Green Rectangle). its the first demand area after the long bearish structure.
Entry Position : Long
Profit Target : 1:3 Shown on the chart image (Green Line)
Stop Loss : Slightly below demand area (Red Line)
Follow me if u guys making any gains from this idea.
Thanks
Coffee Trade Team

Aussie H4 | Approaching swing-high resistanceThe Aussie (AUD/USD) is rising towards a swing-high resistance and could potentially reverse off this level to drop lower.
Sell entry is at 0.6242 which is a swing-high resistance.
Stop loss is at 0.6312 which is a level that sits above the 38.2% Fibonacci retracement level and a swing-high resistance.
Take profit is at 0.6135 which is a swing-low support.
High Risk Investment Warning
Trading Forex/CFDs on margin carries a high level of risk and may not be suitable for all investors. Leverage can work against you.
Stratos Markets Limited (www.fxcm.com):
CFDs are complex instruments and come with a high risk of losing money rapidly due to leverage. 64% of retail investor accounts lose money when trading CFDs with this provider. You should consider whether you understand how CFDs work and whether you can afford to take the high risk of losing your money.
Stratos Europe Ltd (www.fxcm.com):
CFDs are complex instruments and come with a high risk of losing money rapidly due to leverage. 66% of retail investor accounts lose money when trading CFDs with this provider. You should consider whether you understand how CFDs work and whether you can afford to take the high risk of losing your money.
Stratos Trading Pty. Limited (www.fxcm.com):
Trading FX/CFDs carries significant risks. FXCM AU (AFSL 309763), please read the Financial Services Guide, Product Disclosure Statement, Target Market Determination and Terms of Business at www.fxcm.com
Stratos Global LLC (www.fxcm.com):
Losses can exceed deposits.
Please be advised that the information presented on TradingView is provided to FXCM (‘Company’, ‘we’) by a third-party provider (‘TFA Global Pte Ltd’). Please be reminded that you are solely responsible for the trading decisions on your account. There is a very high degree of risk involved in trading. Any information and/or content is intended entirely for research, educational and informational purposes only and does not constitute investment or consultation advice or investment strategy. The information is not tailored to the investment needs of any specific person and therefore does not involve a consideration of any of the investment objectives, financial situation or needs of any viewer that may receive it. Kindly also note that past performance is not a reliable indicator of future results. Actual results may differ materially from those anticipated in forward-looking or past performance statements. We assume no liability as to the accuracy or completeness of any of the information and/or content provided herein and the Company cannot be held responsible for any omission, mistake nor for any loss or damage including without limitation to any loss of profit which may arise from reliance on any information supplied by TFA Global Pte Ltd.
The speaker(s) is neither an employee, agent nor representative of FXCM and is therefore acting independently. The opinions given are their own, constitute general market commentary, and do not constitute the opinion or advice of FXCM or any form of personal or investment advice. FXCM neither endorses nor guarantees offerings of third-party speakers, nor is FXCM responsible for the content, veracity or opinions of third-party speakers, presenters or participants.

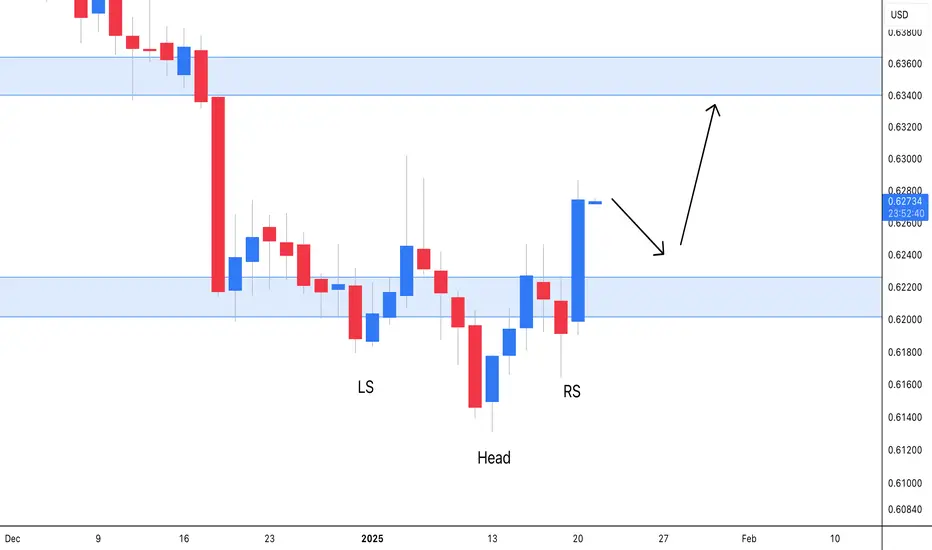
Inverse head and shoulder Makes HH and HL breakout of Lh and LL pair break last LH and makes new HH and HL in a sequence

AUDUSD BUY SETUPAU formed impulse close above major demand structure and also inverse H&S here. Watch the pull back or retest opportunities for the continuation up!
AUDUSDThe AUD/USD (Australian Dollar to US Dollar) currency pair is a major forex pair that represents the exchange rate between the Australian dollar (AUD) and the US dollar (USD). It is heavily influenced by commodity prices (especially gold and iron ore), interest rate decisions from the Reserve Bank of Australia (RBA) and the Federal Reserve (Fed), and global risk sentiment. As a risk-sensitive currency, AUD/USD tends to rise when markets are optimistic and fall during economic uncertainty. Traders often use it to gauge global trade trends and commodity market strength.

AUD/USD ( SYDNEY Session ) 30 Minute Mark Up Analysis 1/19/2025 Mark up at 1:30PM US Eastern Time ( Sunday )
Market currently not moving
Identified as Downtrend
Using Trendline on bottom side of price to depict downtrend
Resistance at 0.63000
Support at 0.61323
Price at 0.61869
Key Levels Identified in Blue Rectangles
Consolidation on tail right of chart identified in Red Rectangle
- looking for price to breakout towards bottom right on rectangle to confirm downtrend
Fibonacci Applied
- may see some retracement where middle key level has been identified, also hovering over the fibonacci
Price currently on a downtrend, but can break out to the upside before continuing to downside
Stop loss at (0.62128)
Tp1 at extension 0.27 (0.61719)
Tp2 at extension -0.618 (0.61526)
* 3:1 Risk/Reward RatioTrade
Full Take Profit (0.61115)
75/25 (0.61115/0.62128)

AUDUSD ANALYSIS 1H FORECAST Forex Trade Update: AUD/USD Analysis
Pair: AUD/USD
Trade Type: Buy
Entry Price: 0.62830 📈
Stop Loss: Initially set below the entry point and adjusted to the entry level upon hitting the first target. 🚫
Take Profit Levels:
Target 1: 0.63250 🎯
Target 2: 0.63760 🎯
Target 3: 0.64220 🎯
Analysis:
AUD/USD has broken out of the supply zone on the 1-hour timeframe, indicating a continuation of the uptrend. The EMA50 confirms bullish momentum. Enter long at 0.62830, with multiple target levels for partial profits. Upon hitting 0.63250, adjust the stop loss to the entry level to secure the trade and minimize risk.
Risk/Reward Ratio: Favorable
📊 Keep an eye on price action and EMA50 for further confirmation. Manage your trade carefully and stay disciplined!
#Forex #AUDUSD #EMA50 #Breakout #Trading #MarketUpdate


BUY TREND will be start soon in AUDUSD, Reversal pattern found..📈 AUDUSD Price Forecast 📈
In the smaller time frame, AUDUSD has formed an Inverse Head & Shoulders pattern, signaling a potential reversal. The price has successfully broken the 50 EMA and the neckline with a strong bullish candle, confirming the pattern.
On the 4-hour time frame, the pair has also broken above the 50 EMA and is now approaching a descending trendline. The reversal pattern and increased buying volume suggest that a breakout of the trendline is imminent, leading to bullish momentum.
🎯 Technical Target Levels:
- 0.6285
- 0.6350
- 0.6450
- 0.6535
- 0.6680 (Final target)
📌 Key Highlights:
- Confirmed Inverse Head & Shoulders in smaller time frame.
- Breakout of 50 EMA and neckline supports bullish sentiment.
- Increased volume indicates strong buying pressure.
- Watch for a breakout above the descending trendline for further confirmation.
✅ Stay Prepared!
Like, comment, and follow for real-time updates and accurate forecasts.
Don’t miss the bullish breakout—trade smart with expert insights! 🚀
📢 Join our community for more profitable signals and trading ideas!
#AUDUSD #ForexTrading #TechnicalAnalysis #TradingSignals

AUDUSD Bullish SETUP Ready??AUDUSD has created a bullish structure and is ready to fly high.
Follow risk management
Do not over risk
SWING TRADE SO Hold patiently

AudusdHopefully we resume live trades here as soon i get to Lagos.
Last year was just the warm up, this Year we Take over🤝

AUDUSD BUY AT DEMAND ZONE SMART MONEY CONCEPT Here on Audusd price from a demand around level of support 0.61962 and is likely to move up more so trader should go for long with expect profit target of 0.63432 and 0.65420 . Use money management

AUD/USD Surges Past 0.6200: Optimism Fuels the RallyIn the Asian trading session on Monday, the AUD/USD currency pair continued its upward movement, breaking above the 0.6200 mark. Traders are feeling hopeful as they approach the inauguration of US President-elect Donald Trump, despite the People's Bank of China's decision to keep the Loan Prime Rate steady. The Australian Dollar has faced challenges against a robust US Dollar but has managed to recover some lost ground recently, aided by a slight decline in the Greenback's value.
The US Dollar's rally, which started in October in tandem with the so-called "Trump trade," has exerted significant pressure on the Aussie. However, from a technical perspective, the Australian Dollar appears poised for a rebound around the demand zone at 0.6200, suggesting a potential retracement. We are considering a long position in this scenario.
✅ Please share your thoughts about AUD/USD in the comments section below and HIT LIKE if you appreciate my analysis. Don't forget to FOLLOW ME; you will help us a lot with this small contribution.

Could the Aussie bounce from here?The price is falling towards the pivot and could bounce to the 1st resistance which is a pullback resistance.
Pivot: 0.6179
1st Support: 0.6130
1st Resistance: 0.6284
Risk Warning:
Trading Forex and CFDs carries a high level of risk to your capital and you should only trade with money you can afford to lose. Trading Forex and CFDs may not be suitable for all investors, so please ensure that you fully understand the risks involved and seek independent advice if necessary.
Disclaimer:
The above opinions given constitute general market commentary, and do not constitute the opinion or advice of IC Markets or any form of personal or investment advice.
Any opinions, news, research, analyses, prices, other information, or links to third-party sites contained on this website are provided on an "as-is" basis, are intended only to be informative, is not an advice nor a recommendation, nor research, or a record of our trading prices, or an offer of, or solicitation for a transaction in any financial instrument and thus should not be treated as such. The information provided does not involve any specific investment objectives, financial situation and needs of any specific person who may receive it. Please be aware, that past performance is not a reliable indicator of future performance and/or results. Past Performance or Forward-looking scenarios based upon the reasonable beliefs of the third-party provider are not a guarantee of future performance. Actual results may differ materially from those anticipated in forward-looking or past performance statements. IC Markets makes no representation or warranty and assumes no liability as to the accuracy or completeness of the information provided, nor any loss arising from any investment based on a recommendation, forecast or any information supplied by any third-party.

AudUsd could rise to 0.65AUD/USD is another USD major pair that I’m bullish on.
As shown in the posted chart, AUD, like many other currencies, faced a challenging time during the final quarter of 2024.
However, after hitting a new low at the beginning of 2025, the pair has reversed course and broken back above the falling trendline.
Additionally, a combination of bullish reversal candles and the formation of an inverted head and shoulders pattern further supports the bullish outlook.
In this context, my strategy is to buy on dips, aligning with the positive technical setup.
