Ascending channel audusd buy now or never !Ascending channel lowest border is been hit for second time. If there is a time to buy, is now.
AUDUSD trade ideas

possibility of correction According to the behavior of the price in the current resistance range, possible scenarios have been identified.
It is expected that a trend change will take place and we will witness the beginning of a downward trend

audusd is bullishKey Points:
Australian private sector PMI numbers for May drew investor interest early in the Thursday (May 23) Asian session.
The Judo Bank Services PMI slipped from 53.6 to 53.1, while the Manufacturing PMI held steady at 49.6.
Later in the Thursday session, US jobless claims and the Services PMI also need consideration.
Near-term AUD/USD trends could hinge on the US Services PMI and Fed speakers. Hotter-than-expected US services sector activity could fuel investor bets on a September Fed rate hike and tilt monetary policy divergence toward the US dollar.

AUDUSD AUSTRALIAN DOLLAR NEXT LONGHi again,
AUDUSD pair has solid long positions backing in recent data and institutional futures positions.
After data release now the long from here 0.663 AUDUSD might work, but I prefer to wait for better position. I will build longs and stop loss accordingly to the long position I shared on chart.

Strifor || AUDUSD-31/05/2024Preferred direction: SELL
Comment: On the last day of this month, we will most likely have a busy day, where all the main events for the Australian dollar will develop at the level of 0.66460 . As always, we highlight two scenarios for the development of events.
Scenario №1 is the most probable expected maneuver in the market for today, where, most likely, the price will accumulate below 0.66460 and then fall to support at the level of 0.66000. There is also an alternative option called scenario №2 , where entry is also assumed near the level of 0.66460 , but after the formation of a false breakout.
Additional comments on this trade will be provided as situation changes. Follow us!
Thank you for like and share your views!

AUD/USDWe can see continuation towards the upside as i forecast, wait for a good time & look for buying opportunities

sellGoldium Trade Hub
Our Purpose is to give daily position, kindly follow below instruction in order to get positive result.
❇️ Use fix lot size for all your position ( we recommend to use 1% of your account for each postion ).
❇️ Do not enter position if its away from entry point.
❇️ Do not close position before target price unless instruction given.
❇️Three maximum trade per day so please enter all position.
❇️ If we get multiple stop loss do not scare and continue following our instruction and enter given positions.

AUD/USD Bears In ControlWhile the AUD/USD shows signs of trending higher on the daily chart – a series of higher highs and higher lows have been seen since $0.6362 – the unit recently connected with resistance at $0.6659, a move bolstered by the monthly chart linking with the upper boundary of a potential bearish pennant formation, drawn from a high of $0.7158 and a low of $0.6170.
Coupled with the above analysis and the Relative Strength Index (RSI) holding south of the 50.00 centreline on the monthly chart and daily flow also poised to break through the 50.00 centreline, this could prompt further selling in the currency pair towards the 200-day and 50-day SMA combination between $0.6528 and $0.6560.

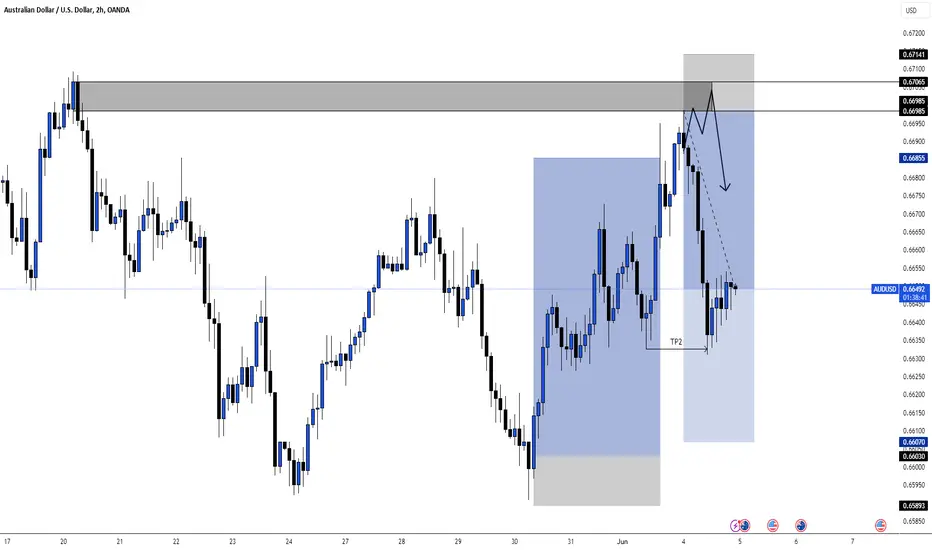
CHART BREAKDOWN AUDUSD: Key Levels, Targets and Thoughts!Trade Update: AUD/USD
We have some great news on our recent AUD/USD trade! 💲
After analyzing the market conditions and identifying a solid setup, our trade has successfully Hit Take Profit 2 (TP2). This made sure that 80% of our positions have been secured and cashed out some of our gains, allowing us to lock in profits and reduce risk.
Following this, we moved our stop loss to TP1 to ensure no loss on the remaining position. This strategy not only protects our capital but also gives us the opportunity to capture further potential gains with zero risk on the table and cashing out on TP3s.
Stay tuned for more updates and happy trading! 🚀
AUDUSD TRADE SETUPWait for retest the entry level then take a trade for Buy otherwise skip this setup

AUDUSD LONGMarket Structure Bullish on HTF
Entry at Daily Level
Weekly Rejection at AOi
Daily Rejection at AOi
Daily Previous Structure Point
H4 Candlestick rejection
H4 Previous Structure Point
Levels 4.98
Entry 90%
REMEMBER: Trading is a Game Of Probability
: Manage Your Risk
: Be Patient
: Every Moment Is Unique
: Rinse, Wash, Repeat!
: Stay Hydrated
#Follow#Share#Comment#Boost

AUDUSD - 2 of 2 sell trade and last possible transaction according to the analysis,
as we can see, we have a bearish orderflow, so it makes sense to take this sell

AUDUSD buying Trading IdeaHello Traders
In This Chart AUDUSD HOURLY Forex Forecast By FOREX PLANET
today AUDUSD analysis 👆
🟢This Chart includes_ (AUDUSD market update)
🟢What is The Next Opportunity onAUDCAD Market
🟢how to Enter to the Valid Entry With Assurance Profit
This CHART is For Trader's that Want to Improve Their Technical Analysis Skills and Their Trading By Understanding How To Analyze The Market Using Multiple Timeframes and Understanding The Bigger Picture on the Chart

AUDUSD Analysis Dear traders AUDUSD broke out the up trend channel, and formed a bearish sequence on high frame, and it's now on a supply zone (golden fibo) between 50 and 61.8 level to go short.

AUDUSD OUTLOOKSimilar approach to NZD, although i consider AUD to e weaker than NZD. Both currencies are still bullish with seasonality.

AUD/USD: Analysis for the week of 03/06/24AUD/USD Bullish for the week of 03/06/24
All confluences there so far

Impulsive Wave Rally: AUD/USD Targets 0.70750.Hello traders,
Here is my analyis of AUDUSD pair.
After AUD/USD completed an upward impulsive wave labeled as wave (1) in the chart, the pair is expected to form a minor correction in wave (2) before continuing the impulsive upward wave (3), consisting of five subwaves. Based on our analysis, waves (1) and (2) have already formed, and it appears we are currently in wave (3).
We expect a rally from this zone following the shallow wave (2) correction.
The channel break indicates potential reversal areas, suggesting the start of a continued upward phase towards the 0.70750 level as a potential target in the bullish direction. However, a lower low below 0.63623 would invalidate the bullish scenario.
Alternative Scenario:
The alternative scenario is a further drop in wave (2) towards the 0.64977 price region marked by blue box before the rally to the upside.

AUDUSD, getting ready for flight to 0.70.AUDUSD is registering huge net buy volume on the weekly data suggesting a shifting trend to the upside long term.
Higher lows on weekly histogram and pricing has been created cementing the current range as the new base for the series of price growth. It is now sitting at 61.8 FIB LEVELS -- an area where buyers converge.
Expect more upside valuation for the pair in the near term.
Spotted at 0.6650
TAYOR
Safeguard capital always.

Aussie H4 | Approaching pullback supportThe Aussie (AUD/USD) is falling towards a pullback support and could potentially bounce off this level to climb higher.
Buy entry is at 0.6601 which is a pullback support.
Stop loss is at 0.6569 which is a level that lies underneath a pullback support and the 50.0% Fibonacci retracement level.
Take profit is at 0.6665 which is a pullback resistance.
High Risk Investment Warning
Trading Forex/CFDs on margin carries a high level of risk and may not be suitable for all investors. Leverage can work against you.
Stratos Markets Limited (www.fxcm.com):
CFDs are complex instruments and come with a high risk of losing money rapidly due to leverage. 68% of retail investor accounts lose money when trading CFDs with this provider. You should consider whether you understand how CFDs work and whether you can afford to take the high risk of losing your money.
Stratos Europe Ltd, previously FXCM EU Ltd (www.fxcm.com):
CFDs are complex instruments and come with a high risk of losing money rapidly due to leverage. 70% of retail investor accounts lose money when trading CFDs with this provider. You should consider whether you understand how CFDs work and whether you can afford to take the high risk of losing your money.
Stratos Trading Pty. Limited (www.fxcm.com):
Trading FX/CFDs carries significant risks. FXCM AU (AFSL 309763), please read the Financial Services Guide, Product Disclosure Statement, Target Market Determination and Terms of Business at www.fxcm.com
Stratos Global LLC (www.fxcm.com):
Losses can exceed deposits.
Please be advised that the information presented on TradingView is provided to FXCM (‘Company’, ‘we’) by a third-party provider (‘TFA Global Pte Ltd’). Please be reminded that you are solely responsible for the trading decisions on your account. There is a very high degree of risk involved in trading. Any information and/or content is intended entirely for research, educational and informational purposes only and does not constitute investment or consultation advice or investment strategy. The information is not tailored to the investment needs of any specific person and therefore does not involve a consideration of any of the investment objectives, financial situation or needs of any viewer that may receive it. Kindly also note that past performance is not a reliable indicator of future results. Actual results may differ materially from those anticipated in forward-looking or past performance statements. We assume no liability as to the accuracy or completeness of any of the information and/or content provided herein and the Company cannot be held responsible for any omission, mistake nor for any loss or damage including without limitation to any loss of profit which may arise from reliance on any information supplied by TFA Global Pte Ltd.
The speaker(s) is neither an employee, agent nor representative of FXCM and is therefore acting independently. The opinions given are their own, constitute general market commentary, and do not constitute the opinion or advice of FXCM or any form of personal or investment advice. FXCM neither endorses nor guarantees offerings of third-party speakers, nor is FXCM responsible for the content, veracity or opinions of third-party speakers, presenters or participants.

AUD/USD - H4 Chart AnalysisThe H4 chart for AUD/USD shows a potential range in play between the 0.6670 and 0.6600 price points. The penultimate candle of the final session showed a big rejection of the top of the zone. We may see price continue lower in this new week to test the lower part of the range.

AUDUSD: maintaining narrow range accumulationAUDUSD: The AUD withinside the quick time period is likewise preserving a slender accumulation variety with a corrective downtrend wherein the aid place of 0.6590 is likewise touching the EMA200 withinside the H4 frame. The predicted situation is that AUDUSD may also lower from the modern-day rate variety. If AUDUSD falls beneath 0.6590, it'll verify a longer-time period downtrend. It is usually recommended to promote with this forex pair.

AUDUSD BUYHi fellow traders, AUDUSD is ready to make a move higher from the blue box after completing the correction. Target the 0.6751 level and move your stoploss to break even as soon as we reach the ‘Risk free zone’. Good luck and trade safe!

AUDUSD LONGPrice Action Day Trading
Daily Bias: Bullish
POI: Price retrace back into H4 support horizontal level and rejected from that. Price went bullish breaking through bearish trendline and H1 resistance level. H1 TF, price formed a double bottom with a strong horizontal level of the neckline.
Setup: H1 Broken neckline set a long trade with SL below double bottom swing low. Targeting next daily swing high with R:R 1:6.
