Pump itIt is suggested that we lower stop loss 2 dollar More so add -2 dollars to stop
Divergence + reversal pattern
Good luck. Not financial advice
TL01 trade ideas

Tesla stock might be heading down to 118 $ Stock : Tesla
Share price : 171.70 $
Stock financially : Down, as the stock price overvalue
Trend ( technically ) : down
Recommendation : Sell
Reason : mentioned on the chart
Technical analysis failure at price 192 $ : ( Where the resistance and downtrend line have been breached )
Technical analysis success at price 118 $ : ( Where the bear flag pattern target is achieved )

Tesla Valuation back to 2010 IPO$TSLA has had wild swings in valuation from under 2 times sales and over 20 times sales in the past few years. Granted, you have to know the future to know what the sales are, but in 2019 it was insanely cheap just as the Model Y was just starting to sell. The MODEL Y is why Tesla has done so well in my opinion. It has dominated and is still growing insanely fast and taking out the competition. The car is amazing. From the first moment I drove it using Turo out in the snow in Montana in 2020 I knew it was a world-car and it was in the largest segment which is Crossover SUV. After the Model Y started dominating, the valuation of Tesla then got up to over 20 times sales, which is beyond insane.
Markets provide you with opportunities to buy when things are cheap, but there are uncertainties. Then the market provides you with opportunities to sell when things are expensive, but the momentum and price gains are so strong that it is tempting to hold on. The best thing you can do is learn how to act in both situations. Also, it is OK to watch a stock go higher AFTER you sell. Let go of the need to think you are the smartest person in the market. The person buying from you deserves the right "to be right" for awhile too.
So where does $TSLA stand now? In the middle between expensive and cheap. If Tesla goes lower, it gets cheaper and as sales growth continues it will drive the PSR down near 5-4 within 12 months. Will Tesla see 2 times sales again? I doubt it because at 2 times sales before it had a lot of debt ($10B and there were survival concerns at that time along with a VERY LOW investment grade rating in the junk-status category.) Now the opposite is true. Tesla has billions in cash and enough capital to buy back stock and still meet their capital spending for many years.
To step back and view the situation from a rational perspective, you have to look at the extremely high valuation that Tesla reached in the bubble of 2020-2021-2022. Step back and look at the long term valuation and trends.
Stay tuned.
Tim
9:20AM-9:37AM Thursday, November 10, 2022
184.24 last $TSLA

TSLA will bounce backTSLA fell even more today but no need to worry. Buy while you can. The best time to buy iswhen everyone in the market is scared. Get in while you can.

Is this all a head and shoulders?The structure of the overall trading of TSLA in the last few years now builds up a huge head and shoulders.
Head and shoulders can be a really fickle pattern with more of them failing than succeed but something that's interesting in this move is we also have selling starting from what could be a harmonic correction building the right shoulder.
Were TSLA to be forming a head and shoulder on this scale the implied move would be a total disaster for bulls. This would forecast a low WAY under where many people think is in any way possible.
TSLA is also a candidate for the last spike out move shown in the below example. It would be further along in the development.

Looking bearish on tsla at close today for a swing!🔉Sound on!🔉
Thank you as always for watching my videos. I hope that you learned something very educational! Please feel free to like, share, and comment on this post. Remember only risk what you are willing to lose. Trading is very risky but it can change your life!

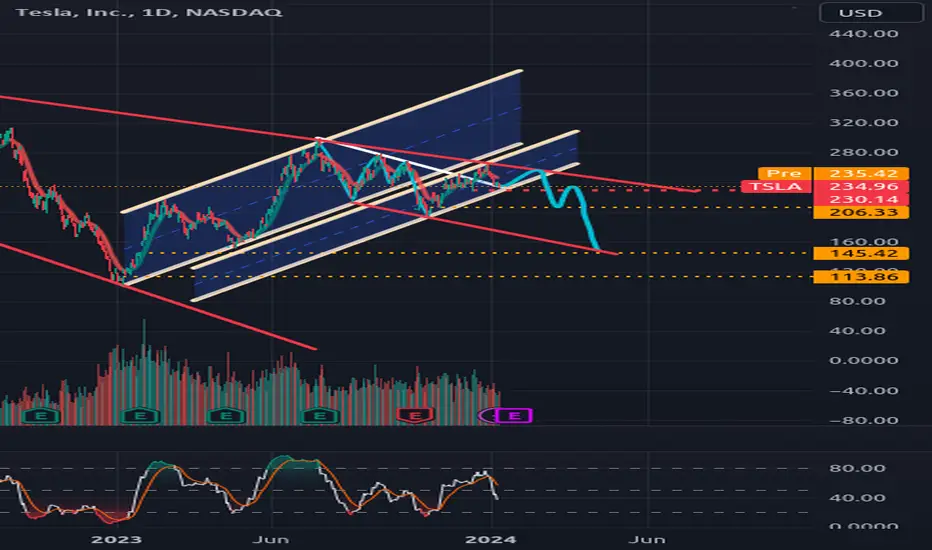
TSLA is F#KT?It is pretty simple. Unless the dotted red line at $230, in partnership with the rising white channel, we're likely to see $205. On the flip side, I don't think it is unlikely to see us test the descending red trendline and get into the $250s. If that downward trend is broken, we may see some upside. But the EV market is becoming saturated, people are losing faith in Elon, and TSLA is getting stodgy (my opinion, ofc). So these are key levels to watch. What do you think?
TSLA | Decision Point | 30%Tesla needs to bounce here, or it's over. The target of the trade is the upper bound of the declining channel, around $225.
It looks weak overall, so be careful with sizing and use a stop loss.
If it doesn't bounce here you can switch position and short it towards the 2023 low around $101.

Tesla's fundamentals along with a simple chart patterns.In 2023, global EV sales reached 13.6 million units, up over 30%. China dominated with 7.9 million units sold, expected to hit 10 million in 2024. BYD sold 3 million EVs, including 1.6 million BEVs, while Tesla delivered 1.8 million BEVs, capturing 19% of the market. Tesla sold 700,000 vehicles in the US and Canada, 600,000 in China, and 400,000 in Europe. Tesla's shares fell 29% this year, while BYD's dropped nearly 6%.


SHORT TSLA 250shorted TSLA 250
Stop 5% above looking for 10-20% downside from this level back towards 200

Tesla's getting ready for a bounce. Positive DivergenceTesla's is oversold and is getting ready for a bounce.
We have a positive divergence of the RSI and the Stochastic RSI is flipping from negative to positive with an imminent bullish crossover.
Time to DCA aggressively?


TESLA STOCK: WHY IS NO ONE SEEING THIS????2014 - 2019, we formed this very distinct support level that had 3 touch points before price took off...
The last 2 touch points out of the 3 during 2014-2019, saw the weekly RSI dip below 30
2022 we dipped below 30 & formed our 2nd touch point of this cycle
When Weekly RSI hits 30 again, $110 could literally be the zone we bottom at before the mega rally

Tesla to bottom within next month or 2Let the sentiment drop off a cliff for NASDAQ:TSLA Stock...
Expecting a sell off until we reach bottom potentially around 136 or 125. Worst case is $109.
As soon as our ultimate indicator flashes green, that will be the time to buy

TSLA-SELL strategy Weekly chartTSLA is in the weakness mode, and even though we may see some pullbacks short-term, the SHOULDER-HEAD-SHOULDER pattern with neckline $ 213 is broken. Any corrective action between here and $ 200.00 should be sold for a move to $ 130.00 area.
Strategy SELL @ $ 170-190 and place SK above $ 225 and take profit @ $ 140.00.

$TSLA been saying this for a while now.For those who listened and believed the newbie trader here lol you made money :D
Tsla broke the golden bridge (neckline) on that big ass H&S (head and shoulders) pattern.
Now it's sitting on its last line of defense of 153.70 before filling that GAP --> 145s. then i honestly believe ER will be a sh**show. so yep, there is HUGE possibility for tessie to touch 120-110s

I just can't see it dumping tomorrowLook at the bullish divergence we have on Tesla. It's just ridiculous that they've been able to get the price this low. I think we are going to get a massive gap up starting at premarket open. I just don't see how they can get it to go down anymore. We're oversold, we're on the trendline, and we have bullish divergence. I think this stock HAS to pump in the morning. I don't know if there is going to be any news associated with it, or if it will simply be the price that causes the pump tomorrow, but I am 90% confident that Tesla will in fact be extremely green tomorrow.

FALLING WEDGE BULISHSeems that we have a nice falling bullish wedge on the Daily/ Weekly. Nice support at 147 ish and also that will close the CME gap. I would say a nice bounce is coming

The best position in 2024Fundamental analysis tells us that the S&500 index will start its upward rally from June or July 2024, and in my opinion, the best share in terms of technical analysis is Tesla's share, and in this green area and reaching the upward trend line or if conservative We are more active, we have to wait for the downward trend line to break upwards, in this case we can take a long position.

TESLA LONG IDEA ALL trading ideas have entry point + stop loss + take profit + Risk level.
hello Traders, here is the full analysis for this pair, let me know in the comment section below if you have any questions, the entry will be taken only if all rules of the strategies will be satisfied. I suggest you keep this pair on your watchlist and see if the rules of your strategy are satisfied. Please also refer to the Important Risk Notice linked below.
Disclaimer

$TSLA, Not trading this, a good friend asked, why not share it Good morning,
After btc TOP TOP, I might add TSLA to my Portfolio...
Here is full LONG TERM analysis. you can see CLEARLY when to sell and when to buy.

Mind the Gap: How to Trade Price GapsThe Power and Beauty of Price Gaps
Price gaps represent a clear imbalance in supply and demand, making them one of the purest representations of momentum in financial markets. These gaps occur when there is a significant disparity between the closing price of one period and the opening price of the next, indicating a sudden surge in buying or selling pressure.
How to Trade Price Gaps: 3 Different Strategies
1. Gap & Go:
Description: This strategy involves trading in the direction of the gap, anticipating that the momentum will continue.
Execution: Enter trades as soon as the market opens, aiming to capture the initial momentum surge.
Timeframe: Typically applied on shorter timeframes, such as intraday charts.
Risk Management: The gap can be used for stop less shelter, hence stops can be placed above (below) the gap.
Example: Tesla (TSLA) 5min Candle Chart
In this example, Tesla gaps lower at the open – breaking below a key level of support and signalling the breakdown of a sideways range. The gap follows through to the downside during the remainder of the trading session.
Past performance is not a reliable indicator of future results
2. Gap Fill:
Description: In contrast to the Gap and Go strategy, this approach involves fading the initial price movement and trading in the opposite direction of the gap.
Execution: Wait for price to retrace back to pre-gap levels before entering trades, anticipating that the gap will eventually be filled.
Timeframe: Can be applied on various timeframes, depending on the magnitude of the gap and market conditions.
Risk Management: Implement stop-loss orders to manage risk, as price may continue to move against the trade.
Example: Barclays (BARC) Hourly Candle Chart
Barclays gap above key resistance on the hourly candle chart. The gap is filled and broken resistance turns to support prior to the uptrend resuming.
Past performance is not a reliable indicator of future results
3. First Pullback:
Description: This strategy combines elements of both Gap and Go and Gap Fill, focusing on entering trades after the initial momentum surge but waiting for a pullback or consolidation before entry.
Execution: Wait for the first pullback or consolidation after the gap before entering trades in the direction of the prevailing momentum.
Timeframe: Suitable for both shorter and longer timeframes, depending on the magnitude of the gap and market dynamics.
Risk Management: Utilise stop-loss orders to protect against adverse price movements and adjust position sizing based on volatility.
Example: Arm Holdings (ARM) Hourly Candle Chart
Arm’s share price puts in a large price gap which breaks decisively above a key level of resistance on the hourly candle chart. Given the size of the gap, optimal entry requires waiting for the market pullback.
Past performance is not a reliable indicator of future results
Additional Factors to Consider
Catalyst Behind the Gap:
Look for stock-specific news events that recalibrate market expectations, such as earnings surprises or changes in outlook.
Mechanical events like dividends or corporate actions are less likely to sustain momentum.
Size of the Gap:
Larger gaps indicate stronger momentum but also carry a higher risk of mean reversion.
Assess the magnitude of the gap relative to historical price action and volatility.
Levels Broken:
Consider the significance of key support and resistance levels broken by the gap, as they may influence the strength and direction of the price movement.
Prevailing Trend:
Analyse the prevailing trend before the gap and assess whether the gap aligns with the overall market direction.
By incorporating these factors into your analysis and selecting the most suitable strategy based on market conditions, you can effectively trade price gaps and capitalise on momentum opportunities in the financial markets. Remember to exercise proper risk management and adapt your approach as market conditions evolve.
Disclaimer: This is for information and learning purposes only. The information provided does not constitute investment advice nor take into account the individual financial circumstances or objectives of any investor. Any information that may be provided relating to past performance is not a reliable indicator of future results or performance. Social media channels are not relevant for UK residents.
Spread bets and CFDs are complex instruments and come with a high risk of losing money rapidly due to leverage. 84.01% of retail investor accounts lose money when trading spread bets and CFDs with this provider. You should consider whether you understand how spread bets and CFDs work and whether you can afford to take the high risk of losing your money.
