AA1 trade ideas

Alcoa's Shining Knight?: Bullish Shark Edition?Alcoa has had the unfortunate circumstance of being thrown in the same group as many companies who are suffering because of the drastic fall in commodity prices. Currently there are two patterns targeting around 8.50-8.80. One is a bullish shark that has a potential PRZ between 8.78 and 8.57. The other is an AB=CD pattern targeting a PRZ at the 1.272 extension at 8.62. The overall PRZ zone(the gray box area) may be a good place to buy in or cover any short positions. Good Luck.


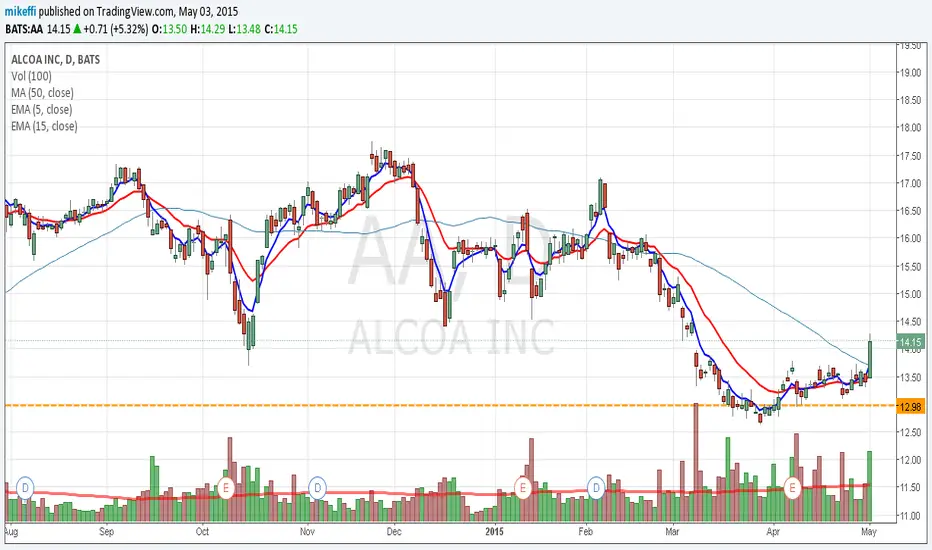
AA leads the materiasl chargeA strong move back by high volume in Fridays trading pushing the underlying stock up significantly and over $14 which we would consider an important price point. Consider a diagonal call spread to take advantage of currently high yield on a move over $14.25
Alcoa: Already Reversed?A good short candidate along with Google( )
The rally hit a long term resistance at 17.75 before stalling
After hitting that resistance, a head and shoulders formation completed on the weekly chart
The price broken out below the neckline of the head and shoulders confirming the pattern
The price broken below the 52-week Simple moving average
A Minor upside pullback towards the shaded area could provide a better shorting level in terms of risk-reward
Main target is at 10.00 major level
Stability back above 16.00 may be the invalidation of this setup
Good luck...
thefxchannel.com , visit.. vote and subscribe. Thank you
twitter.com
My best regards
Technician

AA reports and declinesas posted, but SPY up?AA reacted as i thought, but baffled by market reaction, searching for reasons why. If SPY has broken the three drivers pattern, the bulls may just have their way. Unless this is a dead cat bounce, or yet another or maybe a last attempt to keep the bull that simply die alive by artificial means, which they are very good at. Baffled is the word.
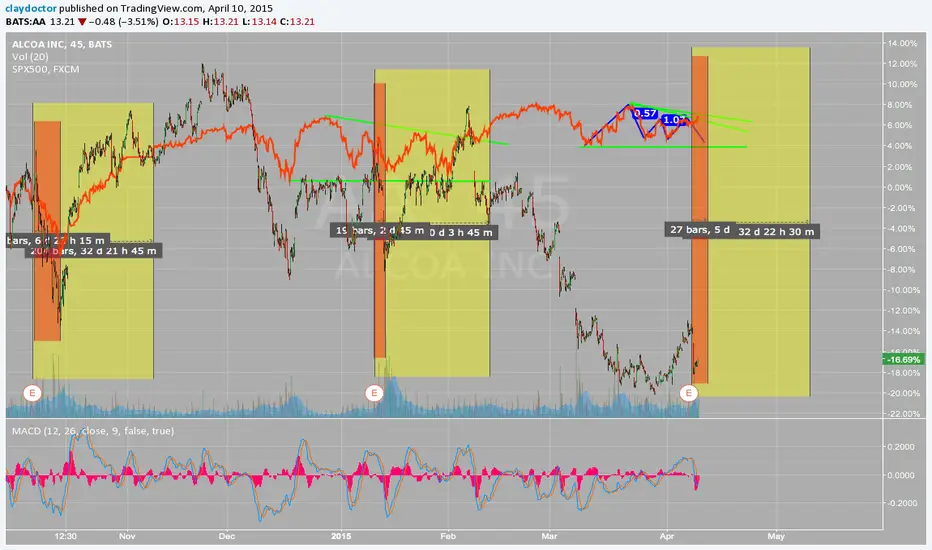
Had a great ruin higher after getting kicked out of the DJIAThen consolidated back half of 2014 and into 2015 before February pullback. Looks solid reversal into earnings, BB's starting to open

Alcoa thoughts ahead of earnings4 out of the last 5 earnings, market reaction was down (and one gap down) for an average of 5 days, then a significant bounce back and then some. Its been down to a base, and now up to??? HOWEVER, using RSI as an indicator, we are reaching overbought. Interesting how oil is right at its decision moment, will we breach through the resistance or bounce down, taking alcoa with it, and other commodities. What OIL camp are you in? Have we seen the lows yet, or not? That is the question. And half of the quarter has been down for aluminum prices.

Alcoa Kicks Off Earnings Season Again -April 8, 2015Alcoa (AA) kicks off the Earnings Season in the S&P500 each quarter. Here is a chart of the first month of "earnings season" which starts when AA announces.
Alcoa appears to be negatively correlated to the market, which goes against conventional wisdom. If you look at how Alcoa is positioned between earnings reports, you can see that if Alcoa is down in price between earnings reports it has been good for the market. When Alcoa is up between earnings reports, the first month of earnings season has been weak or down.
A RISING ALCOA has led to weak first month of earnings season SPY price action.
Tim 4/7/2015 3:48PM EST 207.64 last SPY, 13.44 Alcoa (AA)

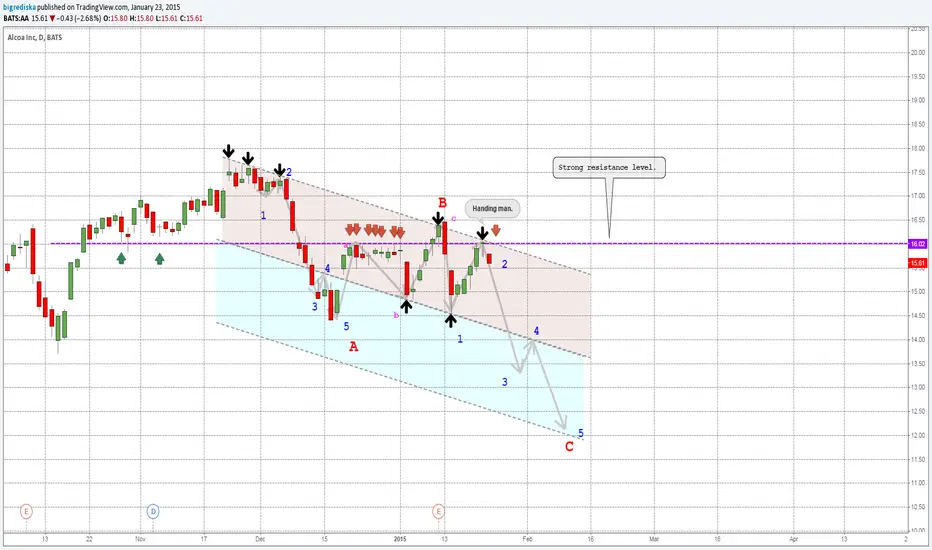
Alcoa is showing signs of weakness$AA has been consolidating around 15.60, which makes it a choppy stock with LH-HL. There is no clear trend at this point. However the signs of the long term trend show weakness, both in the trend and momentum. It has tried to break the magic 18.00 value that would make it skyrocket, but after the double top the next attempt barely reached 15.90, Not enough and actually a pivot point for a downtrend channel.
The support of the 34 ema is holding, but if it is broken the next stop to the downside will be the 0.618 Fib, It will retest that former high. Chances are it will rebound supported by the 89 ema.


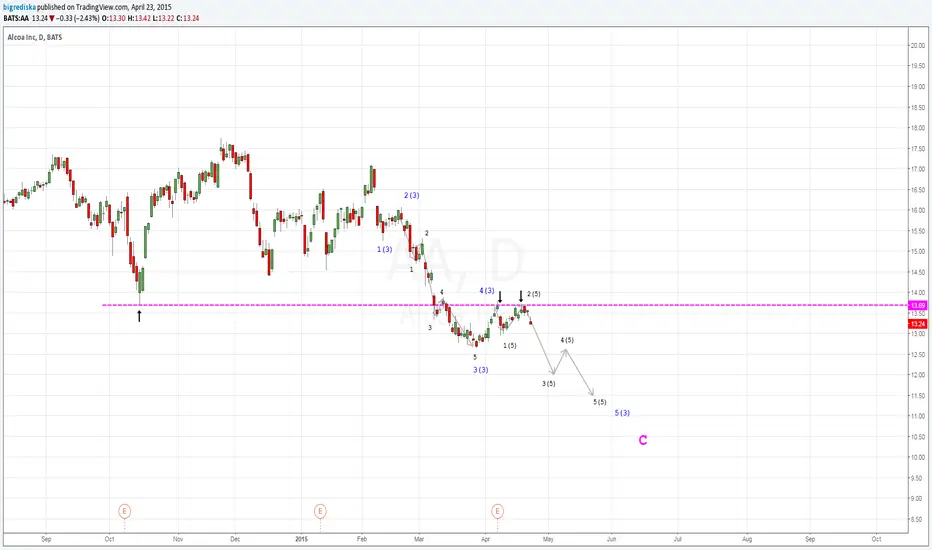
Head and Shoulders is formingJan13: Head and Shoulders forming. The triple momentum divergence is the signature of the H&S pattern. Even though Earnings was good, the market reaction was not so good. If this is the case then this could fall as low as 12.63 where the 50% retracement of the rally is marked. Keep an eye on the rotation of the fast ribbon (orange) if the price doesn't go back above 16.50 then the market will probably just dump it. and will retry breaking the 18 Strong resistance at a later time.
Entry @15.50 Target1:15.25, Target2:13.80, Target3:12.63. Stop@16.50


Elite Zone pre-earnings setup exampleThis setup was one of several setups sent today to the Elite Zone members in the weekly members stock markets analysis.
If $AA will continue its climb (after a strong weekly candle from last week) and reach the resistance zone near 17$, it will also complete a bearish Bat pattern.
17$-17.5$ will be an interesting zone to look for intra-day reversals that can trigger short entry for those who wish to trade this bearish harmonic pattern.
If you like this analysis and you want more.. join the Elite Zone members via the MarketZone website:
www.themarketzone.net

AA, 1st to announce earningAlcoa will be first company to report earnings ushering into 2015.
Just my little speculations on where the direction of gap will be for better than expected or deteriorating earnings.

AA- The start of earning s season- Gap play possiblitiesGap Season is starting with AA posting earnings.Since AA has trade bullish the last 4 days a gap down below 14.85 would be a possible Gan n Go trade (enter the trade in the first few minutes of trading because of criteria met ). I would only trade in the direction of the gap , so if I didn't trade right away i would wait for a pullback and trade bearish (if i can get a decent R : R ) and only risk 1 R. If AA gaps down depending on the location (15.55) might be looking to get in bearish if there is a decent pullback or a perfect entry in the first few candles that it's worth the 1 R risk.
Last time AA posted earnings leading up to earnings 10-8 -14 look very similar to the candles leading up to the earning s tomorrow. AA gapped up and then traded down rather aggressively. We are at those same levels who knows?
There is a lot i didn't explain mostly because I'm not really the one to be teaching this type of trading but i would love any gap trading input especially fades.
If you want to learn more go to www.reallifetrading.com.

Only 3 days remain until US Earnings Season Begins! Alcoa reports on January 12th to kick off the next "Earnings Season"!
Get ready for action.
The red boxes represent the "DOWNSIDE" price action of the market from the start of the Earnings Reporting season as measured by Alcoa reporting earnings. You can see we have had a variety of quarters with some very small downside risk and the last two have been larger than average. I personally think this is a better or more intuitive barometer than the January effect or the first day of January predicting the year head.
I love January the most of all the months of trading for a number of reasons, perhaps you can say which is your favorite month to trade, then I'll explain why I love January the most.
All the best,
Tim 9:56AM EST Friday, January 9, 2015

Multiple Tops looking to break above 18DEC08:Multiple Tops at the 17.75 level, unable to break this historic level plus a weakening trend and a negative divergence make this stock to think it over before retrying the break above the 2011 levels.
It looks like this will take a break before attempting a close above 18 again. It has support at the 14 level.
I am bearish in the short term, looking for 15.30 looks a reasonable target to the downside and an opportunity for the stock to retry another upleg looking for the 18 value once it reaches the 0.764 Fib Level.
I wouldn't short it for too long since the main trend is bullish,

Alcoa Inc (H1)Alcoa Inc (H1)
Price hit long term uptrend_line from beneath, resistance and formed a triangle like formation, and broke down from it, and under Wedge, and long term horizontal line. (could be a pennant continuation-bullish, in case of recovery)
Wolfe Waves 5 potential.
OBV at horizontal resistance.
RSI geometry, brake_down from triangle like formation, on longer term support, at 44, potential bounce and brake_down.
