Micro S&P 500 Futures
6,317.00USDD
+7.50+0.12%
As of today at 14:52 GMT
USD
No trades
WSP1! trade ideas

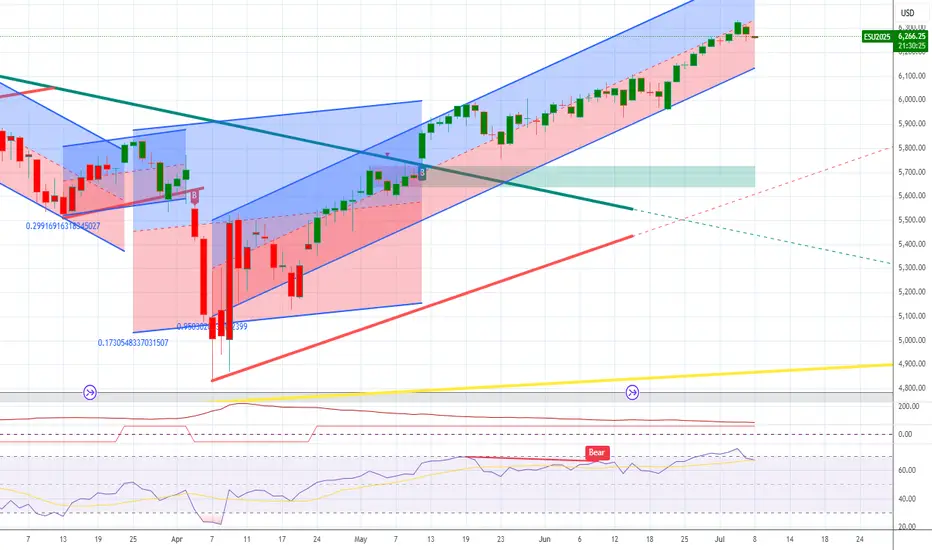
Accumulation to Acceleration ESThis chart shows a long-term market analysis using Elliott Wave Theory, suggesting the market is currently in Wave 4 and preparing for a big Wave 5 rally.
📈 Past yearly moves averaged 15–21%, with 30%+ currently and up to 66% historically.
🟩 A "rebalance" zone (accumulation phase) is forming before a possible breakout.
📊 The next move projects a +60% rally, targeting 7,112 to 7,570.
🔁 Historical patterns and past rallies are being used to support this bullish forecast.
Bottom line: If history repeats, a strong upward move is expected soon.

DIYWallSt Trade Journal: Starting Down $400 & Patience Pays Off 07/09/25 Trade Journal, and ES_F Stock Market analysis
EOD accountability report: -271
Sleep: 4.5 hours
Overall health: Good
VX Algo System Signals from (9:30am to 2pm) 4/4 success
10:00 AM VXAlgo ES X1 Sell Signal
10:36 AM VXAlgo ES X3 Sell Signal
11:00 AM Market Structure flipped bearish on VX Algo X3!
1:33 PM Market Structure flipped bullish on VX Algo X3!
What’s are some news or takeaway from today? and What major news or event impacted the market today?
I took some short positions overnight and got caught in the big push up this morning and started the day with -400, I was very tempted to go big and tried to trade it back but decided it was better off just to wait for a better day to recover the account instead.
Consider yesterday was a big manipulation day and today was another one but squeezing to the upside for a rug pull downwards.
News
*(US) FOMC JUN MINUTES: COUPLE OF PARTICIPANTS NOTED THEY WOULD BE OPEN TO CONSIDERING A RATE CUT AS SOON AS THE JULY MEETING IF DATA EVOLVE AS THEY EXPECTED (Bowman and Waller have said as much since the FOMC meeting)
What are the critical support levels to watch?
--> Above 6290= Bullish, Under 6280= Bearish
Video Recaps -->https://www.tradingview.com/u/WallSt007/#published-charts

In forty years of trading, I have tried a lot of methods....In forty years of trading, I have tried a lot of methods. Over the years, things have changed. Right now, I swing trade S & P 500 Index ETFs through a commission free broker off this chart
GLOBEX FUTURES and this one single indicator. I always enter after the daily close, in the aftermarket. Trade at a price, a limit order "all or none". NOTE: You must chart FUTURES to get the signal at 6:00 PM NYC time in order to have it to position in the aftermarket. if you, chart SPX cash market, the TradingView "runtime" won't show the signal until the RTH opening "tomorrow". NO GOOD ...because overnight trading can gap the cash market. Try 5 minute chart for DAY trading Futures: use only RTH ! try configuring 3, 7, and 13, "swing" values. Happy trades! P.S. I am long right now SPX ETF.

Risk On! Buy Stock Indices, Sell Gold, Silver.In this Weekly Market Forecast, we will analyze the S&P 500, NASDAQ, DOW JONES, Gold and Silver futures, for the week of June 29 - July 4th..
Stock Indices are pointed to the all time highs. Take advantage of the "risk on" environment while it lasts!
Gold and Silver have seen the outflows and profit taking... so look for lower prices this week.
Oil ... be patient. After a huge dump in prices when the tensions eased up between Israel/US and Iran, price is moving sideways in consolidation. I suspect lower prices to come, but I urge patience! Wait for the signature of price to show it intends to move lower. A sweep of the range highs and a run of the range lows right after... is the signal to sell.
Enjoy!
May profits be upon you.
Leave any questions or comments in the comment section.
I appreciate any feedback from my viewers!
Like and/or subscribe if you want more accurate analysis.
Thank you so much!
Disclaimer:
I do not provide personal investment advice and I am not a qualified licensed investment advisor.
All information found here, including any ideas, opinions, views, predictions, forecasts, commentaries, suggestions, expressed or implied herein, are for informational, entertainment or educational purposes only and should not be construed as personal investment advice. While the information provided is believed to be accurate, it may include errors or inaccuracies.
I will not and cannot be held liable for any actions you take as a result of anything you read here.
Conduct your own due diligence, or consult a licensed financial advisor or broker before making any and all investment decisions. Any investments, trades, speculations, or decisions made on the basis of any information found on this channel, expressed or implied herein, are committed at your own risk, financial or otherwise.

Backtest $ES 15 minTest for analysis of trend with OBR in 15 min. Testing the possibility to OBR in NYSE:ES

MES Futures – ORB Strategy Long from London Open Range BreakDescription:
Executed a clean ORB long trade on MES during the London session, with confirmation from the 5-min chart and structure mapped on the 15-min.
Setup Breakdown:
Session: London Open
Strategy: Opening Range Breakout (ORB)
Entry: Break of ORB high with confluence from 15-min demand zone + EMA support
Stop: Below session low and structural demand
Target: Previous session high & key 1HR supply zone
T echnical Context:
Price rejected from previous session low and formed a clear ORB range.
After consolidation, a strong bullish candle broke above the range high with increasing volume and EMA cross.
Trade was managed up to the previous session high and partials secured before price met the diagonal resistance trend line.
Key Zones:
✅ Entry Zone: 6270.00
🟥 Stop Loss: ~6260.25
🎯 Target Area: 6287.75 (Previous Session High)
🟥 15-min Supply overhead could pose resistance
Staakd Rating: ★★★★☆
(Rated 4/5 for textbook ORB play, clean risk:reward, and structure alignment)


07/08/25 Trade Journal, and ES_F Stock Market analysis EOD accountability report: +220
Sleep: 7 hours
Overall health: Good
VX Algo System Signals from (9:30am to 2pm) 4/4 success
— 9:30 AM Market Structure flipped bullish on VX Algo X3! :check:
— 10:30 AM VXAlgo NQ X1 Buy Signal :check:
— 12:24 PM Market Structure flipped bullish on VX Algo X3! :check:
— 1:30 PM Market Structure flipped bearish on VX Algo X3! :check:
What’s are some news or takeaway from today? and What major news or event impacted the market today?
After taking losses, I usually set a lock out on my account after $200 profit to build back small wins and confidence. so luckily I was locked out pretty early today and avoided most of the market whipsaw. But on days like these, if you don't walk away after you make money, you could eventually get triggered and tilted by the whipsaw. a lot of orb traders probably died today.
News
*HOWARD LUTNICK ON TARIFFS: EXPECT ANOTHER 15-20 LETTERS TO GO OUT OVER THE NEXT 2 DAYS- CNB
*Trump announces 50% tariff on copper imports, threatens 200% tariff on pharmaceuticals and maybe chips
What are the critical support levels to watch?
--> Above 6280= Bullish, Under 6260= Bearish
Video Recaps -->https://www.tradingview.com/u/WallSt007/#published-charts


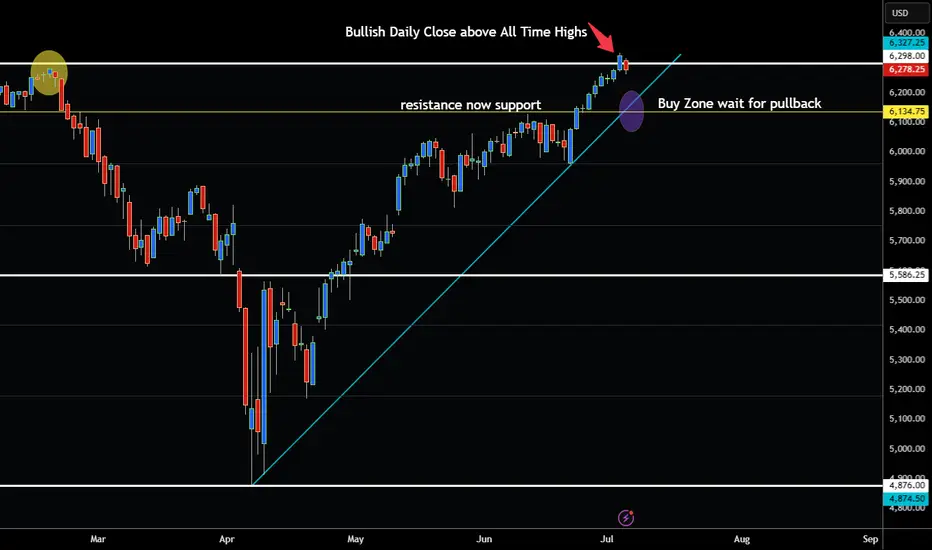
S&P 500 BULLISH BREAKOUT ABOVE ALL TIME HIGHS!Hey Traders taking a look at the S&P500 this week it is clear that we are in a strong bull market.
Notice that we broke above 6300 on the ES Futures Contract last week on July 3. This level is extremely important because it was the all time high from Feburary 2025. So now that the market has closed above this level buying opportunities can be considered at the trendline.
6135-6150 look like a good place to grab this bull again by the horns. 😁
So if your bullish wait for the pullback no need to chase the market imo. Eventually it will pullback lets see what happens July 9 WED with the Tarrifs.
Expect Volatility!
However if your bearish be very careful I don't think there is a good risk to reward ratio to shorting at this time.
Good Luck & Always use Risk Management!
(Just in we are wrong in our analysis most experts recommend never to risk more than 2% of your account equity on any given trade.)
Hope This Helps Your Trading 😃
Clifford
ES Short to 6274.50Grabbed 1 hour BSL on a shortened July 3rd trading day.
5 minute bearish market structure shift
1 hour bearish inverse fair value gap
Technicals ^
Participants ran the market higher into all time high's during the holiday week. Gathered shorts, and targetting 6274.50 as a meaningul 1 hour SSL level. Confluences with prior London open.
Logic ^


Shocking Market Move Revealed! Will Prices Soar or Crash?1. Market Context
Timeframe: The chart covers late June to early July 2025, with daily candlesticks showing recent price action.
Trend: The price has been in an uptrend, breaking resistance around 6,180.00 and testing 6,290.00-6,300.00. This suggests bullish momentum, but the move is nearing a key resistance zone.
2. Key Levels
Support: 6,180.00-6,200.00, where prior consolidation and moving averages align, offering a potential entry or stop-loss zone.
Resistance: 6,300.00 is a critical level. A break above could target 6,350.00, while failure might lead to a reversal.
Stop Loss: Place below support (e.g., 6,170.00) to protect against a breakdown, adjusting for your risk tolerance.
Take Profit: Aim for 6,350.00 if bullish, or scale out at 6,290.00 if you expect resistance to hold.
3. Technical Indicators
Candlestick Patterns: Recent green candles indicate buying pressure, but watch for reversal signals (e.g., doji or shooting star) near 6,300.00.
Volume: At 77.04K, it’s moderate. A surge on a breakout would confirm strength; a drop might signal exhaustion.
Moving Averages: The chart shows multiple MAs (e.g., 50-day, 200-day). If the price is above them, it supports the bullish case; a cross below could indicate a shift.
4. Trade Plan
Entry: Consider entering long near 6,290.00 if the price consolidates or breaks 6,300.00 with volume confirmation.
Risk-Reward Ratio: Aim for at least 1:2 (e.g., risk 20 points to gain 40 points toward 6,350.00).
Position Sizing: Calculate based on your account size and risk per trade (e.g., 1-2% of capital).
Exit Strategy: Take partial profits at 6,320.00 and let the rest ride with a trailing stop, or exit fully if resistance holds.
5. Risk Management
Volatility: The range (6,120.00-6,300.00) suggests moderate volatility. Adjust position size accordingly.
News/Event Risk: Check for upcoming economic data or earnings that could impact the instrument.
6. Scenario Analysis
Bullish Case: Break above 6,300.00 with strong volume could push to 6,350.00+. Monitor for follow-through.
Bearish Case: Rejection at 6,300.00 with a red candle might drop to 6,180.00. Prepare to cut losses quickly.


DIYWallSt Trade Journal: Why Price Action Beats News **07/02/25 Trade Journal, and ES_F Stock Market analysis **
EOD accountability report: +763
Sleep: 4.5 hours
Overall health: sleep deprived
** VX Algo System Signals from (9:30am to 2pm) 4/4 success**
— 9:57 AM Market Structure flipped bullish on VX Algo X3! :check:
— 10:30 AM Market Structure flipped bullish on VX Algo X3! :check:
— 11:10 AM VXAlgo ES X1 Sell Signal :x:
**What’s are some news or takeaway from today? and What major news or event impacted the market today? **
You can't trade on news, the only thing that matters in day trading is price action.
Bad news can still make the market go up.
News
The U.S. economy lost 33,000 jobs in June, as per ADP, badly missing forecasts for a gain of 99,000.
MICROSOFT TO LAY OFF AS MANY AS 9,000 EMPLOYEES
Tesla’s NASDAQ:TSLA Q2 deliveries miss consensus expectations
**What are the critical support levels to watch?**
--> Above 6250= Bullish, Under 6240= Bearish
Video Recaps -->https://www.tradingview.com/u/WallSt007/#published-charts

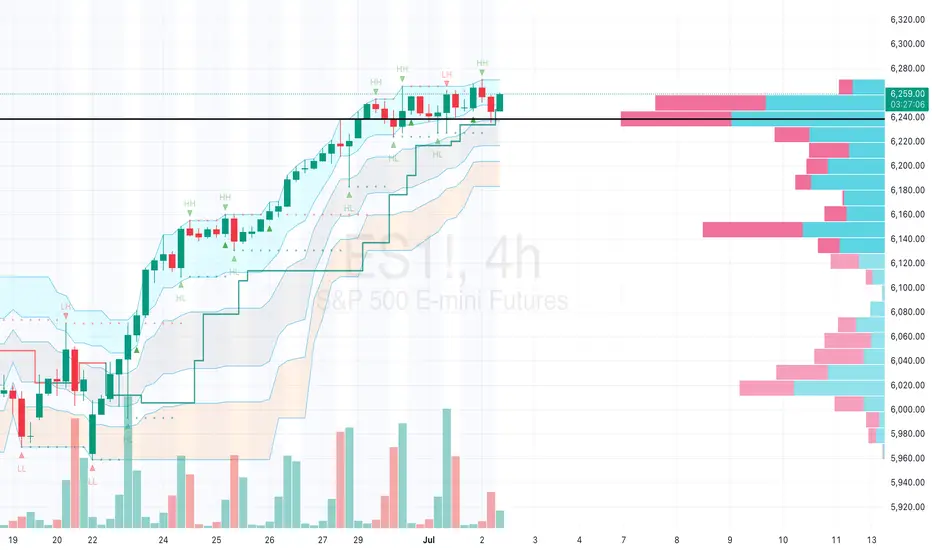
S&P 500 E-Mini Futures (ES) Market AnalysisKey Observations
The S&P 500 E-Mini Futures (ES) is currently trading at 6,240.00, with a high of 6,259.00 and a low of 6,244.75, based on the 4-hour chart provided.
The price is approaching a significant resistance level around 6,240–6,259, where recent selling pressure is evident from the volume profile.
The market has shown a strong upward trend, with higher highs (HH) and higher lows (HL) forming since the last major low near 6,020, but momentum appears to be slowing.
Technical Analysis
Price Action: The chart indicates a consolidation phase near the current level of 6,240.00, following a rally from the support zone around 6,020–6,040. The recent red candles suggest a potential reversal or pause in the uptrend.
Volume Profile: The right-hand volume profile shows high volume nodes (HVNs) between 6,180 and 6,240, with the point of control (POC) near 6,220–6,240. This indicates strong trader interest and a potential support/resistance zone. The pink bars (selling volume) dominate above 6,240, signaling rejection at higher levels.
Support and Resistance:
Support: 6,220–6,240 (POC), with a deeper support at 6,180–6,200 if the price breaks lower.
Resistance: 6,259 (recent high), with a psychological barrier at 6,300 if bullish momentum resumes.
Indicators: The chart includes Market Profile levels (e.g., HH, HL, LH, LL), suggesting a structured approach to identifying value areas. The flattening of the value area suggests a lack of directional conviction at present.
Market Context
The ES has been influenced by mixed economic data, including the June 2025 ADP employment report, which reported a loss of 33,000 jobs, signaling potential economic slowdown. This could pressure equity markets, including the S&P 500.
The upcoming Nonfarm Payrolls report on July 03, 2025, is a critical event. A weaker-than-expected result (forecasted at 110,000 jobs) could increase bearish pressure, while a strong report might push the ES toward new highs.
Recent market performance (e.g., NASDAQ 100 weakness due to Tesla news) may also be impacting the broader index, though the S&P 500 has shown relative resilience.
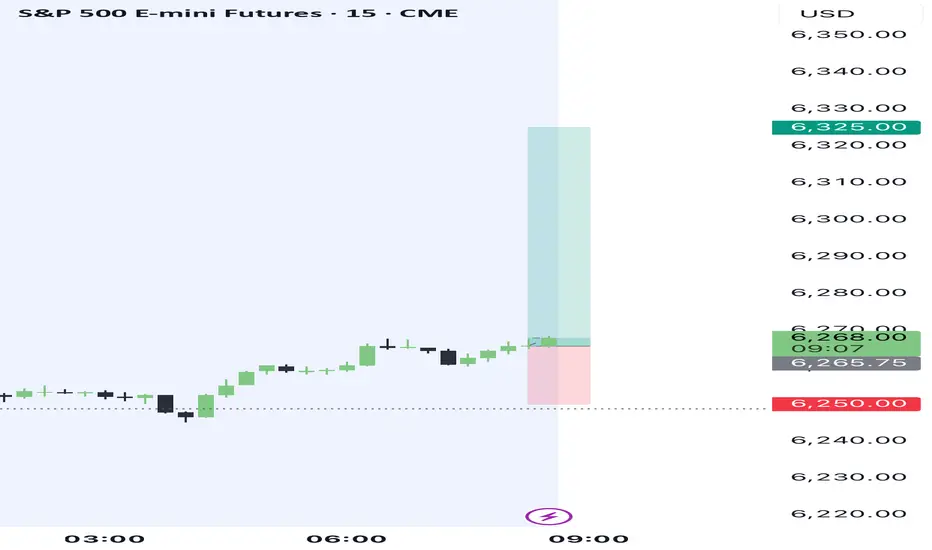
TiqGPT buy setup ESJul 2, 2025 8:43 AM
MARKET NARRATIVE:
1D Timeframe: The daily chart shows a strong bullish momentum with a series of green candles indicating a sustained upward move. This suggests institutional buying pressure and a lack of significant sell-side resistance.
4H Timeframe: The 4-hour chart confirms the bullish sentiment seen on the daily chart, with recent candles forming higher highs and higher lows. This is indicative of continued institutional interest in driving prices higher.
1H Timeframe: On the hourly chart, the bullish trend continues with price action showing smaller pullbacks followed by aggressive bullish candles. This pattern suggests that any dips are being used as buying opportunities by institutions.
15M Timeframe: The 15-minute chart shows more granularity in the price action, with recent bullish candles breaking past previous minor highs. This indicates that short-term liquidity is being taken on the buy-side, likely trapping late retail sellers.
5M Timeframe: The 5-minute chart shows a consolidation pattern forming at higher levels, suggesting a pause in the immediate bullish momentum. This could be a setup for another push higher as the market digests the gains.
1M Timeframe: The 1-minute chart shows choppy but generally upward-trending price action, indicating ongoing micro battles between buyers and sellers with buyers maintaining a slight edge.
INSTITUTIONAL THESIS:
Institutions appear to be in a phase of accumulation and upward price pressure across multiple timeframes. The consistent formation of higher highs and higher lows across these timeframes suggests a coordinated effort to drive prices higher, likely targeting overhead liquidity pools where institutional sell orders may be placed.
LEARNING POINT:
"Multi-timeframe confluence of bullish order flow and mitigation of lower timeframe liquidity pools."
SIGNAL: BUY
SYMBOL: S&P 500 E-mini Futures (ES1) ENTRY PRICE: $6,266.25 STOP LOSS: $6,250.00 (Below the recent minor low on the 15M chart) TARGET PRICE: $6,285.00 (Next potential liquidity pool on the 1D and 4H charts) CONDITION: Buy limit order at current market price with confirmation of continued bullish momentum on lower timeframes. RATIONALE: Strong bullish momentum across all timeframes, consistent institutional buying, and potential for reaching higher liquidity pools. STRATEGIES USED: Multi-timeframe bullish momentum, liquidity pool targeting. URGENCY: HIGH TIMEFRAME: Short-term to medium-term CONFIDENCE SCORE: 90% based on institutional confluence RISK/REWARD RATIO: Calculated as 1:3.8
Risk: $16.25 (Entry Price - Stop Loss = $6,266.25 - $6,250.00)
Reward: $18.75 (Target Price - Entry Price = $6,285.00 - $6,266.25)
Ratio: 1:3.8 (Reward ÷ Risk = $18.75 ÷ $16.25)

DIYWallSt Trade Journal: Why Traders Are Rotating from Nasdaq to**07/01/25 Trade Journal, and ES_F Stock Market analysis **
EOD accountability report: +1160
Sleep: 5 hours
Overall health: Need to catch up on sleep again
** VX Algo System Signals from (9:30am to 2pm) 4/4 success**
9:39 AM Market Structure flipped bullish on VX Algo X3! :check:
11:00 AM Market Structure flipped bearish on VX Algo X3 :check:
11:24 AM VXAlgo ES X1 Buy signal :check:
12:00 PM Market Structure flipped bullish on VX Algo X3! :check:
**What’s are some news or takeaway from today? and What major news or event impacted the market today? **
RTY and YM leading the way today
NQ lagging
Why is this?
The answer is, Simple Supply and Demand theory.
Money has to come from somewhere.
If Money is going to YM and RTY,
Money has to leave from NQ or ES or both.
There is not an infinite amount of money, So if one index is outperforming like crazy over the other. It must be draining from it
Why would it drain from NQ? Easy
Because NQ and ES already hit ATH,
YM and RTY has not hit ATH yet.
So people are selling NQ and buying YM because it is on Discount
News
N/A
**What are the critical support levels to watch?**
--> Above 6235= Bullish, Under 6210= Bearish
Video Recaps -->https://www.tradingview.com/u/WallSt007/#published-charts


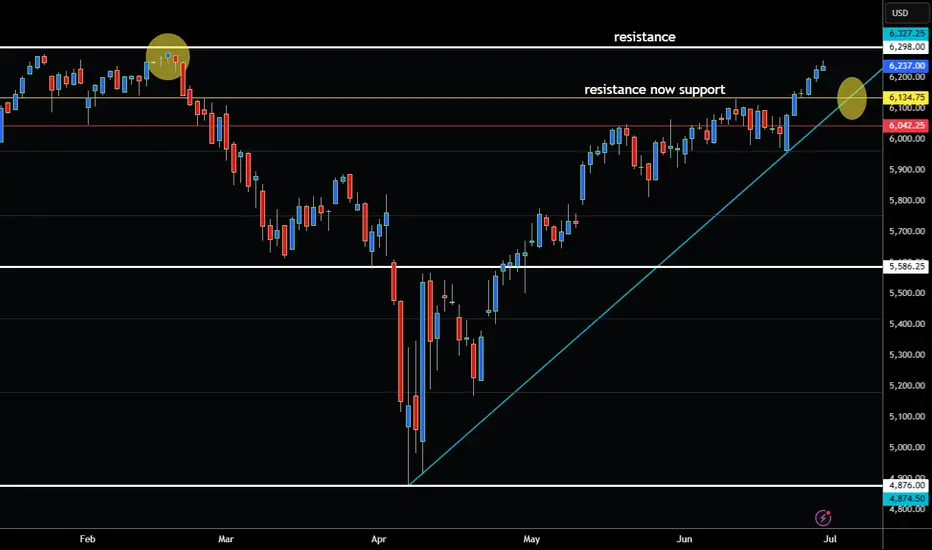
S&P 500 ABOUT TO TEST CRITCAL RESISTANCE LEVEL!Hey Traders so today watching S&P500 and looks like strong resistance at 6300.
Market can do 1 of 3 things like before.
Pause, Reverse, or Breakthrough so if your long watch for reversals. If not watch for pullback to new support level around 6135. Can be a nice area to enter new long positions in the buy zone.
Place stops under trendline around 6040.
Remember trend is your friend so if bullish wait for pullback. However if bearish wait for break below trendline to confirm market wants to break lower.
Also watch Nasdaq 100 because it normally leads the market higher. If S&P rises but Nasdaq is holding back it's not a good sign for breakout.
Always use Risk Management!
(Just in we are wrong in our analysis most experts recommend never to risk more than 2% of your account equity on any given trade.)
Good Luck & Hope This Helps Your Trading 😃
Clifford
SP500 - Cycle Analysis; New V-Bottom24 Dec 2018 - V-Bottom Trough:
This marks a clean V-bottom. Both the 227-ROC and 114-ROC showed simultaneous positive acceleration after price reacing its low. Shortly after, both crossed their 57-SMA almost in sync — increasing the probability of a sustained bullish move. Price confirmed this by breaking resistance and forming a V pattern. This was further validated by the centered moving average crossover (114-CMA crossing above 227-CMA).
25 Mar 2020 - Deep COVID Crash Trough:
During this phase the priced broke below the support, creating a deep trough. Altough both ROC lines initially showed strong negative acceleration due to the COVID-19 crash, they soon reversed above their 57-SMAs, signaling a major shift in momentum. This coincided with the price breaking above the key resistance which was also crossed in 2019 when confirming the old V-pattern. After this breakout, a brief pullback followed before the uptrend resumed with increasing strength.
22 Jun 2021 to 19 Dec 2023 - Pattern
During the initial period a bearish divergence was visible in the ROC, nevertheless price and rate of change both declined making a low in early October 2022. A technical pattern began to form, which appears to align more closely with a symmetrical triangle; So when measuring its height and projecting it from the breakout point aligns with the new all-time highs that were reached on 27 June 2025.
21 Mar 2025 - New Cycle Trough
A new V-bottom formed shortly after the current cycle began. Both ROC indicators had already crossed their SMAs to the upside, showing early signs of positive acceleration, days before of price broke through the resistance and reached the new record high.
The 227-SMA is likely to cross from below the fast SMA while a possibility of a pullback increase.
Following that, the 114-CMA will probably has the chance to cross back the 227-CMA, with the price potentially confirming a new support level and resuming its uptrend - in line with the broader cycle timeline.
