Bitcoin to $90k - February 2026Remember those dizzy heights seven days ago?
** The weeks ahead, void after May 2026 **
You read correctly, Without-worries has a bullish idea. For most of quarter 4, 2025 it has been a stream of bearish ideas, mostly all falling on deaf ears. Today is a bullish idea. A bullish idea with a time l
Key facts today
Key stats
About Bitcoin
Bitcoin is the world’s most traded cryptocurrency, and represents the largest piece of the crypto market pie. It was the first digital coin and as such, remains the most famous and widely-adopted cryptocurrency in the world. It's the original gangster in whose footsteps all other coins follow. The birth of Bitcoin was the genesis of an entirely new asset class, and a huge step away from traditional, centrally controlled money. Today, many advocates believe Bitcoin will facilitate the next stage for the global financial system, although this — of course — remains to be seen.
Related coins

BITCOIN: One Last Drop And Then On The Way $200,000Dear Traders,
In our previous analysis, we predicted a price drop from 100k to 60k through multiple analyses. This prediction has come true as the price is currently plummeting sharply. We believe the price will likely fall between 63k and 58k, which would be ideal for swing buyers and a potential

BITCOIN and the powerful Stoch RSI Cycle SignalThe Stoch RSI is a very rarely used indicator, in fact the last time we made use of it on Bitcoin (BTCUSD) was around the bottom of the 2022 Bear Cycle. We bring it forward to you once more as December closed with the 1M Stoch RSI below the 20.00 level. Historically, every time the market did that,

Elise | BTCUSD – 30M – Bearish ContinuationBITSTAMP:BTCUSD
After the sharp sell-off, BTC attempted a corrective consolidation but failed to regain bullish momentum. The price respected the supply zone and showed rejection, indicating this move is a distribution phase rather than a reversal. As long as price remains capped below supply, dow

BTC: Short-Term Invalidation, High TF Structure IntactHi guys, here is my market overview of what happened on Saturday and how I’m thinking about the market from here.
Short-term update:
The bullish scenario on lower timeframes is invalidated. Structure failed, local support broke, and downside followed. Any upside from here should be treated as cou

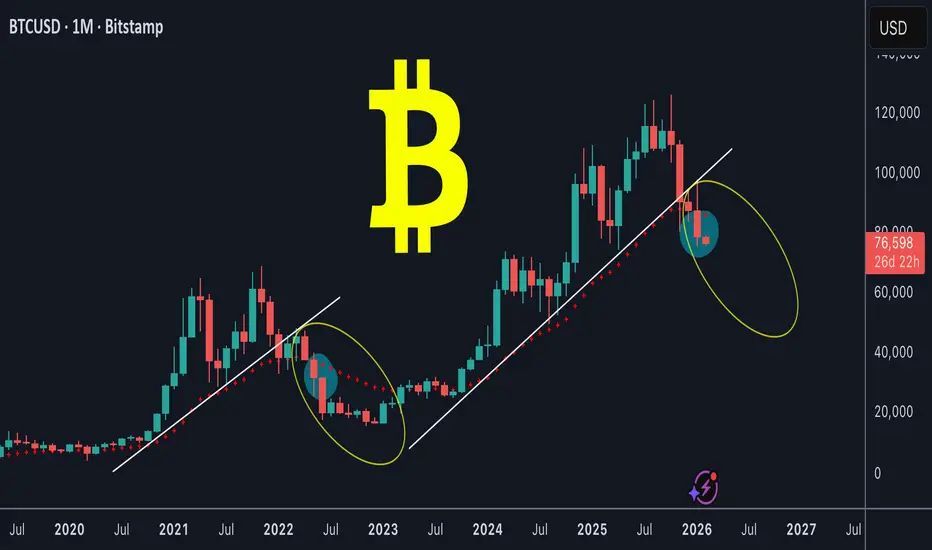
BTC monthly chart is bearishBTC / USD
I've been bearish on Bitcoin for the past 4 months (previous posts are attached below), and today we're seeing the price of Bitcoin continue to decline.
What is the current situation for Bitcoin (monthly chart)?
In short, Bitcoin has broken its upward trendline (white), as well as a
BTCUSD Heavy Dump → Buyers Step In at SupportBitcoin (BTCUSD) has experienced a strong bearish impulse, breaking multiple intraday supports and printing lower lows. After this aggressive sell-off, price is now showing signs of short-term stabilization near a key demand zone, where buyers are attempting to step in.
The current structure sugges

Why the Same Strategy Performs Differently in Crypto and ForexMany traders experience the same frustration. A strategy shows consistency in one market and breaks down in another. The instinctive reaction is to question the rules, indicators, or entries. In most cases, the strategy is not the problem. The environment is.
Crypto and Forex operate under very dif

BTCUSD: Is Every Pullback a Trap?BTCUSD is currently trading within a clearly defined bearish trend , as both news flow and technical structure favor the sellers . Short-term capital has become more cautious, buying momentum has weakened after the prior strong rally, and there is no sufficiently strong catalyst to trigger a genu

BTCUSD – 30M – Bearish Continuation From SupplyBITSTAMP:BTCUSD
After aggressive selling pressure, BTC attempted a corrective pullback but failed to reclaim the marked supply zone. This rejection indicates weak buying interest and suggests that the recent consolidation is a distribution phase before further downside. As long as price remains be

See all ideas
Summarizing what the indicators are suggesting.
Oscillators
Neutral
SellBuy
Strong sellStrong buy
Strong sellSellNeutralBuyStrong buy
Oscillators
Neutral
SellBuy
Strong sellStrong buy
Strong sellSellNeutralBuyStrong buy
Summary
Neutral
SellBuy
Strong sellStrong buy
Strong sellSellNeutralBuyStrong buy
Summary
Neutral
SellBuy
Strong sellStrong buy
Strong sellSellNeutralBuyStrong buy
Summary
Neutral
SellBuy
Strong sellStrong buy
Strong sellSellNeutralBuyStrong buy
Moving Averages
Neutral
SellBuy
Strong sellStrong buy
Strong sellSellNeutralBuyStrong buy
Moving Averages
Neutral
SellBuy
Strong sellStrong buy
Strong sellSellNeutralBuyStrong buy
Displays a symbol's price movements over previous years to identify recurring trends.
Discover funds exposed to Bitcoin and find another way to access the coin.
Frequently Asked Questions
The current price of Bitcoin (BTC) is 71,044 USD — it has risen 2.10% in the past 24 hours. Try placing this info into the context by checking out what coins are also gaining and losing at the moment and seeing BTC price chart.
The current market capitalization of Bitcoin (BTC) is 1.42 T USD. To see this number in a context check out our list of crypto coins ranked by their market caps or see crypto market cap charts.
Bitcoin (BTC) trading volume in 24 hours is 47.06 B USD. See how often other coins are traded in this list.
Bitcoin price has fallen by −10.05% over the last week, its month performance shows a −22.29% decrease, and as for the last year, Bitcoin has decreased by −26.41%. See more dynamics on BTC price chart.
Keep track of coins' changes with our Crypto Coins Heatmap.
Keep track of coins' changes with our Crypto Coins Heatmap.
Bitcoin (BTC) reached its highest price on Oct 6, 2025 — it amounted to 126,272 USD. Find more insights on the BTC price chart.
See the list of crypto gainers and choose what best fits your strategy.
See the list of crypto gainers and choose what best fits your strategy.
Bitcoin (BTC) reached the lowest price of 2 USD on Oct 20, 2011. View more Bitcoin dynamics on the price chart.
See the list of crypto losers to find unexpected opportunities.
See the list of crypto losers to find unexpected opportunities.
The current circulating supply of Bitcoin (BTC) is 19.99 M USD. To get a wider picture you can check out our list of coins with the highest circulating supply, as well as the ones with the lowest number of tokens in circulation.
Bitcoin has the limit of 21.00 M coins. No matter how the currency evolves, no new coins will be released after this number is reached.
The safest choice when buying BTC is to go to a well-known crypto exchange. Some of the popular names are Binance, Coinbase, Kraken. But you'll have to find a reliable broker and create an account first. You can trade BTC right from TradingView charts — just choose a broker and connect to your account.
Crypto markets are famous for their volatility, so one should study all the available stats before adding crypto assets to their portfolio. Very often it's technical analysis that comes in handy. We prepared technical ratings for Bitcoin (BTC): today its technical analysis shows the sell signal, and according to the 1 week rating BTC shows the sell signal. And you'd better dig deeper and study 1 month rating too — it's sell. Find inspiration in Bitcoin trading ideas and keep track of what's moving crypto markets with our crypto news feed.
Bitcoin (BTC) is just as reliable as any other crypto asset — this corner of the world market is highly volatile. Today, for instance, Bitcoin is estimated as 3.84% volatile. The only thing it means is that you must prepare and examine all available information before making a decision. And if you're not sure about Bitcoin, you can find more inspiration in our curated watchlists.
You can discuss Bitcoin (BTC) with other users in our public chats, Minds or in the comments to Ideas.