Expired SPY Weekly outlook. 3rd WK FEB 2024Expired SPY Weekly outlook. 3rd WK FEB 2024
> BULLISH 📈 CORRECT
Closed Price: 499.51
Target Price: 501 | Strike Price: 508.49 FEB22 24'
Upper Range: 504
Lower Range: 499
SPY trade ideas

SPY double bottom with breakout?Spy looks to have formed a double bottom on the 8hr with breakout. I'm looking for it to hit $510 next. What are your thoughts?

SPY developing triangleDeveloping triangle on SPY. The context doesn't provide much clue which direction it will resolve. We have clear trend reversal signs on daily chart (Lower high is set) but weekly consolidation has not yet started so there is still opporunity for bulls to set daily higher low. Adding to bearish side is slightly unfilled gap from Tuesday. But this is very minor sign.
I'm not inclined to develop any directional bias at this stage. You can still trade triangle but with caution.

$SPY February 22, 2024AMEX:SPY February 22, 2024
15 Minutes
AMEX:SPY managed to hold on to a 21-day average at 493 levels as expected and bounced back swiftly to 497 levels at the close.
Taking the fall 502.86 to 493.56 AMEX:SPY will have resistance around 499-500 levels being a 61.8% retracement for the fall.
For the rise of 493.56 to 497.37 AMEX:SPY needs to hold 495 levels for an uptrend around 499-500 levels.
At the moment long is only above 503 levels as we have multiple tops in 15-minute time frames.
For the rise of 490.72 to 502.86 AMEX:SPY retraced to 493.56 levels being 78.6% retracement.
So I expect one more top around 501-502 levels.

Our Strategy For "The Leap"Hey guys! Today, we explore 'The Leap', and our strategy for the competition.
It's easy to register if you haven't done so already.
In this video, we cover;
1.) DIRECTIONAL BIAS
2.) WHERE TO TRADE
3.) WHERE TO RISK
4.) POSITION MANAGEMENT
for the strategy we'll be using. It's a simple breakout strategy we're going to bring to a lower timeframe, so we can get enough trades in before the competition expires.
Good luck to all, we look forward to competing with you!
Want more high-quality trade ideas? Follow us below. ⬇️⬇️

SPY bearish pitchfork analysisI drew these pitchfork lines before Oct. 15, 2023 when I posted my last SPY idea, titled "SPY: strong bullish pitchfork analysis" (see related idea below). At that time SPY was 427.48. Now it's 470.80. SPY reached the top pitchfork line that I drew back in Oct. 15 last year and is at this time expected to fall further.

$SPY Trend line officially broken this morning. "get out"Seems like blowoff top is guaranteed with NVDA doing the honors. Trend line break and hold would be extremely bearish. Maybe Fed/NVDA can save, but if they don't come thru by end of week up trend broken in my book. Looking for SPY to reject/correct 10% from these levels, looking for SPY 450s March/April...

SPY update - Feb 21SPY confirmed first support levels noted here:
For now, 494-496 zone is valid support as well as UTL (upward trendline).
Also, I added a bull flag here (red lines).
My scenarios are:
Scenario 1. SPY holds yesterday lows + UTL.
Jumping back on 8EMA, showing strength, ready to do new highs.
Scenario 2. SPY going lower onto the next support - 21EMA, then 490-488 as pivots + Channel (flag) bottom.
SPY H&S potential incomingPotential Head and Shoulders forming here on the SPY.... Keeping in mind that NVDA reports earnings and there is an expected +/- 11% move in that asset after earnings that will directly affect the SPY

$SPY $SPX Tomorrow’s Trading Range for 2.21, Fed minutes, $NVDAAMEX:SPY SP:SPX Tomorrow’s Trading Range for 2.21, Fed minutes, NASDAQ:NVDA earnings
Tomorrow’s trading range is wider than normal because we have FED minutes at 2pm and NVDA earnings in after hours.
Today the CPI gap from last week, paired with the 30-minute 200MA caught us on the drop…. so looking to see how that level reacts in the morning.

SPY- Open Put Options to Hedge Long Stocks SHORTSPY on the 15-minute chart seems to have hit a pivot high. With a variety of long positions,
I need some insurance against a bull trap or even a black swan event in geopolitics. It seems
SPY puts would fulfill the purpose. Out of the money below the current price seems
opportunistic. Accordingly, I will take a handful of put options that expire at the mid- March
monthly 1% below current price. If the market is healthy these will drop in value especially
with time decay. They will serve as insurance. On the other hand if the market gets a cold
or worse a bad case of COVID, these will partially offset any losses while managing positions.

SPY Update: Following my path thus farThere really isn't much new to add yet for a big analysis. We moved down in a 5-wave move described in my last post and proceeded to move higher again as predicted. We did NOT make a new high, although we raised slightly more than expected and then dropped once again. I expect price to make another low and drop to the low $490's before a small retrace higher again. After that the strength and speed should pick up significantly to the downside as that will be wave iii of 3 of a of B. Until we get some more price action, I can't say for certain, but MACD seems to be backing this count at this time. This will most likely be the last time I post SPY on here unless something crazy happens this week.
Don't forget, beginning February 23rd (this Friday), I will be dramatically changing my posting schedule here on trading view. My last regular post / update will be on that day.

$SPY February 21, 2024AMEX:SPY February 21, 2024
15 Minutes.
AMEX:SPY managed to hold 495 levels.. Made alow at 494.48. And that bat had a good close near the top of the bar.
As we can see in the chart the fall from 502.86 to 494.8 was steep. Hence some sideways going on to catch up averages.
If I consider the fall from 502.89 to 494.48, I expect a resistance of around 49.5 levels, and if 494.2-494 is broken I have a target of 489-490 initially.
I will decide on my setup based on open today. I expect a trending one-sided move today
I will be buying around or reversing depending on my trade around 489-490 levels which is 200 average in 60 minutes.
From mid-November, AMEX:SPY has managed to hold a 21-day average successfully in the daily time frame which is around 493 now, and hence the number 490.72 is important to maintain the HL in the daily time frame.

Possible 2024-2026 outcome for the SNPJust thinking about what the fed will do in the upcoming 2 meetings, inflation is still sticky, I feel we get 2 meetings where there are no rate cuts and if the market looks shaky and inflation comes down I think that the June 10th meeting gives us the first cut.
Usually following cuts we see recession, I am thinking and hoping it will be light and we can get inflation fully crushed and back on track after 2 quarters of recession. Then its a booming economy with low rates on the horizon.
Still I expect kangaroo for 2024 and a retest of under 400 to confirm the soft landing.
Just my opinions

Upside ContinuationSPY is bullish as long as it stays above or in the blue channel
- initial target 480 by as early as 1/5 (1/19 latest)
- Goal target 500 by 2/21/2024
We haven't seen this kind of move since November 2021, the shallow retracements are actually a bullish sign, not an indication of over-extended.
Once this makes it to 500+ it will begin a distribution phase before ultimately tanking in April-May of 2024. But for now it's bullish after competing a re-accumulation phase over the past couple weeks.

MrStocky - Active Hedging S&P500 Equity IndexHere we go again. We are bearish the equity market. Is it going to be the nightmarish groundhog day again?

Spy Top of the channel here overbought... looking for a pullback to minor support in the 1-2 weeks.. minor support would be this white trendline like so.
This would mean a pullback to 480 before pushing to 500. In this scenario, a rising wedge would play out and the big sell happens early or mid march.
The more aggressive scenario would be spy dropping to test its 50sma in the next 2weeks to form a Head, followed by another week or so to form the right shoulder like so.
Either way im looking for this target in the next 1½ week. 480
Heres the Nasdaq composite or IXIC.
Ive outlined the last ascending triangle that gave big tech the boost to shoot up.. Now another ascending triangle has formed but under different circumstances.
The circumstance is the Bearish divergence. When you have Bearish divergence while showing ascending triangle that can sometimes cause pattern failure especially if theres no volume to break out..
As you can see , price is now in a rock and a hard place , so i expect a move either way very soon.
Lastly
ES
Daily chart
Rising wedge in white + plus a smaller trendline holding up (Fawkery)..
The measured move of this drop should be 4% or atleast to 4750.. this would mean spy will test 50sma soon.
Got your messages
I'll update when i can

SPY falls into mean VWAP support for LONGSPY on the 1H chart was riding the cynamic resistance of the second upper VWAP line
in mid July but then pivoted down out of a head and shoulders at the bottom of the month
and is now bounding up and down retesting the support of the mean VWAP line.
The ADX indicator shows the flat line directional index. The ZL MACD is upgoing after a
cross of the lines at the lows. Price is impending another VWAP crossover on the
retest. I see this as an excellent base from which to take call options long targeting
$453 for both 8/18 and 9/1. Please leave a comment, will SPY turn it around here or
seek the downside?

SPY A Fall Expected! SELL!
My dear subscribers,
This is my opinion on the SPY next move:
The instrument tests an important psychological level 501.18
Bias - Bearish
Technical Indicators: Supper Trend gives a precise Bearish signal, while Pivot Point HL predicts price changes and potential reversals in the market.
Target - 496.45
About Used Indicators:
On the subsequent day, trading above the pivot point is thought to indicate ongoing bullish sentiment, while trading below the pivot point indicates bearish sentiment.
———————————
WISH YOU ALL LUCK


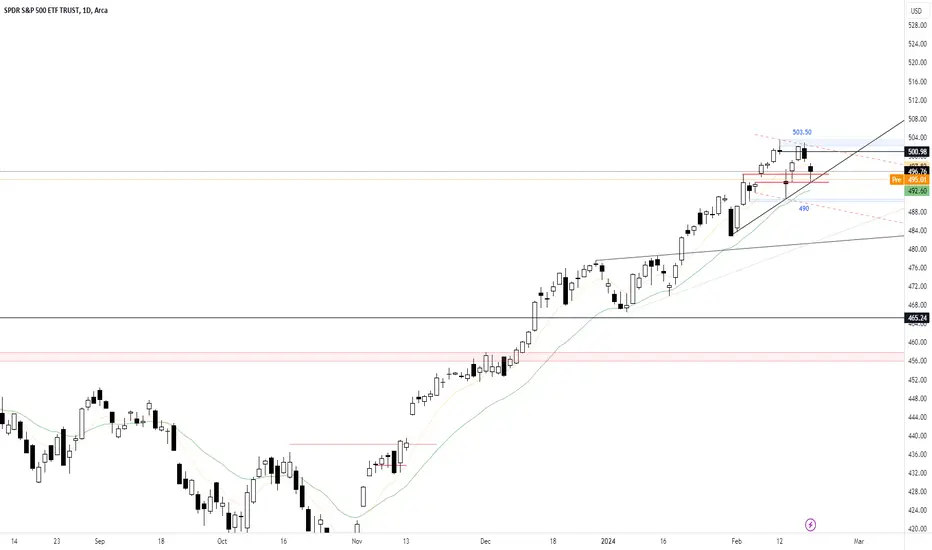
SPY plan for the upcoming weekSo, facts:
1) 500-503.50 zone is the obvious resistance for now
2) 21EMA is a solid support at this point
3) 490 is quite a good support
4) 8EMA - not sure if it will clearly hold the price next week.
5) 494-496 - potential support zone for building another Higher Low
What I expect:
1) One of the scenarios for me is the price confirming one of the support levels - 8EMA or 494-496 zone, then try to break the highs (503.50).
2) An alternative scenario is losing 8EMA and moving lower to 21EMA and 490 level.
Now, my primary job is to watch and wait for the price reaction to the levels.

$SPY February 19, 2024AMEX:SPY February 19, 2024
15 Minutes.
498.5 was protected and 503 was not crossed.
For the day I will consider 2 rises.
490.72 to 502.86 and
494.4 ad 502.86
498 +- 0.5 becomes crucial today.
No trade day today.
I will watch for a setup to emerge.
Holding the longs still and will close if 495 is broken on the downside.
If AMEX:SPY is between 497 and 503 today then I will be convinced that 504 could be taken out this week.
Once 495 is broken I will look for short for a target 490-491 levels being around 200 averages in 60 minute chart. This is also 21-day support daily.
490.72 could be an HL if held., and hence becomes crucial to hold.

SPY: Will Start Falling! Here is Why:
The price of SPY will most likely collapse soon enough, due to the supply beginning to exceed demand which we can see by looking at the chart of the pair.
❤️ Please, support our work with like & comment! ❤️
