AMP Futures - Order types, and how to place a stop on the DOM.In this idea we will cover the different order types you can use in Tradingview, also explaining the placement of the different order types, and how to place a stop order on the DOM.
ESZ2028 trade ideas

S&P500: Within reachThe S&P 500 has edged past the 88.70% retracement and is now trading within our magenta Target Zone (Coordinates: 5,880 points to 6,166 points). This places magenta wave (B) likely near its peak - a move that could soon give way to a sharper decline as part of the anticipated wave (C). At current levels, the setup remains favorable for initiating short positions. To manage risks, a stop just 1% above the upper boundary of the Target Zone is recommended. If the index breaks above resistance at 6,6675 points, however, we would shift to an alternative interpretation: a bullish continuation in the form of the wave alt.(III) in blaue. We currently assign a 40% probability to this scenario. One final note: the minimum technical requirement for wave (B) has already been fulfilled by the entry into the Target Zone. This means wave (C) could begin any time.
Over 190 precises analyses, clear entry points and defined Target Zones - that's what we do.

How to Draw Support & Resistance In TradingViewLearn how to effectively identify, draw, and utilize support and resistance levels in TradingView with this comprehensive step-by-step tutorial. Whether you're a beginner trader or looking to refine your technical analysis skills, this video covers everything you need to know about one of the most fundamental concepts in trading.
What You'll Learn:
Understanding support and resistance: the foundation of technical analysis and price action trading
Step-by-step instructions for drawing horizontal support and resistance lines in TradingView
Creating support and resistance zones for more flexible trading approaches
Practical tips for using TradingView's drawing tools effectively
This tutorial may be helpful for day traders, swing traders, and investors using TradingView who want to improve their chart analysis skills. The techniques covered could help you make more informed entry and exit decisions by understanding where price might find support or encounter resistance.
Visit Optimus Futures to learn more about trading futures with TradingView: optimusfutures.com
Disclaimer:
There is a substantial risk of loss in futures trading. Past performance is not indicative of future results. Please trade only with risk capital. We are not responsible for any third-party links, comments, or content shared on TradingView. Any opinions, links, or messages posted by users on TradingView do not represent our views or recommendations. Please exercise your own judgment and due diligence when engaging with any external content or user commentary.
This video represents the opinion of Optimus Futures and is intended for educational purposes only. Chart interpretations are presented solely to illustrate objective technical concepts and should not be viewed as predictive of future market behavior. In our opinion, charts are analytical tools—not forecasting instruments. Market conditions are constantly evolving, and all trading decisions should be made independently, with careful consideration of individual risk tolerance and financial objectives.

ID: 2025 - 0136.12.2025
Trade #13 of 2025 executed.
Trade entry at 162 DTE (days to expiration).
Excellent fills this morning, well under mid. Created a GTC working order two days ago and let price come to me. No chasing. There are TONS of external liquidity voids resting below.
Target profit is 5% ROI
Happy Trading!
-kevin


MES Long - HVN, Gap, FVG, Long trade for MES based on High Volume Node with refined Entry in lower timeframe.
HVN on higher timeframe (daily)
HVN on lower timeframe (m30)
Gap followed by huge FVG
Expected reaction for price to bounce to the upside.
TP2 rather a swing trade exit.
TP1 more of a intraday trade exit.

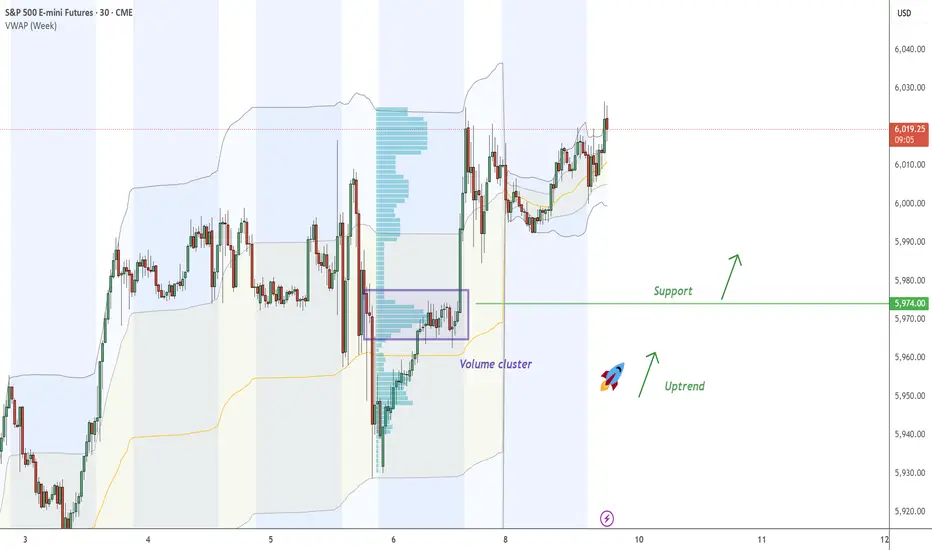
ES - continue with the UptrendOn ES , it's nice to see a strong buying reaction at the price of 5974.00 .
There's a significant accumulation of contracts in this area, indicating strong buyer interest. I believe that buyers who entered at this level will defend their long positions. If the price returns to this area, strong buyers will likely push the market up again.
Uptrend and high volume cluster are the main reasons for my decision to go long on this trade.
Happy trading
Dale

ES1!/SP500 Targeting Weekly Range Resistance***QUOTING SEP CONTRACT FOR JUNE CONTRACT OR CASH US500 EQUIVALENT LEVELS SUBTRACT ~52 POINTS***
***WEEKLY ACTION AREA VIDEO TO FOLLOW AHEAD OF NY OPEN***
WEEKLY BULL BEAR ZONE 6090/6100
WEEKLY RANGE RES 6150 SUP 5914
DAILY RANGE RES 6090 SUP 5972
DAILY VWAP BULLISH 6019
WEEKLY VWAP BULLISH 5923
DAILY BALANCE - 6064/5965
WEEKLY ONE TIME FRAMING UP - 5965
MONTHLY ONE TIME FRAMING UP
GAP LEVELS 5843/5741/5710/5339
Balance: This refers to a market condition where prices move within a defined range, reflecting uncertainty as participants await further market-generated information. Our approach to balance includes favoring fade trades at the range extremes (highs/lows) while preparing for potential breakout scenarios if the balance shifts.
One-Time Framing Up (OTFU): This represents a market trend where each successive bar forms a higher low, signaling a strong and consistent upward movement.
One-Time Framing Down (OTFD): This describes a market trend where each successive bar forms a lower high, indicating a pronounced and steady downward movement.
GOLDMAN SACHS TRADING DESK VIEWS
Weekend Cross-Asset Dislocations (15-Jun-2025)
Oil Options Positioning Reaches Extreme Levels
On Friday, call buying in oil pushed the put-call skew to one of its most extreme levels in over 25 years. This indicates that investors are positioning for significant upside asymmetry. Notably, the shift in the put-call skew far exceeded the movement in near-term oil futures, compared to similar past episodes.
AI-Related Capex Remains Steady
Our analysts report that capex spending for 2025 and 2026 by the six largest hyperscalers has remained stable over the past few months. Bearish investors might interpret the absence of upward revisions as a sign of slowing momentum in the broader AI sector. Conversely, bullish investors could view the rebound in stock prices as a signal of growing confidence in hyperscalers and other AI-exposed companies to generate revenue sufficient to support planned capex.
Sector-Specific Divergences in Put-Call Skew
Friday saw notable divergences in put-call skew across sectors, highlighting the varied impact of global events. Increased call-buying pressure in energy aligns with the extreme shift in oil’s put-call skew. Meanwhile, rising put-call skew in Materials and Financials reflects heightened downside concerns, with Materials put-buying signaling fears of a broader economic slowdown.
Balanced Positioning in Single Stock Put-Call Skew
Despite sector-specific disparities, single-stock positioning remains balanced. The average stock’s put-call skew has returned to levels seen in March 2025, before the US tariff announcements.
IG Credit Spreads Tight Relative to Equities
Investment-grade (IG) equity investors appear more cautious than their credit counterparts, likely due to elevated uncertainty around US interest rates. A potential rate increase could disproportionately impact IG equity valuations.
Retail Investor Activity Remains Stable
Retail investor volumes have aligned with their five-year average, suggesting they remain engaged but have not been a dominant driver of equity performance in recent weeks. For single stocks, retail investors have been in a holding pattern, having shifted from net buyers earlier this year to small net sellers recently. This suggests they may be waiting for a broader market dip to resume buying.
SPX Daily Options Pricing Reflects Steady Volatility
SPX options are pricing daily moves between 0.9% and 1.2% over the next four weeks. Notably, options for this week’s FOMC meeting are pricing a relatively low ±0.9% move. While a ±1.2% move is priced for July 7, uncertainty remains regarding the volatility impact of the tax bill and the end of the 90-day tariff pause.
Professional Investors Maintain Cautious Stance
Entering 2025, professional investors significantly reduced their demand for leveraged equity exposure through futures, swaps, and options, signaling potential downside risks. While this trend has continued, the pace of selling has slowed in recent weeks, making the cautionary signal less alarming.
Wednesday marks the VIX expiry, which we believe has been supporting the market. Thursday is a market holiday, and Friday brings option expiry, likely leading to a high out-of-office session as risk-taking eases. The market may challenge crowded trades, with "short oil" being noted as particularly crowded.
1. Positioning (i): Hedge funds have been buying U.S. equities for six consecutive weeks, with net leverage exceeding 50% after reaching a five-year low in April. Despite a generally bearish outlook, investors are positioned bullishly due to limited alternatives.
2. Positioning (ii): Sector flows show increased risk aversion, with strong demand in utilities and significant supply in consumer discretionary sectors.
3. Positioning (iii): The systematic community remains long on stocks and is unlikely to sell significantly unless conditions worsen. The key level to watch in the SPX is 5800, both medium-term and short-term.
4. Flows (i): The long-only community has finally turned to buying stocks after three weeks of selling imbalances, ending $10 billion better to buy across all sectors.
5. Flows (ii): As the June expiry approaches, SPX call open interest is at an all-time high with 8.7 million contracts.
6. Trades (i): In derivatives, there have been buyers of VIX puts extending to July, with a significant premium built into the VIX curve. SPX realized volatility is at 12, while July VIX is nearly double that. Outright puts are intriguing, and some VIX puts were traded contingent on SPX falling below a certain level.
7. Trades (ii): Our cash desk believes the AI theme is gaining momentum. Callahan notes the increased visibility around GenAI as the biggest takeaway from the week. The Ellison earnings transcript highlights "astronomical" demand.
8. Trades (iii): The Goldman Sachs house view and consensus suggest that gold will continue its rapid rise. A July 97% put costs 100 basis points, representing the maximum loss premium paid.

S&P 500, the technical battleground for JuneIn our April 15 analysis, we questioned the likelihood of a low point for the S&P 500 index based on technical analysis considerations. The VIX (the implied volatility of the S&P 500) also showed bearish technical characteristics (inverted correlation with the S&P 500), and indeed, the equity market offered a solid rebound against a backdrop of trade diplomacy.
With elements of technical overheating appearing in the short term, let's review the technical analysis signals to establish a diagnosis of the current situation in the US equity market.
To start with, you can reread our April analyses of the S&P 500 and VIX by clicking on the two images below.
1) Short-term technical overheating, but fundamental uptrend preserved above technical support at 5750/5800 points
The S&P 500 index has developed a bullish V-bottom rally since the beginning of April, and the global equity market even made a new all-time high last week.
The upward movement of the S&P 500 sees an alternation between bullish impulses and short-term consolidations/corrections, and this chart pattern is likely to repeat itself as long as trade diplomacy takes its course and as the market awaits the FED's next monetary policy decision next week. The daily chart suggests short-term technical overheating (small bearish price/momentum divergence, with momentum represented here by the RSI technical indicator). In any case, even if the market needs a breather in the short term, the underlying trend remains bullish above major support at 5700/5800 points, i.e. the bullish gap opened in mid-May and the 200-day moving average.
The chart below shows daily Japanese candlesticks for the S&P 500 future contract
2) In terms of retail investor sentiment, the reservoir of sellers has diminished, but remains well filled
The study of retail investor sentiment is part of contrarian analysis of financial markets, one of the disciplines of technical analysis of financial markets. Although the pool of sellers has shrunk, a significant proportion of retail investors are still doubtful about the recovery. This pessimistic sentiment among retail traders is an indicator that the recovery still has medium-term potential, as market peaks have always taken place amid retail investor euphoria.
3) On the quantitative side, watch out for a technical overbought situation in the short term
On the other hand, caution is called for in the short term, as the percentage of S&P 500 shares above the 50-day moving average (this tool here represents the quantitative side of the market) is approaching its overbought zone, a situation soon to be reversed from that of early April.
4) Institutional investors remain cautious ahead of the FED meeting on Wednesday June 18, while trade agreements are still pending
In conclusion, it is important to bear in mind that next week's fundamental highlight will be the FED's monetary policy decision. The market needs to know whether or not the FED will confirm two rate cuts between now and the end of the year. The FED will also be updating its macro-economic projections, and institutional investors are being cautious in the meantime, as shown by the CFTC's latest Commitment Of Traders report.
DISCLAIMER:
This content is intended for individuals who are familiar with financial markets and instruments and is for information purposes only. The presented idea (including market commentary, market data and observations) is not a work product of any research department of Swissquote or its affiliates. This material is intended to highlight market action and does not constitute investment, legal or tax advice. If you are a retail investor or lack experience in trading complex financial products, it is advisable to seek professional advice from licensed advisor before making any financial decisions.
This content is not intended to manipulate the market or encourage any specific financial behavior.
Swissquote makes no representation or warranty as to the quality, completeness, accuracy, comprehensiveness or non-infringement of such content. The views expressed are those of the consultant and are provided for educational purposes only. Any information provided relating to a product or market should not be construed as recommending an investment strategy or transaction. Past performance is not a guarantee of future results.
Swissquote and its employees and representatives shall in no event be held liable for any damages or losses arising directly or indirectly from decisions made on the basis of this content.
The use of any third-party brands or trademarks is for information only and does not imply endorsement by Swissquote, or that the trademark owner has authorised Swissquote to promote its products or services.
Swissquote is the marketing brand for the activities of Swissquote Bank Ltd (Switzerland) regulated by FINMA, Swissquote Capital Markets Limited regulated by CySEC (Cyprus), Swissquote Bank Europe SA (Luxembourg) regulated by the CSSF, Swissquote Ltd (UK) regulated by the FCA, Swissquote Financial Services (Malta) Ltd regulated by the Malta Financial Services Authority, Swissquote MEA Ltd. (UAE) regulated by the Dubai Financial Services Authority, Swissquote Pte Ltd (Singapore) regulated by the Monetary Authority of Singapore, Swissquote Asia Limited (Hong Kong) licensed by the Hong Kong Securities and Futures Commission (SFC) and Swissquote South Africa (Pty) Ltd supervised by the FSCA.
Products and services of Swissquote are only intended for those permitted to receive them under local law.
All investments carry a degree of risk. The risk of loss in trading or holding financial instruments can be substantial. The value of financial instruments, including but not limited to stocks, bonds, cryptocurrencies, and other assets, can fluctuate both upwards and downwards. There is a significant risk of financial loss when buying, selling, holding, staking, or investing in these instruments. SQBE makes no recommendations regarding any specific investment, transaction, or the use of any particular investment strategy.
CFDs are complex instruments and come with a high risk of losing money rapidly due to leverage. The vast majority of retail client accounts suffer capital losses when trading in CFDs. You should consider whether you understand how CFDs work and whether you can afford to take the high risk of losing your money.
Digital Assets are unregulated in most countries and consumer protection rules may not apply. As highly volatile speculative investments, Digital Assets are not suitable for investors without a high-risk tolerance. Make sure you understand each Digital Asset before you trade.
Cryptocurrencies are not considered legal tender in some jurisdictions and are subject to regulatory uncertainties.
The use of Internet-based systems can involve high risks, including, but not limited to, fraud, cyber-attacks, network and communication failures, as well as identity theft and phishing attacks related to crypto-assets.

How to Choose Chart Types in TradingViewThis tutorial covers the 21 chart types available in TradingView, explaining what each one is, how to read it, as well as the advantages and drawbacks.
Learn more about trading futures with Optimus Futures using the TradingView platform here: www.optimusfutures.com
Disclaimer:
There is a substantial risk of loss in futures trading. Past performance is not indicative of future results. Please trade only with risk capital. We are not responsible for any third-party links, comments, or content shared on TradingView. Any opinions, links, or messages posted by users on TradingView do not represent our views or recommendations. Please exercise your own judgment and due diligence when engaging with any external content or user commentary.
This video represents the opinion of Optimus Futures and is intended for educational purposes only. Chart interpretations are presented solely to illustrate objective technical concepts and should not be viewed as predictive of future market behavior. In our opinion, charts are analytical tools—not forecasting instruments. Market conditions are constantly evolving, and all trading decisions should be made independently, with careful consideration of individual risk tolerance and financial objectives.

Expect a Retracement... BUT not a Reversal in S&P Hi Trading Community,
Just a quick update on what I expect price action to look like for the ES over the next couple of days.
As you know, I've been bullish on this move — and I still am. However, there is some justification for a potential retracement to key levels. In particular, my attention is on the 5928 area.
It's too early to call this a full reversal, but let’s stay sharp in our trading and continue learning.
#OneCandleStickAtATime

Futures RSII will go through why I prefer the 63 RSI to be OHLC4 or HLC3. That's because I think Volume Weighted MA is influenced by the high, low, and close price, so I use either that or OHLC4 after double smoothing it. Watch the 70-30 and oversold levels as a potential reversal play; typically, everything above 35 is bullish and everything below 65 is bearish, with 50 as TP. The most powerful aspect of the RSI lies in finding divergences from the strength of the RSI and the direction of price; that's where the largest trades I have taken were made.

Prepare For A Stock Market Crash
S&P 500 E-mini Futures, Daily Chart.
Potential Ending Diagonal.
Nothing serious. Just a Stop-hunt. But Fast & Furious...
......................................................................................................................
We are not registered or licensed in any jurisdiction whatsoever to provide investing advice or anything of an advisory or consultancy nature.
and are therefore are unqualified to give investment recommendations.
Always do your own research and consult with a licensed investment professional before investing.
This communication is never to be used as the basis of making investment decisions, and it is for entertainment purposes only.

Buy OIL & GOLD, Sell Stocks Indices When Missiles Are Flying!In this Weekly Market Forecast, we will analyze the S&P 500, NASDAQ, DOW JONES, Gold and Silver futures, for the week of June 16-20th.
When missiles start flying in the Middle East, investors become reactively risk averse. Money goes from stocks to safe havens and oil. That's it. Expect oil prices to rise, Gold to reach new highs, and the equity markets to see more sellers than buyers.
This environment may last a few days or a few weeks. Keep an ear to the news.
Enjoy!
May profits be upon you.
Leave any questions or comments in the comment section.
I appreciate any feedback from my viewers!
Like and/or subscribe if you want more accurate analysis.
Thank you so much!
Disclaimer:
I do not provide personal investment advice and I am not a qualified licensed investment advisor.
All information found here, including any ideas, opinions, views, predictions, forecasts, commentaries, suggestions, expressed or implied herein, are for informational, entertainment or educational purposes only and should not be construed as personal investment advice. While the information provided is believed to be accurate, it may include errors or inaccuracies.
I will not and cannot be held liable for any actions you take as a result of anything you read here.
Conduct your own due diligence, or consult a licensed financial advisor or broker before making any and all investment decisions. Any investments, trades, speculations, or decisions made on the basis of any information found on this channel, expressed or implied herein, are committed at your own risk, financial or otherwise.

The Line in the Sand for the entire Post-Liberation Day recoverySince the market traded a double bottom two months ago on the 9th of April, it has rallied over 20% on Trump's backtracking of his foreign policy stance regarding international trade.
Throughout this rally, this trendline has proven to be the only respected structural artifact save for this fixed-range volume profile that serves as the sole area of high liquidity.

ES Futures-Weekly OutlookCME_MINI:ES1!
Fundamentals and Economic Calendar
Data Recap:
• Friday: 06/06/2025
o US Non-Farm Payrolls (May) 139k vs. Exp. 130k (Prev. 177k, Rev. 147k)
o US Unemployment Rate (May) 4.2% vs. Exp. 4.2% (Prev. 4.2%)
o US Average Earnings YY (May) 3.9% vs. Exp. 3.7% (Prev. 3.8%, Rev. 3.9%)
• Overnight Monday: 06/09/2025
o Chinese Trade Balance (USD)(May) 103.22B vs. Exp. 101.3B (Prev. 96.18B)
o Chinese Exports YY (USD)(May) 4.8% vs. Exp. 5.0% (Prev. 8.1%)
o Chinese Imports YY (USD)(May) -3.4% vs. Exp. -0.9% (Prev. -0.2%)
o Chinese CPI MM (May) -0.2% vs. Exp. -0.2% (Prev. 0.1%)
o Chinese PPI YY (May) -3.3% vs. Exp. -3.2% (Prev. -2.7%)
o Chinese CPI YY (May) -0.1% vs. Exp. -0.2% (Prev. -0.1%)
Looking ahead this week on the calendar, notable economic data releases are as follows:
• Wednesday: 06/11/2025
o US CPI YoY (May)
o US CPI MoM (May)
o US 10 year Note Auction
• Thursday: 06/12/2025
o US PPI MoM (May)
o US PPI YoY (May)
o US 30 year Bond Auction
• Friday: 06/13/2025
o Michigan Consumer Sentiment (Jun)P
o Michigan 1-year and 5-year Inflation Expectations (Jun)P
On the trade and tariff front, we have China-US trade talks continuing in the UK today. The Chinese Vice Premier is visiting the UK from June 8th-13th.
There has been progress made which is visible in terms of China relaxing export controls on rare earth minerals and President Trump stating that they are very far advanced on the China deal ahead of high level talks in London today.
The FED is in a blackout period until the FOMC meeting. Trade, tariffs, and geopolitical risks still need to be monitored.
Technical:
What has the market done?
With NQ leading, ES has also reclaimed yearly open. It held above yearly open in the overnight session.
What is it trying to do?
Climb higher, overlapping bars and yearly VPOC shifting higher denote acceptance at higher prices.
How good of a job is it doing?
Overlapping bars, headline risks and leveraged positions also point towards potential for prices moving lower before resuming higher or remaining range bound. TACO acronym traders may be in for max pain.
What is more likely to happen from here?
Given the data above, we would iterate given our previous explanation that recent data including CPI, PPI, Trade imports, exports is skewed due to trade tensions and this being reflected in business and consumer behavior. FED is likely to remain on hold while it waits and averages out the impact on growth, inflation and labor market.
Scenario 1: Push higher
Prices continue to push higher, if CPI comes in lower than expected, this may prompt a short-term continuation higher.
Scenario 2: Range bound
Markets remain in wait and see mode this week having climbed above yearly open. Markets build value higher and we expect VPOC to shift higher too.
Scenario 3: Sell-off
A mix of factors could e.g., trade talks stalling, weaker than expected US 10 year and 30 year auctions could foreshadow cracks appearing in the bonds market. This may fuel a wider sell-off if yields climb back higher.
Glossary:
ES - emini-S&P 500 Futures
NQ - emini-NASDAQ 100 Futures
VPOC - Volume Point of Control: The most traded price by volume in a given range. Represents acceptance or consensus

06/13/25 Trade Journal, and ES_F Stock Market analysisEOD accountability report: +3825
Sleep: 5.5 hours (sleep is declining, will spend the weekend catching up)
Overall health: Good
What was my initial plan? I wanted to short 6016-6020 area in the morning but we didn't open up to that, so i just sat on sideline until we hit the 6025 , took a big short there and paid off really well.
Daily Trade recap based on VX Algo System from (9:30am to 2pm)
— 9:30 AM Market Structure flipped bearish on VX Algo X3!
— 10:30 AM Market Structure flipped bearish on VX Algo X3!
— 10:40 AM VXAlgo YM X1 Buy Signal
— 11:30 AM Market Structure flipped bullish on VX Algo X3!
— 12:21 PM VXAlgo ES X1 Sell Signal (double signal)
— 1:12 PM VXAlgo NQ X3 Sell Signal
— 1:30 PM Market Structure flipped bearish on VX Algo X3!
Next day plan--> Above 6010 = Bullish, Under 5965= Bearish
Video Recaps -->https://www.tradingview.com/u/WallSt007/#published-charts

Tiqgpt signals for today! Starting with the 1D timeframe, the S&P 500 E-mini Futures have shown a progressive upward movement, indicating a strong bullish market structure. The presence of consecutive bullish candles suggests a dominant buying interest, likely from institutional players. This upward trajectory is supported by the formation of a significant Order Block (OB) around the 5,975 level, which has not been revisited, indicating a lack of mitigation and a strong upward drive.
Drilling down to the 4H timeframe, we observe a consolidation pattern forming just below the 6,000 level, which acts as a psychological round number and potential liquidity pool. The market has made several attempts to breach this level, suggesting an accumulation of buy orders and potential preparation for a liquidity sweep above this zone.
On the 1H chart, the price action has developed a tighter range, oscillating around the 6,004 level. This consolidation near a high indicates a potential inducement zone, where smart money might be trapping retail traders into premature bearish positions before a possible upward expansion.
The 15M timeframe shows a recent Break of Structure (BOS) above the previous high at 6,004, confirming a bullish bias in the lower timeframes. This BOS is crucial as it suggests a shift in market structure favoring continued bullish momentum.
Finally, the 5M chart provides a granular view of the buying pressure. A sharp upward move followed by a small retracement forms a Fair Value Gap (FVG) around 6,004, which has not been filled, indicating that the price might revisit this area to mitigate the imbalance before continuing upwards.
INSTITUTIONAL THESIS:
The overarching smart money intent appears to be targeting the liquidity above the 6,000 level, using it as a springboard for further bullish expansion. The setup across multiple timeframes suggests a coordinated effort to induce bearish sentiment near this key psychological level, only to trap those positions and drive the price higher through a liquidity sweep.

Mean Reversion + Alternative Long Set-Up MES🔁 MES Mean Reversion Setup – Fade the Gamma Pin
• Trend Bias: Neutral-to-Bearish
• Entry Zone: $6,012–$6,016
• Stop-Loss: $6,020
• TP1 / TP2: $5,998 / $5,985
• R:R Ratio: ~1:2
• Confidence Score: 7.5/10
• Reasoning:
Price is stalling inside top of Fib zone and SpotGamma’s gamma ceiling.
Vol is crushed and mean reversion dominates without fresh upside catalyst.
Clean rejection of 6,012 area intraday offers high-conviction fade down to VWAP zones and liquidity pools under 6,000.
⚠️ Alternative Long Setup – Only on Break + Hold of 6,020
• Trend Bias: Bullish breakout continuation
• Entry Zone: $6,022–$6,025
• Stop-Loss: $6,015
• TP1 / TP2: $6,050 / $6,075
• R:R Ratio: ~1.5:1
• Confidence Score: 6.5/10
• Reasoning:
Would signal breach of gamma wall (unusual without major news).
Requires follow-through volume and tape support from HIRO or strong opening drive.
🧠 Key Notes Going Into the Week:
SPX pinned at 6,000 = no trend yet, just controlled chop.
JPM 5,905 call (June 30 expiry) still anchoring downside gamma. If MES > 6,012 holds on volume, prepare for potential chase.
Next macro catalyst: Wednesday’s CPI (6/11). Until then, expect low realized vol and grind behavior.

Stock market cycles & liquidity, understand it all in 3 minutesLiquidity is a key factor in market finance. Without it, risky assets in the stock market, equities and cryptocurrencies lose their fuel. Over the cycles, one thing has become clear: the direction of financial markets is strongly correlated with that of global liquidity. But liquidity is not a single indicator: it is organized into three complementary layers. Understanding these layers enables us to better anticipate major trends. Level 1 is global monetary liquidity (M2). Level 2 concerns net liquidity within the financial system, and level 3 encompasses overall macro-liquidity, through activity and credit indicators. Together, these three dimensions form the markets' “bloodstream”.
The chart below compares the S&P 500 trend with the global money supply M2
Level 1: Global monetary liquidity (global M2)
The first stage of the rocket: global M2. This monetary aggregate measures the sum of the money supply (M2) of the major economies - USA, China, Eurozone - converted into US dollars. It includes sight deposits, savings accounts and certain short-term instruments, representing the gross liquidity immediately available in the global economy.
This level of liquidity is directly influenced by monetary (key rates, QE/QT), fiscal and wage policies. The evolution of the US dollar plays a crucial role: a strong dollar mechanically reduces global M2 in USD, while a weak dollar increases it. In this respect, Chinese and American dynamics are often divergent, as they are driven by different credit logics (centralized planning on the Chinese side, rate-based adjustment on the US side).
But beyond the absolute level, it is above all the momentum of M2, its first derivative (annual variation), that serves as a compass. An uptrend coupled with positive momentum strongly favours risky assets. Conversely, stagnation or a negative divergence between trend and momentum (as at the end of 2021) anticipates a contraction in valuations. Over this cycle, there is even a correlation coefficient of 0.80 between global M2 and Bitcoin, projected 12 weeks into the future: liquidity leads, markets follow.
Level 2: Net liquidity of the financial system
The second level is more subtle, but just as decisive: net liquidity within the financial system. This is the effective credit capacity, i.e. the funds actually available to irrigate the real economy after withdrawals, excess reserves and regulatory mechanisms. Unlike M2, this measure does not reflect gross liquidity, but rather the liquidity “actionable” by financial institutions.
In the United States, this net liquidity depends, among other things, on FED mechanisms such as the reverse repo program (RRP), which temporarily sucks in or releases liquidity, and on the level of banks' excess reserves. Its evolution is strongly linked to the central bank's restrictive or accommodating monetary policy, QE cycles and QT cycles.
The correlation of this net liquidity with the S&P 500 and Bitcoin, although slightly lower than that of global M2, remains significant. It acts as a filter for gross liquidity: even if M2 is high, if credit capacity is blocked by excessively high rates or constrained reserves, the impact on markets can be neutralized.
Level 3: Global macro liquidity
Finally, the third level: global macro liquidity. It includes barometers of economic conditions that directly influence risk perception and investor appetite: PMI indices (manufacturing and services), credit conditions, employment levels, default rates, etc. It is less monetary, more conjunctural. It is less monetary, more cyclical, but its impact is real, as it shapes the context in which financial liquidity is expressed.
It is this level that contextualizes the first two: a rising M2 in a deteriorating economic environment (PMI below 50, falling employment) may have a limited effect. Conversely, signs of economic recovery may reinforce the transmission of liquidity to the markets. In this sense, the timing of the FED's rate cuts becomes a key macro catalyst. As long as US policy remains restrictive, M2 will plateau and net liquidity will remain constrained, even if the ECB or PBoC relax their conditions.
Conclusion: Global liquidity cannot be summed up in a single indicator. It's an ecosystem structured on three levels: global gross liquidity (M2), effective credit capacity (ECC) and net liquidity.
DISCLAIMER:
This content is intended for individuals who are familiar with financial markets and instruments and is for information purposes only. The presented idea (including market commentary, market data and observations) is not a work product of any research department of Swissquote or its affiliates. This material is intended to highlight market action and does not constitute investment, legal or tax advice. If you are a retail investor or lack experience in trading complex financial products, it is advisable to seek professional advice from licensed advisor before making any financial decisions.
This content is not intended to manipulate the market or encourage any specific financial behavior.
Swissquote makes no representation or warranty as to the quality, completeness, accuracy, comprehensiveness or non-infringement of such content. The views expressed are those of the consultant and are provided for educational purposes only. Any information provided relating to a product or market should not be construed as recommending an investment strategy or transaction. Past performance is not a guarantee of future results.
Swissquote and its employees and representatives shall in no event be held liable for any damages or losses arising directly or indirectly from decisions made on the basis of this content.
The use of any third-party brands or trademarks is for information only and does not imply endorsement by Swissquote, or that the trademark owner has authorised Swissquote to promote its products or services.
Swissquote is the marketing brand for the activities of Swissquote Bank Ltd (Switzerland) regulated by FINMA, Swissquote Capital Markets Limited regulated by CySEC (Cyprus), Swissquote Bank Europe SA (Luxembourg) regulated by the CSSF, Swissquote Ltd (UK) regulated by the FCA, Swissquote Financial Services (Malta) Ltd regulated by the Malta Financial Services Authority, Swissquote MEA Ltd. (UAE) regulated by the Dubai Financial Services Authority, Swissquote Pte Ltd (Singapore) regulated by the Monetary Authority of Singapore, Swissquote Asia Limited (Hong Kong) licensed by the Hong Kong Securities and Futures Commission (SFC) and Swissquote South Africa (Pty) Ltd supervised by the FSCA.
Products and services of Swissquote are only intended for those permitted to receive them under local law.
All investments carry a degree of risk. The risk of loss in trading or holding financial instruments can be substantial. The value of financial instruments, including but not limited to stocks, bonds, cryptocurrencies, and other assets, can fluctuate both upwards and downwards. There is a significant risk of financial loss when buying, selling, holding, staking, or investing in these instruments. SQBE makes no recommendations regarding any specific investment, transaction, or the use of any particular investment strategy.
CFDs are complex instruments and come with a high risk of losing money rapidly due to leverage. The vast majority of retail client accounts suffer capital losses when trading in CFDs. You should consider whether you understand how CFDs work and whether you can afford to take the high risk of losing your money.
Digital Assets are unregulated in most countries and consumer protection rules may not apply. As highly volatile speculative investments, Digital Assets are not suitable for investors without a high-risk tolerance. Make sure you understand each Digital Asset before you trade.
Cryptocurrencies are not considered legal tender in some jurisdictions and are subject to regulatory uncertainties.
The use of Internet-based systems can involve high risks, including, but not limited to, fraud, cyber-attacks, network and communication failures, as well as identity theft and phishing attacks related to crypto-assets.

Bullish Trigger Hit! Looking For Longs on the S&PLast time we spoke, I mentioned some key levels I wanted to see price drop to before considering a move to the upside. And what do you know — here we are.
In today’s video, I share an update on the trade idea and how we can position ourselves for the next big play.
Walk with me as I break down this price action, #OneCandlestickAtATime.

S&P – Bearish outlook, correction coming next week?A lot of chatter recently suggests traders don't trust this rally, I can see why. From both a technical and macro perspective, things are beginning to look shaky.
The S&P 500 is hovering around the psychological 6000 level, moving in and out with little conviction. The index has already broken its first upward trendline, and while it’s attempting to hold a second, momentum appears to be fading.
We’re currently seeing the formation of a rising wedge pattern. More importantly, RSI is diverging from price action, suggesting weakening momentum.
While inflation has come down from its peak, monetary policy remains tight. Rates have been high for a while now, and the effects may be surfacing.
Hiring appears to be slowing. Initial jobless claims have been ticking up for months. Challenger job cuts just spiked above 200K, a level we haven't seen since COVID or 2008.
Interestingly, the recent JOLTS report shows that job openings increased, but quits declined, perhaps suggesting workers are less confident about job-hopping?
Despite this, unemployment held steady at 4.2% today. Historically, unemployment tends to lag Challenger job cuts by a few months, so we could be in for a jump in July or August, similar to the pattern we saw last year, which caused a huge correction.
From a technical standpoint, I’ve entered a small short position here. Momentum is fading, and the wedge breakdown looks interesting. With that said, with macro uncertainty and the possibility of QE-style stimulus returning if economic data worsens, I’m cautious. We’ve seen markets rally on bad news before, especially in crisis environments, like covid times.
The CPI report next week is interesting. If inflation surprises to the upside, the bearish case strengthens. If it cools more than expected, markets might push higher before any real correction.
Interesting times going into summer.

