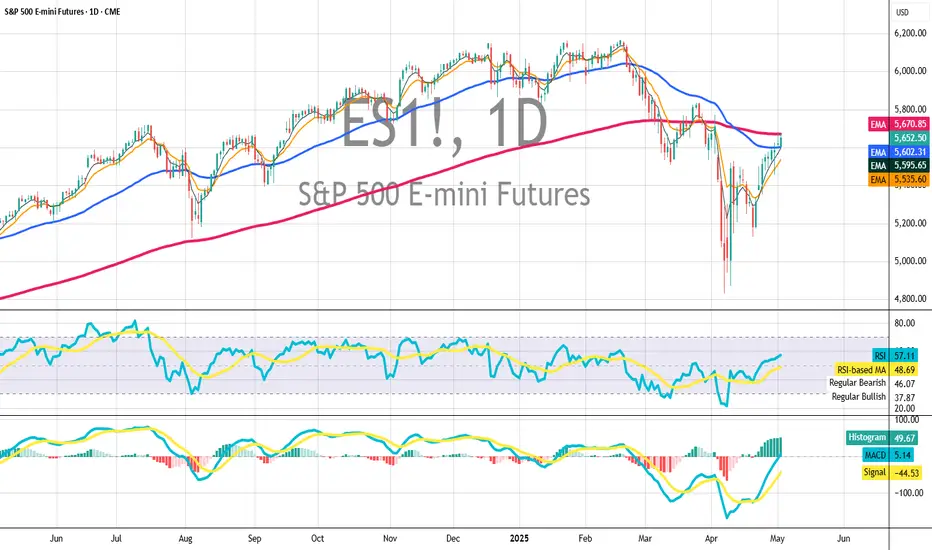
ES Futures-ICT Concepts (Levels for 4/28-5/2)Levels to observe for next week April 28 through May 2, 2025
Based on ICT concepts, There has been a change in the states of delivery (CISD) and Fair value gap (FVG) that has formed on the daily time frame.
This, of course, is after price has delivered lower into a discount area.
Looking for by programs on Monday and Tuesday, given that it’s is NFP protocol.
ES1! trade ideas

ES/SPY Market Prediction April - July 2025ES/SPY Bounced of the Previous 2022-23 highs
Looking for retracement to gap fill to downside
before continuing the move up.
This prediction is to play out in next 3-4 months
Prediction is assuming levels marked will hold/reject.
Disclaimer: This prediction is my opinion and not
intended to be taken as financial advice.


Plan Your Trade Update For 4-21 : Waiting For The EPP SetupThis video is, hopefully, going to help many of you learn to use the Excess Phase Peak (EPP) pattern more efficiently.
For months, I've been trying to teach all of you to use this pattern to efficiently identify and trade some of the biggest price moves.
Remember, price only does TWO THINGS - TREND or FLAG.
These components are essential to the EPP pattern setup.
First, price must TREND into a peak or trough.
Second, price must pullback from the peak or trough.
Third, price must move into a SIDEWAYS/FLAGGING formation.
Forth, price must break away from the sideways/flagging formation and attempt to TREND into the new consolidation phase.
Fifth, once the new consolidation phase starts, price will trend and flag within the consolidation range for a period of time - before...
Sixth, price will attempt to break up or down to the Ultimate High/Low.
This chart of the ES/SPY will show you how I used my analysis to "front-load" my positions before the Easter holiday weekend.
I've been telling all of you the markets would likely attempt to move a little bit higher, trying to target 525-535 (if we are lucky). Then, price would roll into a topping formation and move downward towards my May 3-6th low (estimate).
Last Thursday, I decided to throw on two positions to protect against any big news that may cause the markets to collapse over the holiday weekend.
I picked up :
4 SDS CALL options @ $23 expiring on May 16
3 XLF PUT options @ $47 expiring on May 16
Both of those trades worked out perfectly this morning. I booked 2 of the XLF and 2 of the SDS for profits near 1030 AM PT. Lovely.
Next, in between phone calls and loading up my car for a short trip, I noticed a beautiful EPP pattern setting up in the ES, and that EPP pattern has already reached what I believe to be the Ultimate Low.
I tried to get into 2 SPY Call options @ $512 and held my breath to see if I timed the entry well.
NOT.
I took a $280+ loss on those two Calls.
I waited a bit longer to see what price did, and after the price setup a base below $510 on the SPY, I loaded up on two more SPY Calls @ $510 and two SSO calls @ $67 about 70-80 minutes before the end of trading.
The way I looked at it, I already had my downside trades placed from last Thursday, and I just added some upside exposure while my downside trades were profitable.
I didn't know if the SPY would rally or not, but the EPP Ultimate Low setup suggested NOW is the time to buy.
So, I kept both downside and upside trades active to protect my account overnight.
The SPY rallied into the close, and I ended up making some nice profits off that EPP Ultimate Low.
Now, I'm going to wait to see what happens tomorrow morning and try to BOOK my upside trades in profits while letting my longer-term downside trades play out into early/mid May.
This is trading. The entire purpose of trading, like I trade, is to position for the best opportunities and try to catch the GIFTS the market throws at you as often as possible.
Nothing is guaranteed, but price ultimately shows us everything we need to know.
Watch this video to see if you understand the EPP Ultimate Low that prompted me to buy my CALLS today.
If so, then you are starting to GET IT, and that is a very big step towards improving your trading skills.
Get some.
#trading #research #investing #tradingalgos #tradingsignals #cycles #fibonacci #elliotwave #modelingsystems #stocks #bitcoin #btcusd #cryptos #spy #gold #nq #investing #trading #spytrading #spymarket #tradingmarket #stockmarket #silver

SPY/QQQ Plan Your Trade Update For 4-23 : Rally-111 PatternToday's pattern really showed up pre-market.
Where was the rally today? It happened before the US markets opened for business.
The SPY/QQQ had already moved up into my upper resistance area on strong buying overnight.
I knew I had to run my father around most of the day, so I booked my profits this morning and tried to catch one little SPY rally (that didn't work out).
So, I started taking some positions for next week's potential downtrend, and I thought, "How much risk am I taking on these trades if the markets continue to move upward?"
I realized I would be taking about $1000 to $1400 in total risk, but my expiration date is near May 16. So my target for any profit really needs to be before May 10th or so.
If the markets do what I expect, I'll be sitting back, watching my profits grow as the markets trend downward into my May 2 Major Bottom (I hope).
I created this video to highlight the now partially confirmed inverted EPP pattern that setup the Ultimate High in early trading today.
Now that we've completed the inverted EPP pattern, we should be looking for the ES/SPY/QQQ to move downward, shift into a sideways/upward price flag. Then, break down into the new Consolidation phase.
Essentially, if my EPP patterns play out well, I timed my move away from longs/calls and into shorts/puts almost perfectly. Now, I just need to sit back and wait for the markets to make a move.
This is what trading is all about. You can't kick the markets to do what you want them to do. You have to learn to take what the markets give you and fall in line with market trends.
When you do that well, profits start to fall into your lap (if you are patient).
Follow along as I break down these market trends and learn how to develop your own skills.
GET SOME.
#trading #research #investing #tradingalgos #tradingsignals #cycles #fibonacci #elliotwave #modelingsystems #stocks #bitcoin #btcusd #cryptos #spy #gold #nq #investing #trading #spytrading #spymarket #tradingmarket #stockmarket #silver


MES1!/ES1! Day Trade Plan for 04/23/2025MES1!/ES1! Day Trade Plan for 04/23/2025
📈 5512
📉 5440
Thanks to all my followers! Truly appreciate the support!
Please like and share for more NQ levels Tues & Thurs 🤓📈📉🎯💰
*These levels are derived from comprehensive backtesting and research and a quantitative system demonstrating high accuracy. This statistical foundation suggests that price movements are likely to exceed initial estimates.*

An enthusiastic buyers responseThe S&P 500 daily chart revealed an enthusiastic buyer's response as indicated by the rally during the day session and the continuation of this in the beginning of the Asia session. The expectation is for these buyers to continue higher and to close positive in Wednesday's session.

ES UpdateNot many of my followers trade futures, but in case I don't have time to post an update before work tomorrow:
1) Another open gap down. I don't think it fills until RSI hits oversold and we get a bounce.
2) Dollar index broke support, but wouldn't surprise me if it did a backtest (maybe)
3) Gold trying to "break out" yet again, but a dollar backtest will look like another failed breakout (maybe)
4) Lots of earnings this week including TSLA Tues.
I established a long position in gold, but I intend to hold it for a while. Not my usual short term trade. No desire to go long on stocks during earnings season when every company is going to be talking about tariff impacts.

ES Daily Indicator UpdateI think the market is gonna go oversold on the daily again. It broke the wrong way out of the pennant-like structure, we still haven't heard about the electronics tariff, and we've got a slew of earnings coming up where every conf call will talk about tariffs and recession.
Long on gold at least until we hit that bottom again, not shorting because of the open gaps above. I think the only hope of filling those gaps is a deal with China. Even if that happens, it'll probably be a few weeks or months.
If daily indicators go oversold, I plan on going long on index or sector ETFs. Too risky right now to bet on individual stocks.


ES UpdateSorry, I don't have time to post during work hours, I did comment on my last ES post though. As I mentioned, RSI hit oversold mid day on my 3hr chart with positive MFI divergence.
So here's an updated plot. I can't watch the market continuously, so I didn't play the bounce. Thought about some calls EOD, but if you hold a long position overnight, you're basically betting on TRump keeping his mouth shut for a day. Didn't like the odds, lol.
Futures are green so far though. Just keep in mind TSLA reports tomorrow after hours (AH). I'm not planning on going long on the stock market until the daily gets oversold. At least that'll give me bigger bounce where I don;t have to pay attention every minute, lol.

Bulls Need a Win Here—5,148 Is Key SupportMarket Overview:
Welcome to today’s market overview. We’ll break down the current trends, price movement, and where we are on the Fibonacci roadmap. This helps us frame the market’s current path and the key levels that may trigger a shift in momentum.
Despite a soft start to the week, market sentiment is adjusting to expectations around upcoming economic data. Investors are watching for fresh signals on inflation and interest rates, with earnings season underway and more heavyweight tech names reporting soon. After a volatile couple of weeks, the S&P 500 appears to be stabilizing—but it’s not out of the woods yet.
Bearish/Bullish Trend Analysis
Trend Condition:
Bullish Trends: 6
Bearish Trends: 8
Overview:
The market is leaning slightly bearish, with 8 trend lines pointing lower and 6 still showing bullish momentum. This split reflects some indecision after a strong downtrend, suggesting the market could be attempting to stabilize but hasn’t flipped the trend yet.
Price Action and Momentum Zones
Current Price and Change:
Currently, the S&P 500 Futures are at 5,294.25, down by 32.25 points or -0.61%.
Market Behavior:
Price dipped again this week but held just above recent support levels. It’s not a sharp breakdown, but momentum remains heavy, and buyers haven’t stepped in with strength yet.
Momentum Zones:
Price is hovering just above the 38.2% Fib retracement, in the middle of the corrective zone. In a bearish context, this area acts as a supply zone—any bounce here could still be countertrend unless buyers regain control above 5,537.
Fib Retracement Levels
Current Position Relative to Levels:
The market is currently just above the 38.2% retracement level.
Key Fibonacci Levels:
23.6% → 5,537.68
38.2% → 5,148.66
50.0% → 4,834.25
61.8% → 4,519.84
Analysis:
Hovering above the 38.2% level suggests the market is still trying to find its footing after the recent drop. If buyers can hold this zone, it could lead to a short-term rebound—but failure here may open the door to deeper support around 4,834.
Overall Market Interpretation
This week’s move hasn’t changed the broader outlook much. The trend remains under pressure, but the fact that support is holding gives bulls a chance to reset the tone. If the market can string together a few sessions above this zone, we could see a shift—but for now, the bias remains cautious.
Summary
The S&P 500 Futures are showing weakness early in the week. The broader trend remains bearish, and the 38.2% Fibonacci level is acting as support for now. This zone could determine whether a recovery builds or if sellers press further. Watch price action closely next week—this is a decision zone.

Weekly Market Forecast: Stocks Markets Are Stalled! Patience!In this video, we will analyze the S&P 500, NASDAQ, and DOW JONES futures for the week of April 21 - 25th
The Markets are stalled! No bullish follow through from the previous week. Last week failed to break the previous weekly high. This stall out looks consolidative and unclear. Wait for clarity! Let the markets break the high or low of the range convincingly... and trade accordingly.
Enjoy!
May profits be upon you.
Leave any questions or comments in the comment section.
I appreciate any feedback from my viewers!
Like and/or subscribe if you want more accurate analysis.
Thank you so much!
Disclaimer:
I do not provide personal investment advice and I am not a qualified licensed investment advisor.
All information found here, including any ideas, opinions, views, predictions, forecasts, commentaries, suggestions, expressed or implied herein, are for informational, entertainment or educational purposes only and should not be construed as personal investment advice. While the information provided is believed to be accurate, it may include errors or inaccuracies.
I will not and cannot be held liable for any actions you take as a result of anything you read here.
Conduct your own due diligence, or consult a licensed financial advisor or broker before making any and all investment decisions. Any investments, trades, speculations, or decisions made on the basis of any information found on this channel, expressed or implied herein, are committed at your own risk, financial or otherwise.

E-mini S&P 500 Outlook for next week. Thought process is the same just like NQ1!. Want massive buyside expansion. But weekly profiles need to be there. Tuesday/Wednesday Low of the Week is what I' personally looking for.
So expecting an SMT Divergence on the Previous Weekly Sellside . And then a massive push up.
2nd Stage Distribution on Market Maker Buy Model. Offset it is. Crosshairs on 5529

How to Enter Trades the RIGHT Way!In this video, we're tackling an important question from our community member who's been crushing it in paper trading but faces the common challenge of entering trades blindly based on alerts, fearing they'll miss out otherwise.
We'll discuss:
Why blindly following signals can hurt your long-term success
The power of context in market structure: Why waiting for price to hit key support/resistance levels drastically improves your entries
A practical approach to manage FOMO: How scaling into trades can balance quick reaction times with better entries and tighter stops
Real examples of good vs. rushed entries, highlighting the impact on your risk-to-reward


This daily pattern can change your view on price!Dear Community,
How many patterns do you know?
<5?
<20?
>20?
How many of them actually work with GREAT accuracy?
Patterns are something that we often use in trying to predict the markets….BUT I dear to say pattern alone won’t work?
THE PATTERN NEED A FRAMEWORK!
let’s discuss this “pattern” highlighted on your screen.
Why is the candle after that “doji “ higher?
Often you try to “call tops” in the market place.
And after seeing this “doji”…. WE SELL RIGHT?
if the maker is going up why do we try and call a top?
Why do we try and not “follow the trend?”
On your daily chart examine this.
IF THE MARKET IF BULLISH AND I SEE A DOJI!
Study the candle that formed just after. YOU WILL BE AMAZED BY THE FINDINGS 😃.
No I will not share the stats. If an “homework” for your own development. Let’s discuss this further in the comments below.

May 1st Trade Journal & Stock Market Analysis**May 1st Trade Journal & Stock Market Analysis**
EOD accountability report: +441
Sleep: 7 hour, Overall health: :thumbsup:
Signals were pretty solid today, but there's heavy MM manipulation in the market so be careful trading funded accounts.
Walk away if you get tilted.
**Daily Trade recap based on VX Algo System**
9:51 AM Market Structure flipped bullish on VX Algo X3!
10:30 AM Market Structure flipped bullish on VX Algo X3!
11:31 AM VXAlgo YM X1 Sell Signal
12:08 PM Market Structure flipped bearish on VX Algo X3!
1:47 PM Market Structure flipped bullish on VX Algo X3!
Next day plan--> Over 5600 = Bullish, Under 5600 = Bearish
Video Recaps -->https://www.tradingview.com/u/WallSt007/#published-charts

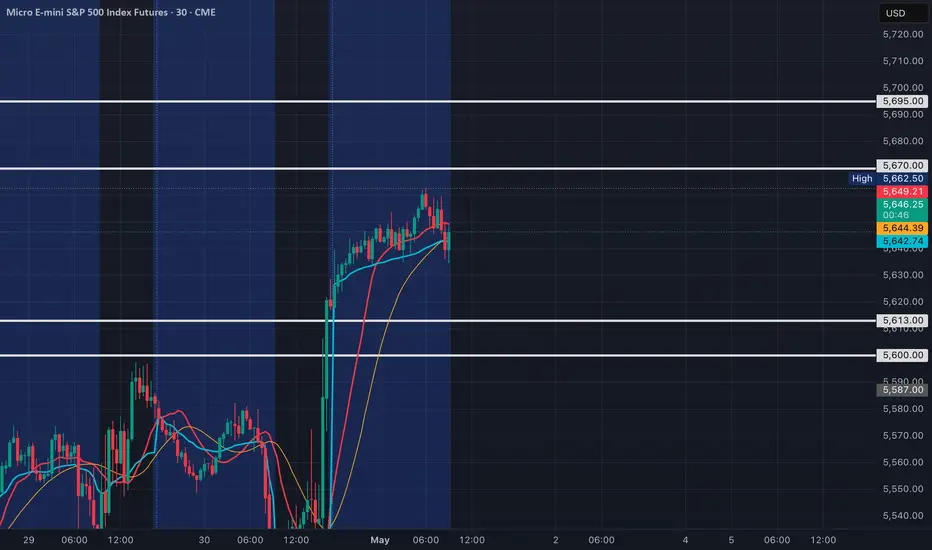
MES1!/ES1! Day Trade Plan for 05/01/2025MES1!/ES1! Day Trade Plan for 05/01/2025
📈 5670 5695
📉 5613 5600
Thanks to all my followers! Truly appreciate the support!
Please like and share for more ES/NQ levels Tues & Thurs 🤓📈📉🎯💰
*These levels are derived from comprehensive backtesting and research and a quantitative system demonstrating high accuracy. This statistical foundation suggests that price movements are likely to exceed initial estimates.*
MES!/ES1! Day Trade Plan for 04/29/2025MES!/ES1! Day Trade Plan for 04/29/2025
📈 5555 5580
📉 5500 5475
Thanks to all my followers! Truly appreciate the support!
Please like and share for more ES/NQ levels Tues & Thurs 🤓📈📉🎯💰
*These levels are derived from comprehensive backtesting and research and a quantitative system demonstrating high accuracy. This statistical foundation suggests that price movements are likely to exceed initial estimates.*
