$ES next bounce Next bounce at;
5530.25- 5526.75
Manage risk; a 15 min close below 5526.75
Reward; 8 ticks+
ESZ2021 trade ideas

Morning Session Review ES 6-20-24Going over the Morning Session looking for clues as to what the market is telling us. focusing on our new trade rating system 1-10. 1 trade is impulsive not part of our plan. 10 is we found a trade that fit our trade plan, took action at appropriate time and managed per our system. keep working hard and never Quit.

ES Trade Plan, June 20thExcellent follow through from buyers. And this is charting 101. Tuesday here, I pshared that ES is bull flagging for rally to 5567, 5575, 5585-90. We just hit 85-90. All bonus now for buyers from here. As of now, 5575-76 (weak now), 5560-62 (weak) are supports. Buyers must hold above to keep 5595, 5610 in play . we sell if 5560 fails. CME_MINI:ES1!

ES Price action Review OverNight session 6-20-24going over the price action overnight and the holiday session from yesterday ES. looking for setups and basic plan for today.

ES analysis JuneteenthCME_MINI:ES1! NYSE is closed & ES closes at 1pm - no volume today, dont overtrade. Yesterday, ES was bull flagging to set up a push to 5564, 5575+. Patience paid & we hit 5564. Been basing here since. As of now: Lock in those gains here, hold runner and keep it a risk free day. 5560 is support. Keeps 5576-78, 5585+ in play. 5560 fails, dip to 5549

Quiet dayWith the holiday on Wednesday the expected price movement in the S&P 500 would be a quiet day. Not looking for dramatic volatility to the upside or to the downside without surprise news.

2024-06-18 - a daily price action after hour update - sp500Good Evening and I hope you are well.
sp500 e-mini futures
comment: Nothing fancy to report here either. Market is in balance and bulls poking at 5560. They want a break above for 5600 and will probably get it soon. Bears shorting the resistance at 5558ish and making money but will be quick to give up, if this trades above 5563/5565.
current market cycle: Max bullishness & peak bubble territory. Literally the peakiest of the peaks. Mother of all bubbles. Will end over the next weeks.
key levels: 5540 - 5600
bull case: Perfect buying at the 1h 20ema today for another ath 1 point above. Bulls want 5600 next. I leave room for 1 more leg up but that’s it. No more after that.
Invalidation is below 5540.
bear case: Bears need to stop the higher highs and trade below the 1h 20ema. Until they do that, max bullishness. Don’t make it more complicated. Can literally buy every pullback and make money.
Invalidation is above 5565.
short term: As bullish as one can be. Ride it up. 1 More leg possible to 5600 but that should be it.
medium-long term: Bearish. We will see 5000 over the next weeks again and 4600 over the next 12 months. Will update this time and price wise over the weekend but I expect to at least see 5000 over the next months in 2024. —updated weeks to months.
current swing trade: None
trade of the day: Buying 5543 or near the 1h ema or literally every 15m bear candle and scalp.

ES Price Action REview 6-18-24Going over the Price Action for the DAy ES looking for clues and what the market was trying to tell us. Wednesday market closed call up some of your buddies and enjoy the day off in the sun & the beach like me :)

E-mini S&P and E-mini NQ Actionable LevelsE-mini S&P (September) / E-mini NQ (September)
S&P, yesterday’s close: Settled at 5546.25, up 44.00
NQ, yesterday’s close: Settled at 20,192.75, up 247.25
Bias: Bullish/Neutral
Resistance: 5561*, 5577***, 5620.75**, 5762.75***
Pivot: 5542.75-5546.25
Support: 5533.25**, 5518.50-5521.75***, 5498.75-5503***, 5489.75-5492.75***
NQ (September)
Resistance: 20,271**, 20,532***, 21,410***
Pivot: 20,163-20,192
Support: 19,974-20,012**, 19,904-19,946***, 19,732-19,757****
*Trade ideas cited above are for illustration only, as an integral part of a case study to demonstrate the fundamental concepts in risk management under the market scenarios being discussed. They shall not be construed as investment recommendations or advice. Nor are they used to promote any specific products, or services.
Futures trading involves substantial risk of loss and may not be suitable for all investors. Trading advice is based on information taken from trade and statistical services and other sources Blue Line Futures, LLC believes are reliable. We do not guarantee that such information is accurate or complete and it should not be relied upon as such. Trading advice reflects our good faith judgment at a specific time and is subject to change without notice. There is no guarantee that the advice we give will result in profitable trades. All trading decisions will be made by the account holder. Past performance is not necessarily indicative of future results.

Higher prices are expectedHigher prices are expected in the S&P 500 for Tuesday, June 18 with follow-through from buyers that appeared in the last four sessions.

Daily Recap & Small Account Challenge Day 25A recap of today's action, another strong day for bulls. New all time highs for the S&P and Nasdaq, with semis like AVGO leading the way. VX remained fairly strong today in my opinion, still watching it closely to see if it can get back over 14.35 or if it's time for more decay.

Daily REcap ES price Action Review 6-17-24Going over the price action ES for the day. looking back to how we could have traded it better and what to focus on for the next session.

ES potential for new highsGood Morning Traders,
Closures below 4200 invalidate ES to new highs.
potential reasons for this move:
- humans are like new things
- buyers outweighing sellers
-Stimulus Measures: Government and central bank stimulus programs can inject liquidity into the financial system and provide support to businesses and individuals. Continued fiscal and monetary policies aimed at promoting economic growth and stability may positively impact investor sentiment and drive stock prices higher.
-Market Sentiment and Investor Confidence: Investor sentiment plays a crucial role in stock market performance. If there is a widespread positive outlook, increased investor confidence can fuel buying activity and push stock prices higher. Factors such as low interest rates, positive earnings reports, and positive macroeconomic indicators can contribute to a bullish sentiment.
-Long-Term Growth Potential: The stock market is driven by long-term expectations and the underlying growth potential of companies. If there is optimism regarding the future prospects of businesses, investors may be willing to pay higher prices for stocks, leading to new market highs.

Analysis for the Week of 6/17/2024I forgot to mention the economic calendar and earnings calendar in the video. Earnings are really light this week, but there's a decent amount of economic data coming out. We also have a short week with Wednesday being a holiday. Don't forget that, if you're buying options early in the week, theta decay will be worse than usual because the market is closed on Wednesday. I believe there will also be fed speakers commenting on last week's decision, so things could potentially be volatile by Thursday morning, but not really counting on it.
Other than that, I go over the major indexes and talk about everything I'm watching for the week.

#202425 - a weekly price action market recap and outlook - sp500Good Day and I hope you are well.
sp500 e-mini futures
Quote from last week:
bear case: Bears are still inside the bull flag and making lower lows. As long as they are staying below 5310-5320, their bear case lives on but is weak at best. They could not get consecutive daily closes below the daily ema and the reversal on Friday made the daily, weekly and monthly bar more buying than selling signals. You could argue that we are building a similar structure to April, where we had the double top and then only lower highs until bears finally accelerated it down big time and we got below 5000. Could this happen here too? Of course. We will find out on Monday or Tuesday.
comment: My take last week was, that as long as bears keep it below 5400, we could be in a trading range. Bulls used the pullback on Tuesday for a new ath and got a strong follow through on Wednesday to pulverize that previous ath and trade above 5500. That target price was my first measured move target from early 2024 and it could continue up to 5600. Market refused to print a bear bar on Thursday and Friday which leaves the market maximum bullish going into next week. The big issue with that long trade is, you are buying right under the ath in a buy climax, in multiple wedges, far far above any ema. This trade risk:reward equation is as bad as it gets but the probability is high. But what is your target? You can join momentum but all of my calculated targets end at around 5600. Buying pullbacks is the reasonable thing to do until it stops working. My final thoughts on the market this week is the following chart, which speaks for itself. This is peak bubble behavior and the next 1000-2000 Points will be made on the downside.
So given the current pattern of the s&p500 I do think we are in the last blow-off top of this bull cycle and will enter a trading range which will evolve into the new bear trend once we break below 5000. This market is made up of 7 stocks which get all the liquidity. My best guess on the path forward over the next months is in the weekly chart below.
We will probably spend more time between 5000 - 5600 to form a credible top. A head & shoulders top would be the most probable outcome.
current market cycle: Max bullishness & peak bubble territory again. Will end over the next weeks.
key levels: 5400 - 5600
bull case: Bulls buying it all on the 7 stocks. Volume on this up move since May is absolute atrocious but that does not help anyone so far. It’s only going up and as long as bulls keep making money literally buying every dip, we continue up. I have 3 wave series leading up to 5500-5600 and all end there.
Invalidation is below 5300.
bear case: What do the bears have going for them? Nothing and if anything, pure speculation and low probability stuff. The chart is showing multiple wedges, we are clearly in multiple third pushes up (W5) and volume is drying up. Once the institutions begin taking profits on the magnificent 7, we will see big moves down to end the trend and enter a trading range. The bull trend line around 5300 will be hit in the next 2-4 weeks and afterwards I think we will form a lower high before we will be on our way to 5000 again. As of now I think bears want to see a big climactic bull bar to 5600 before they begin shorting again.
Invalidation is above 5620.
outlook last week:
“Bullish above 5320 for another leg up to 5500 or higher but only if it happens until end of Tuesday.”
→ Last Sunday we traded 5355 and now we are at 5502. 5500 was my target if bulls trade above 5400 and I hope you made some of those 100 points. Good outlook it was.
short term: No interest in buying here unless it’s a momentum scalp. I will look for weakness and a trade back to a test of the daily 20ema which is around 5400. Bulls are still heavily favored in terms of probability.
medium-long term: Bull trend is in the last legs and this will soon pull back much further and form a big trading range. 5600 could be hit but the next bigger points are made trading back down to 5300 and 5000 over the next weeks/months.
current swing trade: None
Chart update: This is my best guess on how the next 3-9 months will play out. Two-legged correction down to 5000 over the next 4-8 weeks, followed by a last lower high before the next big bear trend will begin. That’s only price-wise but not time wise. Could get there much faster or much slower.

ES - Weekly Forecast - 17 June 2024I have a bullish bias on the ES (e-mini sp500) for the next few weeks ahead
Buy entries and targets are in the video

ES1! - TIME TO LOOK FOR SHORT ENTRIES OPPORTUNITIES - WEEKLYThank you for the likes, shares and follows. Really appreciate!
_________________________________________________________
This is a zoome out from the latest analysis of the ES1! Mini S&P500 Market.
A little bit adjusted with some interesting points to consider.
in the upper side we potentially won't be surprised in proach futrue see the price rising to $5637.5.
It is time probably to think at holding long short positions as there are some potential lower price point interesting to consider:
- The red horizontal line range area
- And lower there the blue dashed horizontal line
next week candle could probably do the same as this week but in the short side.
Where is the price going and what is the upper side limit? We don't know, we can only make some assumptions based on the technical analysis of the chart.
The issue is that we see that some historicl correlations are not being respected anymore.

BouncyBouncy is the way I would describe the price action in the S&P 500 on Friday. It implies a market that got low enough to find buyers and those buyers were willing to hold on to those positions going into the weekend, a sign of confidence. Monday the expectation would be an inside to higher move in the S&P 500.

algorithmic precision ESagain, again, again,.. Bullish bias = youre looking for a +ADR/AWR/AMR and target -ADR/AWR/AMR. today was again beautiful example.
Every day, every week and it won't stop

MES Futures 6/14 Ghost bar Expectations for Pull Back to 4700 Low volume, heavily divergent on weekly RSI and Volume Delta fading.
We could bubble. But I don't see that in the data. No excessive excitation. Just barely squeezing over and over on nothing. Rate Cut coming later in the year. TSLA has a gap at 75 bucks. Oh what a dip buy.
Would be a 3rd test of this formed channel since Oct 23. If we triple check the base and survive, my god what dreams may come.

$ES 5497.75This is the only level to watch. If the 15 closes above that; long.
Otherwise short risking a close above that

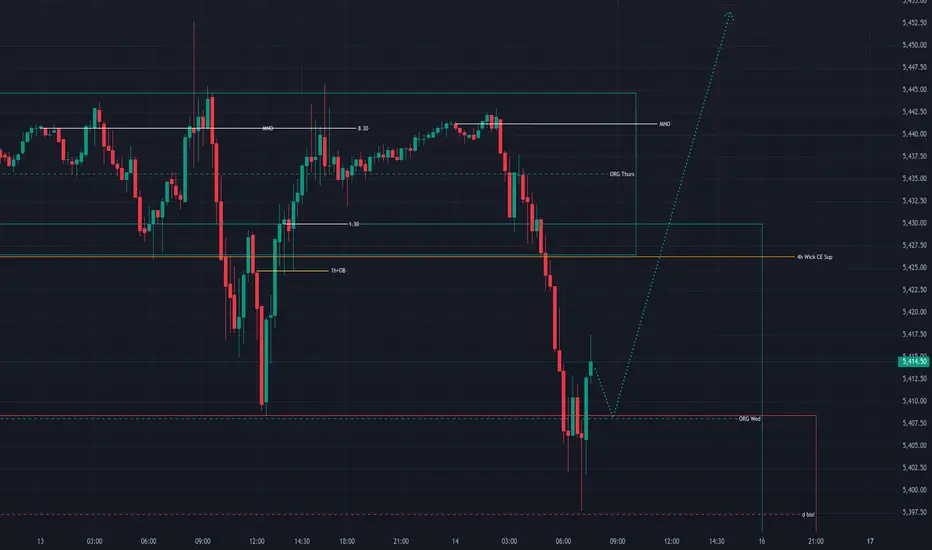
20240614 ESThere is the first +MSS after ss raid and reaction to the HTF PDA level (d bisi CE). => anticipate downside correction and displacement to the upside. Those close proximity highs are very attractive for the upside move and bs raid.
The HI news at 10am is the only thing that can make some unexpected change in this narrative with bullish BIAS.
It is possible to see the continuation of the upside move on the 10am HI news announcement. But some volatility influx is anticipated on this 10 HI new event.
$ES 8 tick scalp ideaEasy scalp idea;
Wait for 5503.75 then if needing to average down 5504.75. Go short here for an easy 8 tick bounce. On future funded accounts using 4 contracts you’ll make; $400 with 8 ticks.
