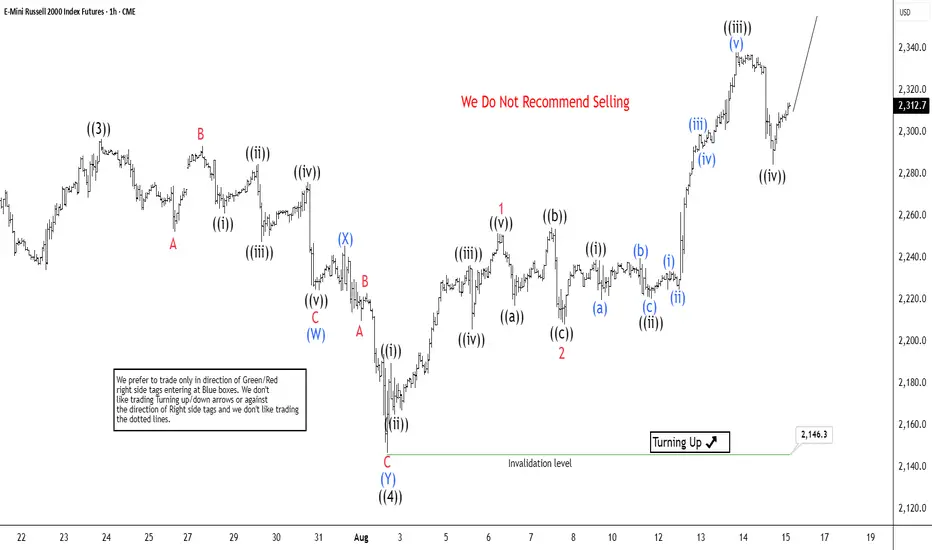
E-mini Russell 2000 Index Futures (RTY) Targets Wave 5 DiagonalThe short-term Elliott Wave analysis for E-Mini Russell 2000 Index Futures (RTY) indicates a rally from the August 1, 2025 low, unfolding as a diagonal pattern. Starting from that low, wave 1 peaked at 2338.1, followed by a wave 2 dip concluding at 2257.59. The Index then surged in wave 3, displayin
Micro E-mini Russell 2000 Index Futures (Dec 2021)
2,142.4USDD
−9.5−0.44%
At close at Dec 17, 2021, 14:28 GMT
USD
No trades
No news here
Looks like there's nothing to report right now


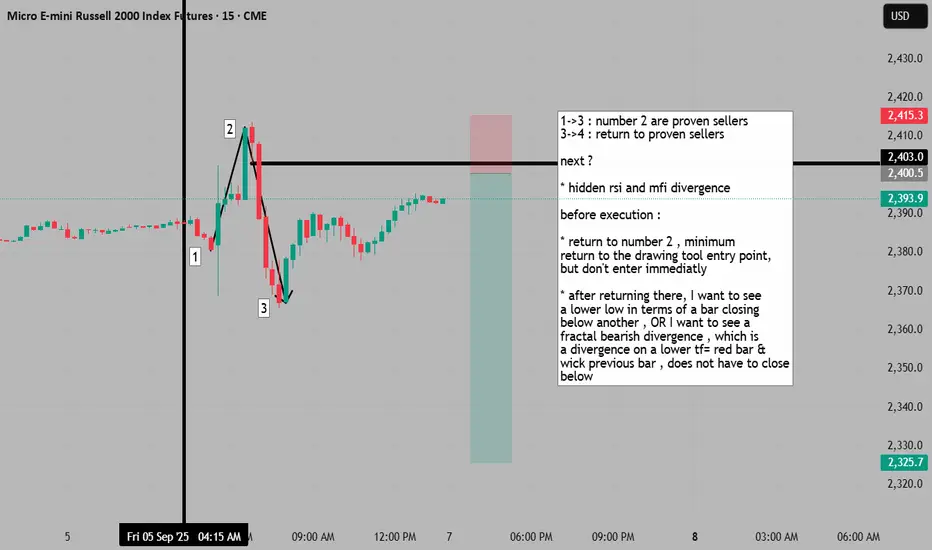
my setup and requirements before I short the market 1->3 : number 2 are proven sellers
3->4 : return to proven sellers
next ?
* hidden rsi and mfi divergence
before execution :
* return to number 2 , minimum
return to the drawing tool entry point,
but don't enter immediatly
* after returning there, I want to see
a lower low in terms of a
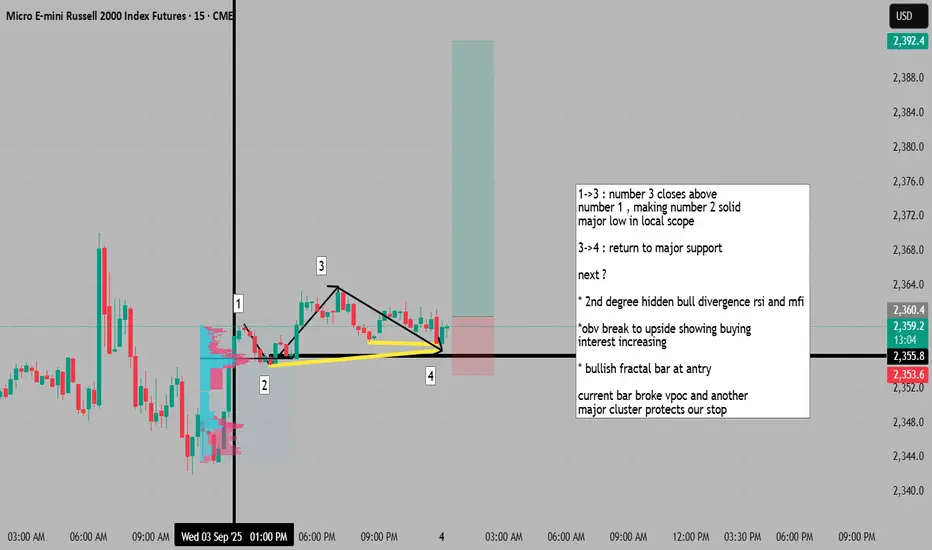
return to support provides entry at market edge 1->3 : number 3 closes above
number 1 , making number 2 solid
major low in local scope
3->4 : return to major support
next ?
* 2nd degree hidden bull divergence rsi and mfi
*obv break to upside showing buying
interest increasing
* bullish fractal bar at antry
current bar broke vpoc and


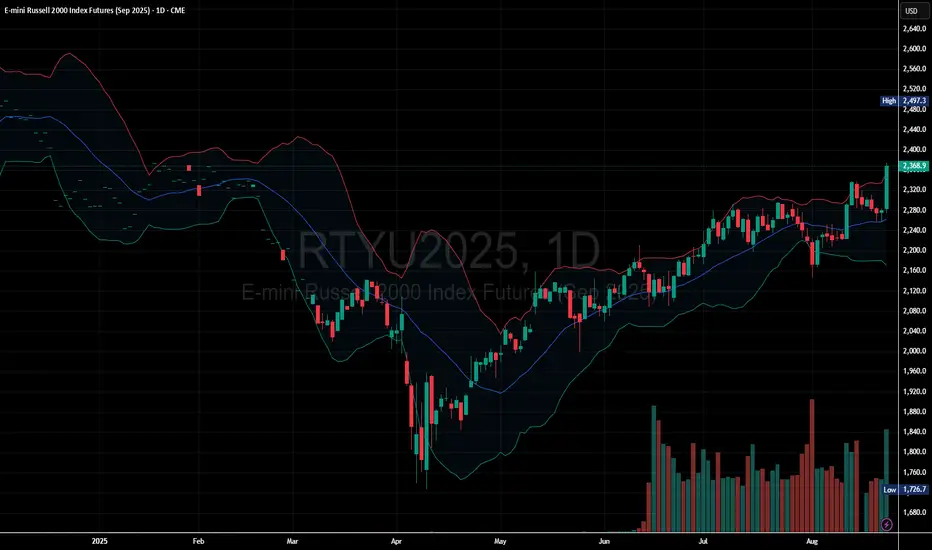
Russell 2000 Futures: Bullish Breakout in Play
Price is trading above the blue mid-band, confirming bullish momentum.
The slope of the mid-band is upward, further supporting the trend.
Uptrend intact, with bullish continuation.
Strong breakout candle above consolidation, supported by volume.
Bullish as long as price holds above 2,280 suppo
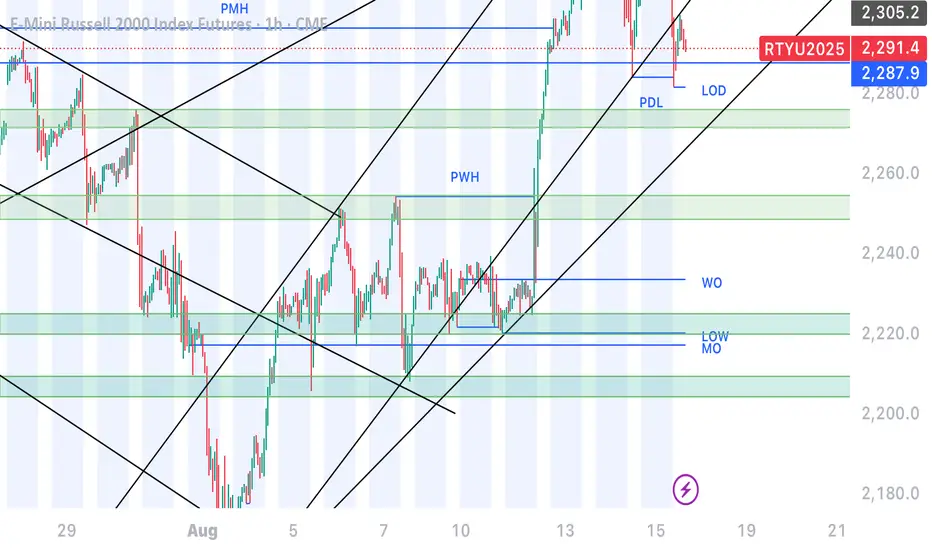
RTY - Potential bid and ask zones Potential Bid spots watching for upcoming week
#. 2280-2270 ( sweep of Friday low , Break & Retest of Previous High (30 july 25 ) , Trend line support)
#. 2255-2245 (Break and retest of previous week High )
#. 2225-2215 ( Low of week sweep , retest of the Breakout Move
Elliott Wave Outlook: Wave 5 in Russell (RTY) May Target 2386A bullish cycle, launched from the April 9, 2025 low, continues to develop as a five-wave impulse. Starting from that low, wave ((1)) peaked at 1948.6, followed by a wave ((2)) pullback to 1794.3. The Index then rallied in wave ((3)), reaching 2296.5. Wave ((4)) formed a double-three structure, with
See all ideas
A representation of what an asset is worth today and what the market thinks it will be worth in the future.
Displays a symbol's price movements over previous years to identify recurring trends.
M2KU2025
Sep 2025DMarket open
2,383.9USD−0.60%
M2KZ2025
Dec 2025DMarket open
2,401.5USD−0.60%
M2KH2026
Mar 2026DMarket open
2,421.0USD−0.49%
M2KM2026
Jun 2026DMarket open
2,451.0USD+0.16%
M2KU2026
Sep 2026DMarket open
2,469.4USD+0.17%
M2KZ2026
Dec 2026DMarket open
2,487.6USD
See all M2KZ2021 contracts
Frequently Asked Questions
The nearest expiration date for Micro E-mini Russell 2000 Index Futures (Dec 2021) is Dec 17, 2021.
Traders prefer to sell futures contracts when they've already made money on the investment, but still have plenty of time left before the expiration date. Thus, many consider it a good option to sell Micro E-mini Russell 2000 Index Futures (Dec 2021) before Dec 17, 2021.