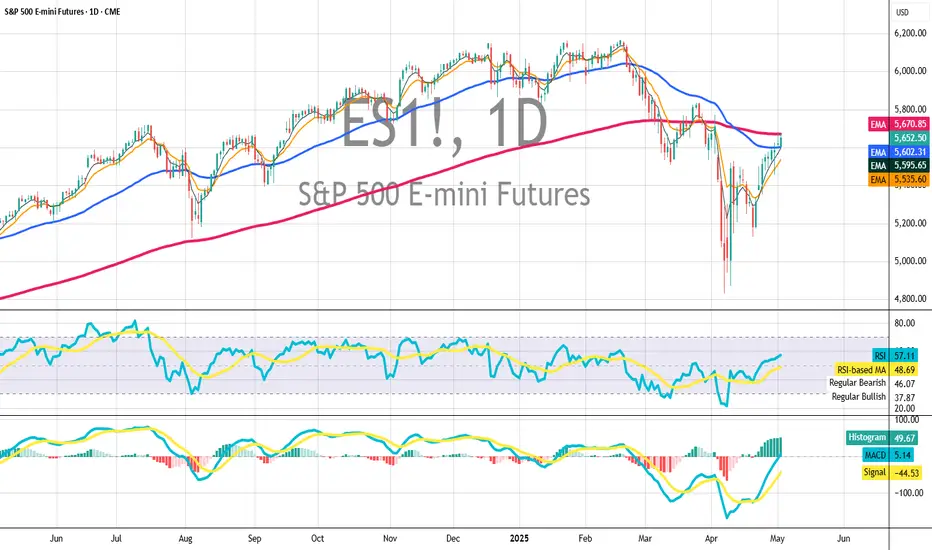
ES1! LongES1! is now net long on the regression break.
I ma considering my options this morning on the whole market.
MES1! trade ideas

Equity markets look bullishIf the weekly candle closes as it has started - or better - it's a crystal clear bullish reversal for the equity markets.

May 1st Trade Journal & Stock Market Analysis**May 1st Trade Journal & Stock Market Analysis**
EOD accountability report: +441
Sleep: 7 hour, Overall health: :thumbsup:
Signals were pretty solid today, but there's heavy MM manipulation in the market so be careful trading funded accounts.
Walk away if you get tilted.
**Daily Trade recap based on VX Algo System**
9:51 AM Market Structure flipped bullish on VX Algo X3!
10:30 AM Market Structure flipped bullish on VX Algo X3!
11:31 AM VXAlgo YM X1 Sell Signal
12:08 PM Market Structure flipped bearish on VX Algo X3!
1:47 PM Market Structure flipped bullish on VX Algo X3!
Next day plan--> Over 5600 = Bullish, Under 5600 = Bearish
Video Recaps -->https://www.tradingview.com/u/WallSt007/#published-charts


GoodInvestGroup_ES813 New Strategy 80% winrate high performanceGoodInvestGroup_ES813 is coded for NY session. High performance across 10 years of backtesting.
Performance Stats sample (1/1/2020<):
Win Rate: 88.20%
Loss Rate: 5.48%
% of Trades Stopped Out in Profit (Trailing Stops): 94.52%
% of Trades Hard Stopped at Loss (SL): 2.63%
Please do your own backtests and research.
Market conditions change which may lead to losses.
NOT a financial advice.

Most Unde-rated and Important Level of the week Previous Weekly Close level. Is a key level for the week for BIG trades whcich translate to big profits.
In the above video we will describe how to utilize and create a trade idea off this level.
This level will always give great risk /reward trade.
Dont fall asleep on this level.

OTEUM EXPERT CALL: SP500 – Pre‑FED Crumb‑ChaseOTEUM EXPERT CALL: SP500 – Pre‑FED Crumb‑Chase 🍞🚀
Market’s in grind‑up mode ahead of the FED 💹, squeezing what’s left toward those major swing targets & looming resistance walls 🧱. Only a few tasty crumbs remain on the upside—grab ‘em quick, trail tight, and don’t overstay the party 🎉⚠️.

ES (2025/05/06)In line with my previous analysis.
But at this moment, I am seeing trivial fluctuations so I do think there will be more up space in the near term. Target price is still quite far, and I am seeing strong volume when there are "Buying the dip" opportunity vs. very weak trivial volume when it comes to dumping.
Patiently waiting for TP to reach, so that I could close out some of the longs to realize.
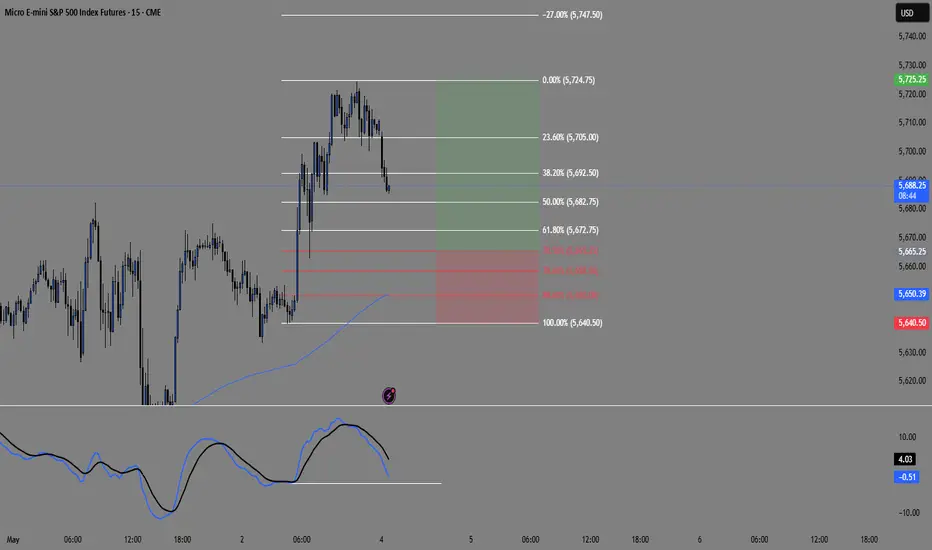
MES1!/ES1! Day Trade Plan for 05/06/2025MES1!/ES1! Day Trade Plan for 05/06/2025
📈 5625 5638 5650
📉 5614 5602 5590
Thanks to all my followers! Truly appreciate the support!
Please like and share for more ES/NQ levels Tues & Thurs 🤓📈📉🎯💰
*These levels are derived from comprehensive backtesting and research and a quantitative system demonstrating high accuracy. This statistical foundation suggests that price movements are likely to exceed initial estimates.*


May 2nd Trade Journal & Stock Market AnalysisEOD accountability report: +598.75
Sleep: 6 hour, Overall health: :thumbsup:
Another great day in the market, Signals worked decent.
Daily Trade recap based on VX Algo System
— 9:40 AM Market Structure flipped bearish on VX Algo X3!
— 11:10 AM VXAlgo ES X1 Sell Signal, (double sell)
— 2:53 PM VXAlgo ES X1 Sell Signal( double sell + x3 sells)
— 3:30 PM Market Structure flipped bearish on VX Algo X3!
Next day plan--> Over 5650 = Bullish, Under 5650 = Bearish
Video Recaps -->https://www.tradingview.com/u/WallSt007/#published-charts


ID: 2025 - 0095.5.2025
Trade #9 of 2025 executed.
Trade entry at 137 DTE (days to expiration).
Trade construct is a PDS (put debit spread) at Delta 15 combined with a PCS (put credit spread) at Delta 15. Overlapping short strikes give it the "unbalanced" butterfly nomenclature.
Sizing and strike selection is designed to keep the risk/reward "AT EXPIRATION" to a 1:1 risk profile. This lets charm work it's magic (second order greek), while exploiting the fact that this is a non-directional bias. The process is a disciplined and systematic approach letting time decay evaporate the extrinsic time value from the short options until target profit is achieved.
OF NOTE: This trade opened at EXCELLENT fills, and there is zero risk to the upside. The danger is of a catastrophic move to the downside, which will bring in phenomenal gains for ID 006 and 008. 😊
Happy Trading!
-kevin

OTEUM EXPERT CALL: SP500 – Catch-the-Bounce EditionOTEUM EXPERT CALL: SP500 – Catch-the-Bounce Edition 🪙🚀
We’re fishing LONG for a quick, tactical bounce LONG as price aims to poke into a major resistance zones ⚙️📈 Once the dust settles and the bounce plays out, we still expect the macro down-draft to take over, so keep your suitcase packed for a swift exit 🎢✂️.
Main risk? A stray White House tweet or (not so much) surprise policy grenade? 💬💥—impossible to time, so size down and run a tight leash on risk 🦺⚖️.
#SP500 #Dailymap #BouncePlay #RiskOn #OTEUM

S&P ES Long setup target 5963.50 / Calls SPY target 596Fibonacci technical analysis : S&P 500 E-mini Futures CME_MINI:ES1! has already found support at the Fib level 78.6% (5623.50) of my Down Fib. Last Daily candle (May 2) has closed above retracement Fib level 78.6%. My Down Fib guides me to look for CME_MINI:ES1! to eventually go up to hit first target at Fib level 127.2% (5963.50).
CME_MINI:ES1! – Target 1 at 127.2% (5963.50), Target 2 at 161.8% (6205.50) and Target 3 at 178.6 (6322.75)
Stop loss slightly below the 61.8% retracement Fib level (5506.25).
Option Traders : My AMEX:SPY chart Down Fib shows price to go up to Target 1 at 127.2% (595.82), Target 2 at 161.8% (620.50) and Target 3 at 178.6 (632.50)
Stop loss slightly below the 61.8% retracement Fib level (549).
Enjoy the trading process and take time to smell the roses🌹

S&P Futures monthly chart reviewH2 forming now should get triggered above 5777
Likely find resistance around 6000 and then an attept to go down
More likely sellers above and another leg sideways to down
The May bar right now is a bull bar, and likely to trigger the H1
but the last bar is a terrible buy signal.
The last bar is a non-overlapping BO & PB in the same bar
Remember that the monthly bars typically form their final shap
in the last week or so. Just like last month started as a huge
bear bar, it was very unlikely to extend or to finish as a big bear bar,
thei month's bar is unlikely to close as a strong bull bar.
That being said, bulls have good momentum in the lower time frames.
I think we go above high of prev month and test gap and overlap
and test the bearish Breakout beneath the bear doji, a terrible
sell signal. So llok for resistance around 6000 for sure.
The 5% pullback level will act as resistance as well.
Bars with big tails are typically followed by bars with tails in the
oppostie direction, which is what I expect for May.

SPY pump townAs the doomsayers are becoming quiet the market is realizing the economy isnt so crushed after all. Earnings speak for themselves here. MSFT, META, AMZN, and GOOGL all had amazing earnings despite tariff news and "declining GDP". GPD is a trash tier measure anyways. I have moved to much longer term trading and investing styles and have also been mostly selling options. I am new long here on QQQ and SPY related stocks.

How to Enter Trades the RIGHT Way!In this video, we're tackling an important question from our community member who's been crushing it in paper trading but faces the common challenge of entering trades blindly based on alerts, fearing they'll miss out otherwise.
We'll discuss:
Why blindly following signals can hurt your long-term success
The power of context in market structure: Why waiting for price to hit key support/resistance levels drastically improves your entries
A practical approach to manage FOMO: How scaling into trades can balance quick reaction times with better entries and tighter stops
Real examples of good vs. rushed entries, highlighting the impact on your risk-to-reward


This daily pattern can change your view on price!Dear Community,
How many patterns do you know?
<5?
<20?
>20?
How many of them actually work with GREAT accuracy?
Patterns are something that we often use in trying to predict the markets….BUT I dear to say pattern alone won’t work?
THE PATTERN NEED A FRAMEWORK!
let’s discuss this “pattern” highlighted on your screen.
Why is the candle after that “doji “ higher?
Often you try to “call tops” in the market place.
And after seeing this “doji”…. WE SELL RIGHT?
if the maker is going up why do we try and call a top?
Why do we try and not “follow the trend?”
On your daily chart examine this.
IF THE MARKET IF BULLISH AND I SEE A DOJI!
Study the candle that formed just after. YOU WILL BE AMAZED BY THE FINDINGS 😃.
No I will not share the stats. If an “homework” for your own development. Let’s discuss this further in the comments below.