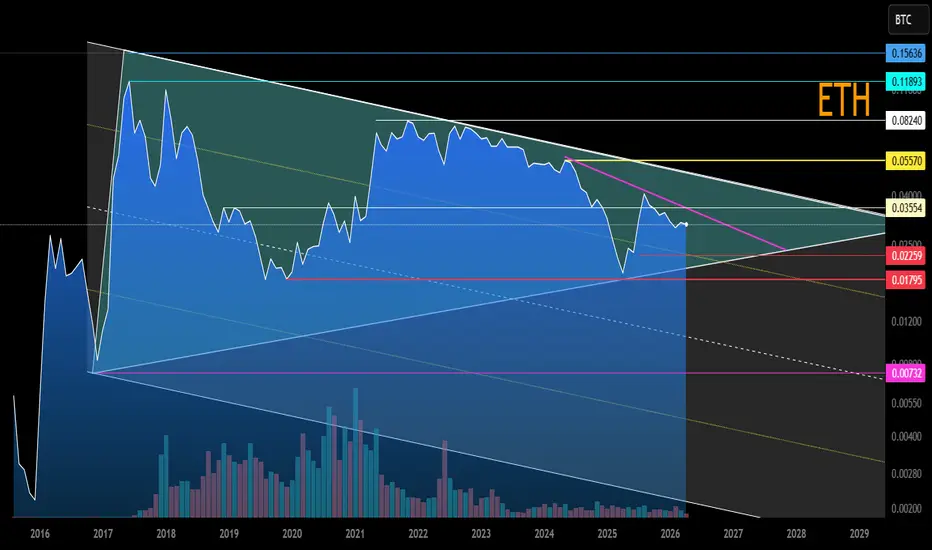
ETH btc - cycles of capital extractionETH btc - cycles of capital extraction
kinda clearish repeating waves here
always hard to tell if your in the last move of the macro downside or the second to last one. best to take your position and cut fast if proven wrong. least thats my latest overall strategy.
eth has been down/dormant for q
Related coins

ETH/BTC 4H📉 ETH/BTC 4H – Bearish Channel Breakdown Setup 🔻
🧠 Market Structure
Price previously moved inside a range zone → accumulation phase ✔️
Breakout from range failed to sustain → shift to bearish structure ❌
Currently trading inside a descending channel (bearish trend) 📉
📊 Key Levels
🔴 Resistance: ~0.03

ETHBTC — Institutional OB In Play. Watching for ETH Long TriggerETHBTC is pressing into a significant 10-hour Order Block that has been respected since February. Price broke structure to the upside in March, distributed across the premium, and has now retraced directly into the origin of that move.
What I'm watching:
The OB sits between approximately 0.0286 an

Chart Pattern Analysis Of ETH/BTC
I am expecting a doji candle of K4 close at high price area,
And then, the market try to break up the downtrend line at K5.
After K1 break down a larger scale triangle pattern,
The market seems failed to expand down.
It consolidate around the resistance.
It seems that K4 or K5 will choose to brea

ETH/BTC 4H📉 ETH/BTC 4H — Bearish Structure with Potential Reversal Zone ⚠️
🧠 Market Structure Overview
The chart shows a clear transition from consolidation to bearish continuation. Price initially ranged within a well-defined box, forming liquidity on both sides. After a Break of Structure (BOS) to the upsid

ETH/BTC Main Trend. Triangle. Reversal Zones. April 2026Logarithm. 1-month timeframe.
The entire ETH/BTC trend is shown to visualize the strength of Ethereum against Bitcoin.
A huge triangle has formed within the main trend.
The price is within the formation, currently forming a “Ross Hook” at the median, below the local descending trendline.
The key r
ROAD TO ALTSEASON: 9 YEARS BREAKOUT ! 9-YEAR MACRO RESISTANCE TEST & STRUCTURAL BREAKOUT THRESHOLD
Structure: 1-Week (1W) ETH/BTC relative strength chart.
1. 9-Year Macro Resistance: The primary black descending trendline, originating from the 2017 peak and suppressing every major market cycle, is currently being tested. This represe

Ethereum vs Bitcoin (ETHBTC): The Altcoins Market—A Bullish WaveGood afternoon my fellow Cryptocurrency trader, I hope you are having a very wonderful week and day.
I have a very nice chart for you and one that can put a smile on your face... If you're long Crypto, if you are a Crypto bull, if you've been buying in anticipation of growth. If you believe in Cryp

ETHBTC UPDATE (1D) TRIPLE ZIG-ZAG INCOMINGAfter finishing a five-wave impulsive move, an A-B-C correction has already occurred.
The problem is, it’s not going to be enough. Bitcoin dominance should rise at this point.
For this pair, vice versa.
Target is on the chart.
This pair is not for trading; it’s for understanding market dynamics.

Why ETH is dead — and will fall in the long termDuring the 2023–2025 cycle, Ethereum delivered one of the weakest performances among major assets
While the market was rallying, BINANCE:ETHUSDT only managed to briefly touch its previous all-time high
For a top 2 asset by market cap — that’s extremely bad result
At this point, it’s fair to s

See all ideas
Summarizing what the indicators are suggesting.
Oscillators
Neutral
SellBuy
Strong sellStrong buy
Strong sellSellNeutralBuyStrong buy
Oscillators
Neutral
SellBuy
Strong sellStrong buy
Strong sellSellNeutralBuyStrong buy
Summary
Neutral
SellBuy
Strong sellStrong buy
Strong sellSellNeutralBuyStrong buy
Summary
Neutral
SellBuy
Strong sellStrong buy
Strong sellSellNeutralBuyStrong buy
Summary
Neutral
SellBuy
Strong sellStrong buy
Strong sellSellNeutralBuyStrong buy
Moving Averages
Neutral
SellBuy
Strong sellStrong buy
Strong sellSellNeutralBuyStrong buy
Moving Averages
Neutral
SellBuy
Strong sellStrong buy
Strong sellSellNeutralBuyStrong buy
Displays a symbol's price movements over previous years to identify recurring trends.