ETHUSD trade ideas

ETHBTC May 28, 2024: A Bullish FlagAfter a 20% run up with the ETF approval on May 20, 2024, CRYPTO:ETHUSD started to form a bullish flag and moved out on May 28.
The flag is above the rising MA-10. The move out provides a buy point here ($3900) with the $4700 target

ETH GARTLEY 2500 INCOMINGHere is an epic "potential" eth Gartley. Aiming for a late June/July bottom

ETH IS IT POSSIBLE?I see lot of greeds around ETH, and i think we can see something similar as the BTC ETF event. A shakeout and a drop can likely happen, and it would be a gift if the price can drop till $3.300, a level that looks solid for a possible bounce. Main trend is bullish and actually there are no reason to look for a short

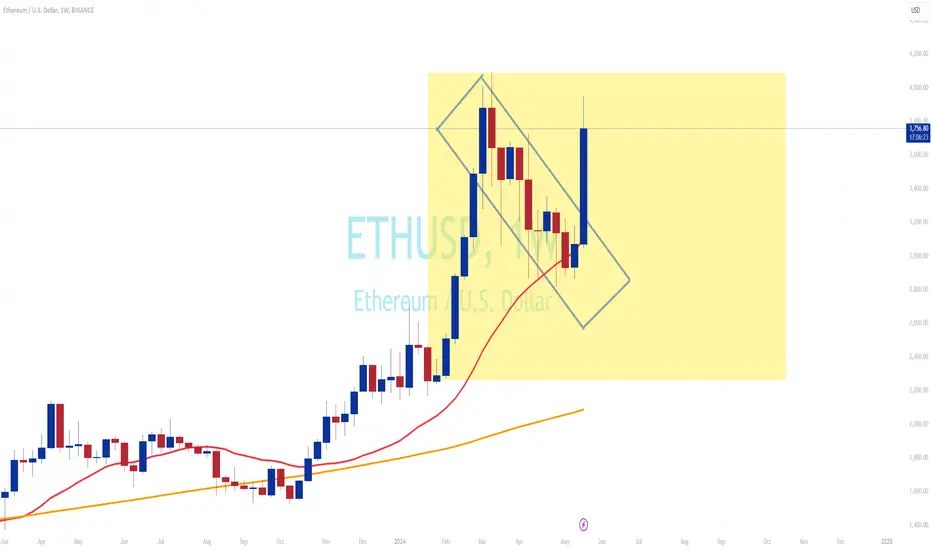
$ETH retest of low $2ks before higher?While Ethereum looks bullish over the longer term, price would need to break above the two lines of resistance for the chart to stay bullish.
If price rejects here, we risk a double top which would send price back to the low $2000s.
I'm leaning towards a rejection as the base case here as sentiment is pretty extreme to the bullish side.
Let's see what happens over the coming weeks.

ETH pullback? Eth appears to be at resistance and also I’m seeing some unusual amounts of eth being transferred to exchanges. Personally looking for price to move towards 2100-2500.
THIS IS NOT FINANCIAL ADVICE

ETHUSD Will Go Lower From Resistance! Sell!
Please, check our technical outlook for ETHUSD.
Time Frame: 1D
Current Trend: Bearish
Sentiment: Overbought (based on 7-period RSI)
Forecast: Bearish
The market is approaching a significant resistance area 3,752.5.
Due to the fact that we see a positive bearish reaction from the underlined area, I strongly believe that sellers will manage to push the price all the way down to 3,510.9 level.
P.S
Overbought describes a period of time where there has been a significant and consistent upward move in price over a period of time without much pullback.
Like and subscribe and comment my ideas if you enjoy them!

ETH weekly flag breakoutafter retrace for weeks. finally see a weekly bullish Price Action.
with flag formation BO price projection, next resistance at $5000.

4 hr macd is about to flip bullish pushing us past 4k 4 hr macd is about to flip bullish pushing us past 4k to a 4500k price target.
At a confirmation above 4100- 4250 and turning this zone to support with a major candle pull back above this zone we set up for a major cup and handle that takes us to 7k plus

Head & ShouldersA bearish pattern is forming!
If the candle 4h closes below the 3667 level, we could see a drop to the golden zone by Fibonacci Retracement .

$ETH Price Prediction 5/27/2024A bit of correction after price falls short of 4k.
Look to hold support above 3685/50EMA if we drop below 20EMA.
Further recovery is still expected which could begin at the start of next month.
www.tradingview.com

ETH whales low volume signal has appeared! WHALES LOW VOLUME now put into action. Next is to wait until ETH WHALES say they’re ready to plunge. Whales low volume means BULL is ready to BULL RUN. Next move is to wait.
Price target $3,900

Ethereum downside or breakout?Watching Ethereum (ETH) closely after it reached a high of $3,040 on a 4-hour timeframe chart today.
If support at $2,923 crumbles. A break below this level could send ETH down to $2,874.
However, there's also a chance for a breakout on the upside. If Ethereum can overcome resistance at $3,100, it could surge towards $3,160 or even $3,200.

ETH updateAt this moment and in given time frame Target is 4020.
Overall - All time High is on the way!
Good Luck!

$ETHUSD ETF ApprovalETH ETF is officially approved. Crowd gave it a 10% approval chance, before the filling updates got public for the VanEck deadline May 23rd. And now the crowd thinks it will have little to no inflow. Bullish.

If Ethereum Can't Break These Levels, Then....Traders,
I have a pretty good record for calling these inverse head and shoulders patterns before they are fully formed. I am not saying for sure Ethereum will form this inverse head and shoulders pattern but if it doesn't, then it will need to break above those resistance levels I have drawn and confirm. If it can't do this on the daily, then I have a hunch this inverse h&s will complete itself.
Ethereum leads the altcoin market rn. So, depending on where your bet lies, you may want to offset some risks and take profit here as we begin to consolidate/accumulate for another bull run.
Stew

Ethusd potential play Looking at a nice inner range short that you can take to capture the sell side liquidity or potential swing further down as the previous idea that I have posted
PAYtience pays
Set that alert
Be aware of post market spread at 4pm cst

💰ETHEREUM MID TERM TARGETS 🔷 Current Status- ETH is currently💰ETHEREUM MID TERM TARGETS 🔷
Current Status- ETH is currently building strong in symmetrical triangle which is a bullish pattern; BTC has given a new high in this bull cycle but ETH is still running behind.
Anticipated ETH to hit a new All Time High in upcoming weeks/months ✅
Once ETH reaches 5,000$ Key Resistance then money flow will move to Alts leading to a Healthy Alt Season which will run fot next months 🔥
We will see small alt season in upcoming months but a healthy alt season is only considered once BTC and ETH Dominance goes down; which will be happening thereafter.
Interpreted month for Healthy Alt Season ➡️September 2024

$ETH soon to come back from breakIt is just the beginning for ETHs run. The anticipation for an Ethereum ETF is starting to buzz around. We have hit the zone highlighted in my previous ETH drawing which consists of a channel and a weekly Ob-. As part of the order block theory composition, I have marked the 'mean threshold' of said Ob- as our next zone of interest. The current price action is drawing a descending wedge at a shallow retracement which says we are strongly bullish.

ETH flag breakoutafter retrace for 10 weeks, finally we see a bullish weekly candle on ETH, supported by 20 weeks MAs.
in this zone (in yellow) considered a FLAG formation . is a bullish continuation trend.
will see more upside once market break above $4000 mark.
Ethereum Price Yet to React to ETF ApprovalEthereum ETFs were approved partly due to Bitwise's correlation analysis, which has led to analysts expecting spot ETH ETFs to disappoint due to key metrics. The SEC approved 19b-4 spot ETH ETF filings on Thursday due to the high correlation between spot CRYPTOCAP:ETH price and CME Ethereum futures prices, similar to that of Bitcoin. This conclusion was reached through Bitwise's correlation analysis filed with its spot ETH ETF.
Bitwise is publishing a new correlation analysis as part of its new spot Ethereum ETF filing, which is the first ETH correlation analysis to replicate the specific methodology used by the SEC in their evaluation of bitcoin. The SEC's pace and breadth of first comments on S-1 filings are key to watch as they are the next key steps before a spot ETH ETF launch.
Scott Johnsson, a general partner at Van Buren Capital, mentioned that the SEC's pace and breadth of first comments on S-1 filings are key to watch as they are the next key steps before a spot ETH ETF launch. Eric Balchunas speculated that the SEC's comments may come in four to six weeks.
Crypto researcher Noelle Acheson suggests that spot ETH ETFs will meet a disappointing reception when they launch, as the CME's low interest in ETH derivatives — ranking fifth — suggests spot ETH ETFs may not be attractive. He also pointed to ETH accounting for only 15% of the total assets under management (AUM) of Hong Kong's spot crypto ETFs.
Technical Outlook
Ethereum ( CRYPTOCAP:ETH ) is currently trading around $3,740 after moving below the $3,730 price level. If a further decline occurs, the next level to watch out for is the $3,605 support. While prices have yet to react to the 19b-4 spot ETH ETF filings approval, the market may be awaiting the final approval of S-1 applications and the official launch before taking action. CRYPTOCAP:ETH has a positive Relative Strength Index (RSI) of 68.32 which is poise for further gains. CRYPTOCAP:ETH 's daily price chart correlates that of CRYPTOCAP:BTC with both assets depicting a bullish flag pattern in the near to long term respectively.


