$FORTH/#BTC [#Ampleforth Governance Token]: Resistance_Breakout◳◱ Hey traders, we've identified bullish signals on the $FORTH / $BTC chart through the detection of both a Bollinger Band breakout and a Resistance Breakout. The Bollinger Band indicates a potential bullish trend as the price has moved outside of the upper band, while the Resistance Breakout confir
Key data points
No news here
Looks like there's nothing to report right now

$FORTH/#BTC [#Ampleforth Governance Token]: Failure_SwingWe've detected a Failure Swing pattern on the $FORTH / $BTC chart. This pattern is a bullish indication and could indicate a potential trend reversal. The next resistance key levels are at 0.0002117 | 0.00025 | 0.0003161 and the major support zones are respectively at 0.0001456 | 0.0001178 | 0.0000


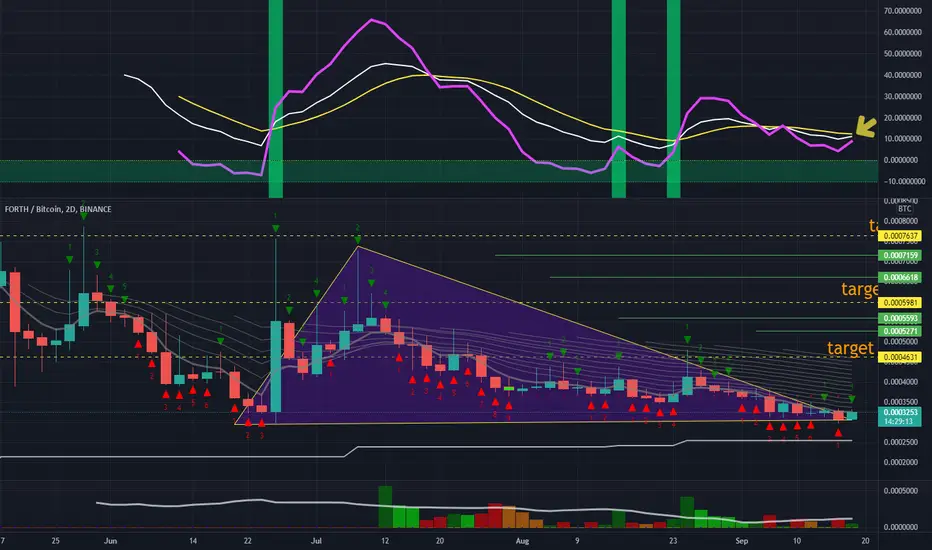
Trading 101 | How To Be A Successful Trader In 300Words +3 StepsWe have a massive bullish breakout from a falling wedge for the FORTHBTC pair.
This is a strong one.
Green by 150% in 2 days... Yes, the Altcoins are going bullish or at least getting started as I warned just days ago.
This is not over.
This is not all.
We are not there yet.
There can be strong


FORTHBTC is testing an important resistance 🦐FORTHBTC is testing an important resistance. IF the price will have a breakout and retest the current resistance as new support, According to Plancton's strategy (check our Academy), we can set a nice order
–––––
Follow the Shrimp 🦐
Keep in mind.
🟣 Purple structure -> Monthly structure.
🔴 Red


See all ideas
Summarizing what the indicators are suggesting.
Oscillators
Neutral
SellBuy
Strong sellStrong buy
Strong sellSellNeutralBuyStrong buy
Oscillators
Neutral
SellBuy
Strong sellStrong buy
Strong sellSellNeutralBuyStrong buy
Summary
Neutral
SellBuy
Strong sellStrong buy
Strong sellSellNeutralBuyStrong buy
Summary
Neutral
SellBuy
Strong sellStrong buy
Strong sellSellNeutralBuyStrong buy
Summary
Neutral
SellBuy
Strong sellStrong buy
Strong sellSellNeutralBuyStrong buy
Moving Averages
Neutral
SellBuy
Strong sellStrong buy
Strong sellSellNeutralBuyStrong buy
Moving Averages
Neutral
SellBuy
Strong sellStrong buy
Strong sellSellNeutralBuyStrong buy
Displays a symbol's price movements over previous years to identify recurring trends.