Sainsbury: Time to Watch: UKHappy New Year
By Sun Storm Investment Research
A Profit & Solutions Strategy
Disclaimer: I am not a financial advisor, so please do your own research before trading anything
Next report date
—
Report period
—
EPS estimate
—
Revenue estimate
—
0.068EUR
160.06 MEUR
38.18 BEUR
1.65 B
About SAINSBURY(J) ORD GBP0.28571428
Sector
Industry
CEO
Simon John Roberts
Website
Headquarters
London
Founded
1869
ISIN
GB00B019KW72
FIGI
BBG000BY1G05
J Sainsbury Plc engages in the retailing, financial services, and property investment businesses. It operates through the following segments: Retail-Food, Retail-General Merchandise and Clothing, and Financial Services. The Retail segment distributes food, general merchandise, and clothing. The Financial Services segment includes Sainsbury's Bank Plc and Argos Financial Services entities. The company was founded by John James Sainsbury and Mary Ann Sainsbury in 1869 and is headquartered in London, the United Kingdom.

Sainsbury £200 to £300 playStock should be trading around £300 / + 150% in 18 months. Not a bad trade for investors looking to play it safe in the face of an 'alleged recession' being in the post. The stock has been trading inside this descending triangle for years and just confirmed support on the bottom.
The monthly chart


Sainsbury's snap election tradeWith Snap election on December 12, Sainsbury's offers great opportunity. As the company gets all of it profit in UK, it is very exposed to the election results.
Since Conservative win is considered good for Brexit progress, UK stocks expected to rise on it. Results will be released around 2am on Fri

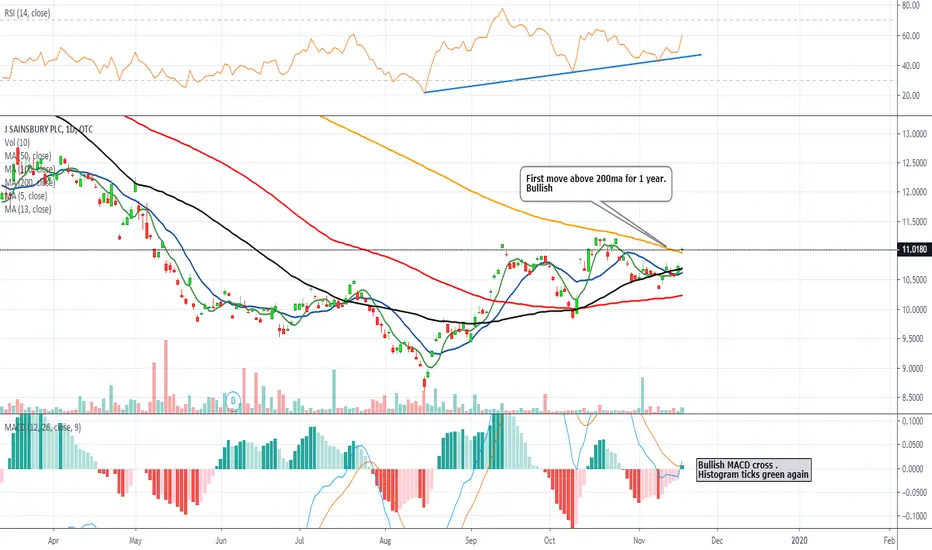
$JSAIY bullish move above 200ma J Sainsbury Plc engages in the retailing, financial services, and property investment businesses. It operates through the following segments: Retail-Food, Retail-General Merchandising and Clothing, Financial Services and Property Investments. The Retail segment distributes food, general merchandise,
J Sainsburys - LONGPotentially oversold? Towards bottom of wedge - could retrace a bit, giving decent R/R.
Wait for confirmation - consolidating on the Daily TF.


Sainbury's opportunityAfter being denied a chance to merge with Asda, shares of Sainbury's suffered another hit and tested the all time lows from June 2016. Now a perfect chance to get in with buyers or see if the level breaks in an impulsive move and sell.


See all ideas
Trade directly on the supercharts through our supported, fully-verified and user-reviewed brokers.


Curated watchlists where SUY1 is featured.


Frequently Asked Questions
The current price of SUY1 is 3.256 EUR — it has decreased by 1.81% in the past 24 hours. Watch SAINSBURY-J.- LS-28571428 stock price performance more closely on the chart.
Depending on the exchange, the stock ticker may vary. For instance, on FWB exchange SAINSBURY-J.- LS-28571428 stocks are traded under the ticker SUY1.
SUY1 stock has fallen by 1.21% compared to the previous week, the month change is a 9.63% rise, over the last year SAINSBURY-J.- LS-28571428 has showed a 3.50% increase.
We've gathered analysts' opinions on SAINSBURY-J.- LS-28571428 future price: according to them, SUY1 price has a max estimate of 4.19 EUR and a min estimate of 2.79 EUR. Watch SUY1 chart and read a more detailed SAINSBURY-J.- LS-28571428 stock forecast: see what analysts think of SAINSBURY-J.- LS-28571428 and suggest that you do with its stocks.
SUY1 reached its all-time high on Jul 25, 2007 with the price of 9.030 EUR, and its all-time low was 1.920 EUR and was reached on Oct 7, 2022. View more price dynamics on SUY1 chart.
See other stocks reaching their highest and lowest prices.
See other stocks reaching their highest and lowest prices.
SUY1 stock is 1.84% volatile and has beta coefficient of 1.01. Track SAINSBURY-J.- LS-28571428 stock price on the chart and check out the list of the most volatile stocks — is SAINSBURY-J.- LS-28571428 there?
Today SAINSBURY-J.- LS-28571428 has the market capitalization of 7.61 B, it has increased by 0.63% over the last week.
Yes, you can track SAINSBURY-J.- LS-28571428 financials in yearly and quarterly reports right on TradingView.
SAINSBURY-J.- LS-28571428 is going to release the next earnings report on Nov 7, 2024. Keep track of upcoming events with our Earnings Calendar.
SUY1 earnings for the last quarter are 0.13 EUR per share, whereas the estimation was 0.12 EUR resulting in a 7.23% surprise. The estimated earnings for the next quarter are 0.13 EUR per share. See more details about SAINSBURY-J.- LS-28571428 earnings.
SAINSBURY-J.- LS-28571428 revenue for the last quarter amounts to 18.41 B EUR despite the estimated figure of 18.23 B EUR. In the next quarter revenue is expected to reach 20.69 B EUR.
SUY1 net income for the last quarter is −21.03 M EUR, while the quarter before that showed 178.84 M EUR of net income which accounts for −111.76% change. Track more SAINSBURY-J.- LS-28571428 financial stats to get the full picture.
SAINSBURY-J.- LS-28571428 dividend yield was 5.25% in 2023, and payout ratio reached 223.17%. The year before the numbers were 4.95% and 146.37% correspondingly. See high-dividend stocks and find more opportunities for your portfolio.
EBITDA measures a company's operating performance, its growth signifies an improvement in the efficiency of a company. SAINSBURY-J.- LS-28571428 EBITDA is 2.39 B EUR, and current EBITDA margin is 6.25%. See more stats in SAINSBURY-J.- LS-28571428 financial statements.
Like other stocks, SUY1 shares are traded on stock exchanges, e.g. Nasdaq, Nyse, Euronext, and the easiest way to buy them is through an online stock broker. To do this, you need to open an account and follow a broker's procedures, then start trading. You can trade SAINSBURY-J.- LS-28571428 stock right from TradingView charts — choose your broker and connect to your account.
Investing in stocks requires a comprehensive research: you should carefully study all the available data, e.g. company's financials, related news, and its technical analysis. So SAINSBURY-J.- LS-28571428 technincal analysis shows the buy rating today, and its 1 week rating is buy. Since market conditions are prone to changes, it's worth looking a bit further into the future — according to the 1 month rating SAINSBURY-J.- LS-28571428 stock shows the buy signal. See more of SAINSBURY-J.- LS-28571428 technicals for a more comprehensive analysis.
If you're still not sure, try looking for inspiration in our curated watchlists.
If you're still not sure, try looking for inspiration in our curated watchlists.