Trading Signal for GLMBTC - Sell OpportunityDear Traders,
We have identified a promising opportunity in the GLMBTC currency pair based on our analysis using the EASY Quantum Ai strategy. Below are the details of the trade signal:
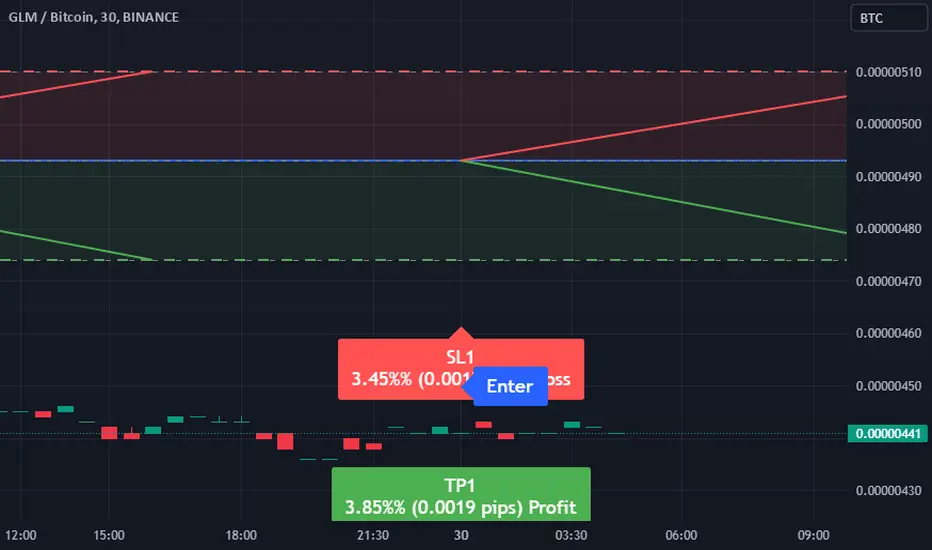
Direction: Sell
Enter Price: 4.93E-06
Take Profit: 4.74E-06
Stop Loss: 5.1E-06
Our projection suggests a downward movement in the price. The primary factors influencing this decision are:
1. Market Momentum: Recent trends indicate a weakening momentum for GLM against BTC, signaling a potential decline in value.
2. Technical Indicators: Observations show bearish patterns forming in key technical indicators, such as Moving Averages and RSI, suggesting a possible price correction.
3. Market Sentiment: There has been a noticeable shift in investor sentiment, with increased volume in sell orders, which could further drive the price down.
4. Volatility Analysis: Current volatility levels present a calculated risk, aligning with our target profit and stop-loss levels.
This prediction aims to help you maximize your trading strategy with calculated precision. Please ensure proper risk management when executing the trade.
Happy Trading!
Disclaimer: This signal is generated for informational purposes only, based on the EASY Quantum Ai strategy, and does not constitute financial advice. Always conduct your own research before making trading decisions.
GLMBTC trade ideas
✳️ Golem | Multiple Bottom Signals (20% Risk vs 300% Growth Pot)Hello once more my dear supporter, let's review another chart together... We do this for learning just as we do it to spot trading opportunities. Good looking charts with nice growth potential. "High probability chart setups."
This time we are looking at Golem (GLMBTC).
I like the BTC pairings for many reasons but we will look at those in a different post.
Let's look at the price action up close:
➖ There's a low 9-January.
➖ GLMBTC moves below this low on multiple bearish candles.
➖ Current action is now back above this level and this becomes a bullish signal.
➖ This bullish signal we consider strong because of the rising volume, strong RSI and six consecutive days GLMBTC closing green.
➖ We also have a V shaped bottom pattern.
➖ Yesterday's session hit the lowest point but ended green. Another major bullish signal.
All these are pointing up.
When combined, they give out a really strong bullish bias.
When prices move above EMA50; 0.00000494, another strong bullish signal is confirmed.
So this is a good set up to go "long," or buy and hold.
You cannot go wrong with less than 20% risk and more than 300% potential for growth.
Multiple "trades" like this one and success is guaranteed long-term.
This is not financial advice.
Feel free to do your own research before trading.
This information is shared for learning purposes.
Namaste.

Golem (GLM) forming bullish Gartley for upto 14% pumpHi dear friends, hope you are well and welcome to the new trade setup of Golem ( GLM ) token with BTC pair.
Previously we had a nice trade of GLM:
Now on a 4-hr time frame, GLM is about to complete a bullish Gartley pattern.
Note: Above idea is for educational purpose only. It is advised to diversify and strictly follow the stop loss, and don't get stuck with trade


Golem GLM - 2000% gains, hidden GEM!
GLM has been consolidating since 2019 with sideways price action, and it looks like we can experience an explosive move in the immediate short term!
On the weekly chart, we have an ascending triangle and a falling wedge. Both these patterns are generally bullish.
The price is now above the 200 weekly moving average. This MA is considered a strong level by huge institutions and hedge funds.
Golem is listed on all major exchanges, so pretty much everyone can buy it.
This altcoin can explode at any time, and it usually happens very quickly!
The altseason is in progress and you can check out my idea about BTC.D in the related section down below.
For more ideas, please hit "Like" and "Follow"!

#GLM/BTC - Short - Potential 19.67%#GLM/BTC - Short - Potential 19.67%
Exchanges: Huobi.pro, Binance, Bittrex
Signal Type: Regular (Short)
Entry Targets:
1) 1065 - 100.0%
Take-Profit Targets:
1) 1041 - 33.334%
2) 0964 - 33.333%
3) 0856 - 33.333%
Stop Targets:
1) 1124 - 100.0%
Entry Trigger - Pullback with BTC breaking overhead resistance
Trailing Configuration:
Take-Profit: Percentage (1.0%)
Stop: Breakeven -
Trigger: Target (1)

Golem GLMBTC - Huge ascending triangle! + Breakout soon- On the weekly chart we can see an ascending triangle - the most bullish pattern!
- Great opportunity to 24x your capital in upcoming weeks/months.
- If we take a look at the volume indicator - bullish volume is definitely higher, which is great.
- The price is now above the 200 weekly moving average. This MA is considered as a strong support by huge institutions.
- Look at my ideas about another interesting altcoins in the related section down below ↓
- For more ideas please hit "Like" & "Follow"!


Golem (GLM) "Small" Bullish Breakout, Grows Over 65% TodayWe have one of the first ALTSBTC pair, GLMBTC, breaking out bullish today with 65%+ since yesterday's low.
We have a very big falling wedge pattern;
High volume and break above all EMAs.
Get ready... What one altcoins does, so follows the rest.
Namaste.

Golem (GLM) completed bullish BAT for upto 33.5% rallyHi dear friends, hope you are well and welcome to the new update on Golem (GLM) token.
On a 2-day time period chart, the GLM has formed a bullish BAT.
Buying and sell targets:
Buy between: 0.00000779 to 0.00000743 btc
Sell between: 0.00000864 to 0.00000992 btc
Stop loss:
The maximum extent of buying zone can be used as stop loss, that is 0.00000743 btc.
Possible profit and loss ratio:
As per the above targets, this trade has a big profit possibility of 33.5% and the big loss possibility is 5%.
Note: Above idea is for educational purpose only. It is advised to diversify and strictly follow the stop loss, and don't get stuck with trade

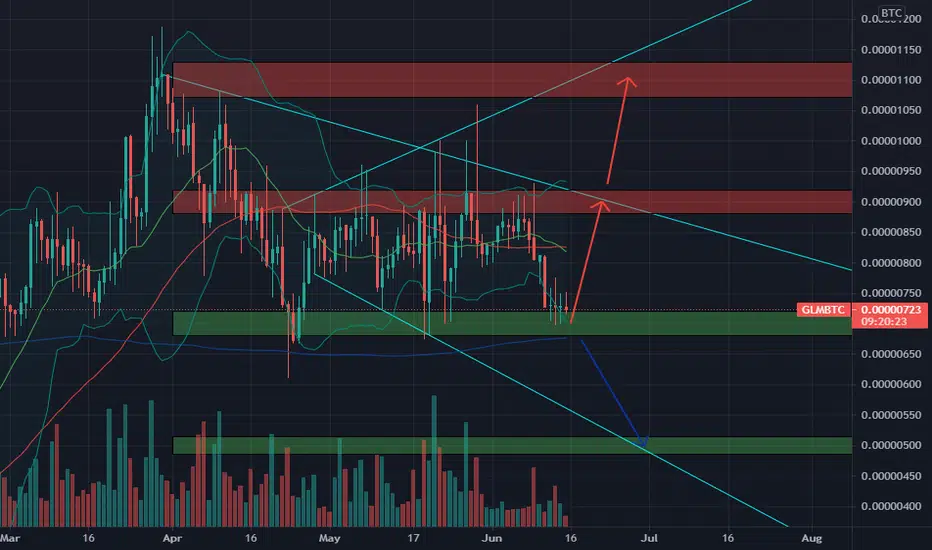
🆓Golem (GLM) June-15 #GLM $GLMCurrently the 700sts zone has not been broken and the 700sts zone is still the area that has continuously generated the rally of GLM since March so we can continue to believe it until it is broken. If it is not broken, then GLM will rise back to the 900sts and 1100sts zones in late June and absolutely can increase stronger and create a new ATH
📈BUY
🔴Buy : 680-720sts. SL if B
📉SELL
🔴Sell : 880-920sts. SL if A
🔴Sell : 1070-1130sts. SL if A
♻️BACK-UP
🔵Sell : 680-720sts if B. SL if A
🔵Buy : 485-515sts if A. SL if B
❓Details
🕯Timeframe : 1 Day
📈Red Arrow : Main Direction as BUY and SELL section
📉Blue Arrow : Back-Up Direction as BACK-UP section
🟩Green zone : Support zone as BUY section
🟥Red zone : Resistance zone as SELL section
🅰️A : The Close price of candlestick is Above the zone
🅱️B : The Close price of candlestick is Below the zone
GLMBTC waiting for the breakout 🦐GLMBTC waiting for the breakout from the huge triangle. IF the price will have a breakout from it with volumes and if the price will flip the current resistance into new support, According to Plancton's strategy (check our Academy), we can set a nice order
–––––
Follow the Shrimp 🦐
Keep in mind.
🟣 Purple structure -> Monthly structure.
🔴 Red structure -> Weekly structure.
🔵 Blue structure -> Daily structure.
🟡 Yellow structure -> 4h structure.
⚫️ Black structure -> <4h structure.
Here is the Plancton0618 technical analysis, please comment below if you have any question.
The ENTRY in the market will be taken only if the condition of the Plancton0618 strategy will trigger.


GLM - LONG - much upsideThis decentralized supercomputer
Golem (GLM) is looking to flip resistance into support. Looking like they can't wait one more second to take off.
Chance it is going to move over the weekend or by early next week!
Position
🔘 5% of Portfolio
Potential RLZ range:
🔘 L: 612
🔘 H: 829
Stop-Loss:
🔘 ~ 551
Potential reversal zone (PRZ):
🔘 L: 5764
🔘 H: 10509
Profit Targets
🔘Target 1 - 1586 (10% TP)
🔘Target 2 - 1898 (15% TP)
🔘Target 3 - 2894 (15% TP)
🔘Target 4 - 4445 (15% TP)
🔘Target 5 - 7997(10% TP)
🔘Target 6 - 10400 (10% TP)


GLM - Squeeze ComingI'm not playing on this as it is too risky in the state of the market, but I'm curious where GLM/BTC is going to go from here. Right now it looks like we are getting to the end of a bull pennant and the candles are getting smaller and smaller. Additionally the BB's are getting really tight and the MACD is flipping bullish. I think it will make another move, but I am worried of BTC wrecking alts with another big move this weekend.

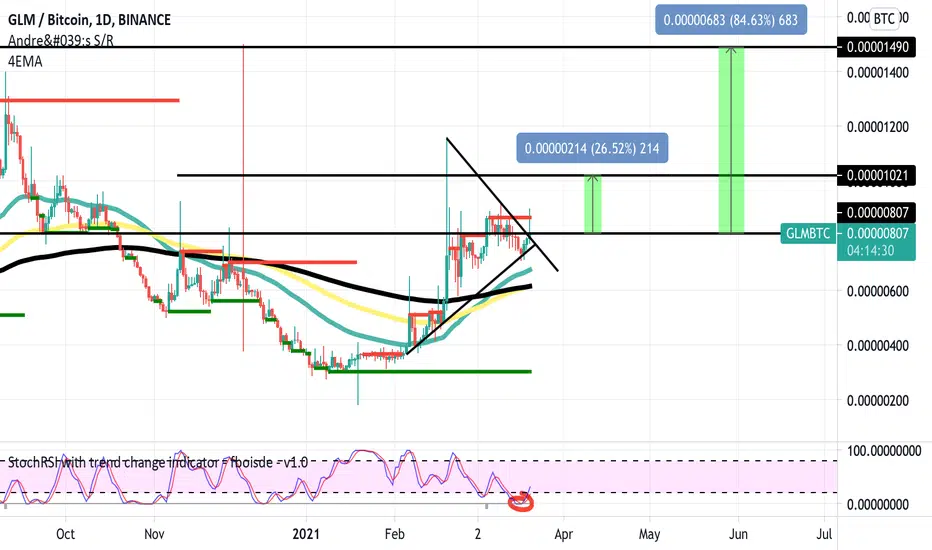
GLM / BTCIt appears as though an inverse head and shoulders have formed on Golem here against the Bitcoin pairing. The Golem team have successfully completed the move to their own side chain, they also changed their ticker from GNT to GLM, which is why there is no forecasts on Tradingview. Progress is being made from within Golem and I like putting my efforts (and bitcoin) into teams that continue building and moving forward.
Aiming for the 2 targets mentioned in the graphic
