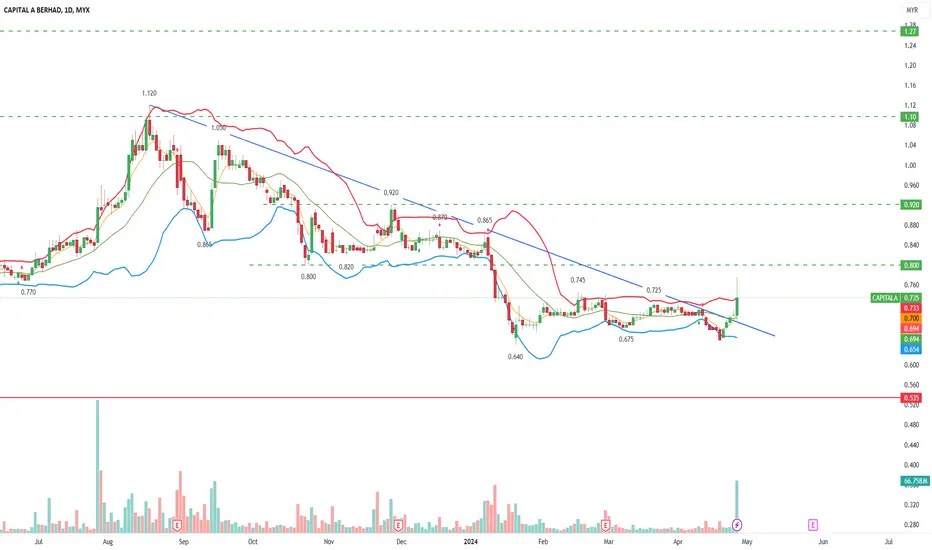
CAPITALA, potential reversal trend amid positive catalyst
- Increased volume: Activity is picking up, suggesting growing interest and potential momentum.
- Mid- to long-term still downtrend, but trader can limit risk at stop level
CAPITALA trade ideas

Capital A Historical Stock Price MovementKey Events and Their Impacts:
1. GMT Research Report - 10th June 2015: This event is marked with a blue arrow pointing downwards, indicating a further dampening impact on the stock price. The research reports, as described, typically contain analyses that can either affirm or question a company's financial health, practices, or prospects, influencing investor sentiment and stock price movements.
2. First COVID-19 Case Reported in Wuhan - December 2019: The stock seems to have had minimal immediate response to this early-stage pandemic event. However, subsequent global spread and lockdowns severely affected markets, including Capital A.
3. First COVID-19 Case Reported in Malaysia - January 2020: As the pandemic neared Malaysia, it likely contributed to increased market volatility and investor concern, reflected in the downward trend following this period.
4. First MCO (Movement Control Order) Lockdown in Malaysia - 18th March 2020: This event is marked by a significant drop in the stock price, represented by a blue arrow. Lockdowns would have led to a halt or severe reduction in business activities, particularly affecting companies with significant operational dependencies in affected areas.
5. Declared a PN17 Company - July 2020: Being declared a PN17 company indicates that the firm faces financial distress or fails to meet certain regulatory conditions of the Malaysian stock exchange. This event typically leads to a negative perception of the company’s financial health and prospects, which is reflected in the sharp decline in stock price around this time.
Overall Stock Price Trend:
• 2005-2010: The stock price appears relatively stable with some fluctuations but no significant long-term upward or downward trends.
• 2010-2015: There is a gradual increase in stock price, peaking around 2015. This period could suggest a phase of growth or positive market conditions for Capital A.
• Post-2015: After the peak, the stock price shows a volatile but overall downward trend. The events marked from 2015 onwards, including the GMT Research Report and financial distress status, suggest that the company may have faced operational, financial, or market challenges leading to a loss of investor confidence.
Capital A Berhad's stock price performance over the years indicates a company that has experienced both growth phases and significant challenges. The key events annotated on the chart have had considerable impacts, particularly the financial distress declaration in 2020 following the COVID-19 pandemic’s onset and associated economic disruptions. Future prospects would depend heavily on the company's ability to manage its current financial health issues, navigate market conditions, and restore investor confidence.

CAPITAL AJust breakout a big downtrend , last week seeing a volume coming in
Can make as a watchlist , and I'm optimist it will continue going up
Time Cycle Analysis: CapitlaACapital A, above 0.88 is bullish, below 0.88 is bearish. Key date to watch, total solar eclipse on April 8, 2024 will cross North America, passing over Mexico, the United States, and Canada.

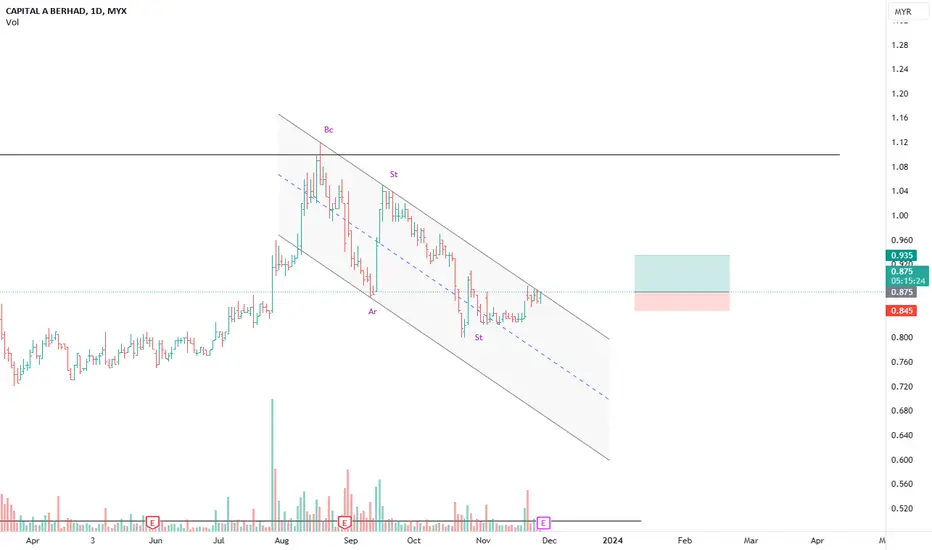
CAPITAL A SHORT TERM LONG POSITIONbased on pure wyckoff point of view, price looks like entering JAC Phase D soon
in view of that, i initiated a position today :
entry -0.875
cut loss -0.845
take profit-0.935
CAPITALA VCP SetupCAPITALA got a 3 months base VCP setup with below contraction:
C1: -16%
C2: -10%
C3: -7%
C4: -4%
Price breakout C2, C3 and C4. Let's see if got momentum to breakout C1 or not. If yes, then everyone can fly.
Remember set your support and don't chase high.
Disclaimer:
Information presented here is not intended to be used as the sole basis of any investment decisions nor should it be construed as advice designed to meet the investment need of any investor. Trade at your own risk.

Capital A formed M patternCapital A formed M pattern and completed the pullback, and most probably it will reach this level 0.710 - 0.720. If it bounces back above 0.730 then we can see an uptrend as the bounces happens at the trend line. If the bounce happens as expected then we can see it is making HH & HL.

Capitala/airasia probably found its long term base. 17/March/23Capitala formerly known as AirAsia probably “found” its long term “base” @ long term trend line and demand zone.


Capital A PredictionCapital A if rebound from 0.665 - 0.675 then might see uptrend continuous else the support will be 0.64 +/- 0.005, if it is break below then continue to drop


CapitalA, will rebound again after hitting the trendline?will the trendline acting as a strong support again?

OUTLOOK 29/04/2022CAPITAL BHD
After a long sideways movement a big move is expected.the market was moving between 0.680-0.720.
a buy from the current Market Price is suggested with a target of 0.760. .
Support:-0.720, 0.695.
Resistance:- 0.760.
The Relative Strength Index (RSI) is at 73.53

CapitalA (airasia). Updated. 1/April/22CapitalA (formerly know as AirAsia) let everyone can “fly/fry” “again!”.. We probably just need to “tightening up” our “tummy” for few more months “saving more fuels” before “taking off” to the moon!!

CAPITALA Analysis(30 MARCH 2022)-In my opinion,the current price will rejected around 0.765 - 0.800 ''Expectation 1".
-If the price make a rejection,then it will be retrace around 0.690.
-Price action visible at 4H chart,Maybe the price will make a rejection at 0.765 - 0.800 based on price action.
(Sorry my english bad.)
Have a nice day everyone and stay safe!
Disclaimers:-
I AM NOT A FINANCIAL ADVISOR,EVERYTHING I SHARE IS JUST MY OPINION.


AirAsia Bhd (5099)MYX:5099
Recently, AAGB has gap up due to the announcement of RM0.9 special dividend to shareholder. The Ex-date to entitle for that dividend is on 30-7-2019 which is still far away from today. Therefore, price fluctuation will be huge and no rush to enter yet to entitle for the dividend.
Currently, sentiment around the world has been bearish especially with the US-China Trade War catalyst in play. Expecting further downside for the DJI and followed by the KLSE.
In this AAGB chart, we could see that there's a potential bear flag forming after the substantial rise and followed by a HUGE DISTRIBUTION CANDLESTICK + HUGE SELL VOLUME! I am expecting a retest of around RM2.74 (Green Box) before a further upside to be seen.
Let's see how it goes within this week. Cheers.

<<Update>> AirAsia next bullish Price continue bearish to retest the previous low (price 2.310). Divergence spotted for wave B and D and expecting price will make double bottom at previous low (price 2.310) before start bullish.
Waiting the price to break the trend line for confirmation.

AIR ASIA GROUP BERHAD (MALAYSIA)_Next BULLISHAIR ASIA BERHAD: Price currently stop at support level (completed wave "B") and will raise up to wave "C". Waiting for confirmation at end of wave "B" and we looking for double bottom or head and shoulders pattern before start BUY.

