NZD trade ideas

NZD Going ShortThe chart is in a bearish trend and making lower lows and lower highs thus going short on NZD since an ABCD pattern could be completed at D which is the support line and TP1.

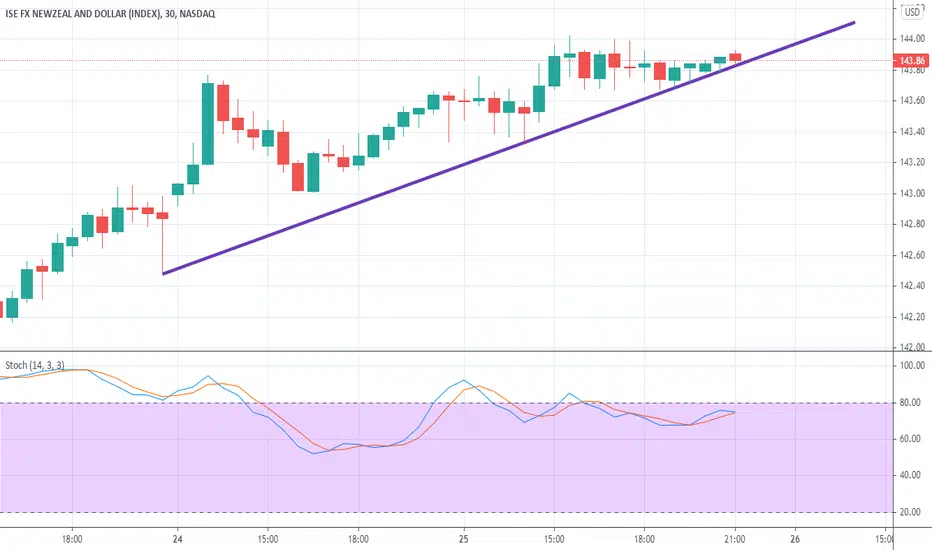
NZDNZD
It is in a descending channel.
According to previous forecasts, the price has increased up to the ceiling of the channel
Now I expect it to fall due to the downward divergence formed until the bottom of the channel.
#NZD #BTCUSDT #BTC #ETHUSDT #DOGE #DOGEUSDT


BEARISH CALL This is my bearish trend idea. However, wait for a fall back to a key level after trend continue to downtrend momentum, because overall structure breakout and continue to downtrend. You can see it high time frame momentum. Good luck

NZD/TRY bullishoscillator below average low and market compression. prediction is peak to previous support of 5.5


BULLISH TIME we have ab=cd pattern has been completed
and bull back from demand area so we will take i C point as target

Nzd long way downThis will gives much advantages to currencies against it. Look for LONG TERM selling opportunities

Buy NZD/CHFarea might provide us with a decent opportunity to look for further downside on this pair of NZD/CHF
The sharing of this idea is neither necessarily indicative of nor a guarantee of future performance or success.


NZX50 bearish indications *update*Thanks for viewing.
The price decline of 2015 to 2016 can be plausibly labelled either a WXY (double ABC) correction or as a single impulse wave down. There seem not to be any failures within what is quite likely an impulse wave down. So that leaves two main scenarios on the table:
1. That we have had the wave (4) correction and are working on wave 5 (we are nearing the end of sub-wave 3 of wave (5)), or
2. That we are in the later stages of wave B up - with wave (C) (down) still to come. This scenario points to a deeper correction.
That aside, Whether we are in wave B or wave 5 currently, immediate indications are short-term bearish.
- There are three peaks on the RSI showing a declining trend while price makes higher highs. This would indicate a larger or smaller correction is inbound. Bearish divergence is a strong indication of lagging momentum. If we are in wave B, then 146 should act as support. If we are about to start wave C then $131 should act as support for wave (5).
- The wave count seems to points towards a corrective phase.
- Equity markets in the U.S. and Europe have experienced increasing volatility over the past year and have both seen significant drops in the last few days. This will increase market uncertainty.
This is published solely for my own education and as an interested observer - who doesn't have a position in the market.

NZX 50 Index VS NZD/USDIndex down to about 141.76, then up. If this happens NZD/USD will first go up ( 0.7050 ), then long down ( 0.6510 ).


NZD Index New Zelland Dollar Short IdeaBearish Bat pattern, gann resistance and fib resistance are showing that NZD has nowhere to go but down.

NZX 50 INDEX BULL VS BEAR VIEWSHello,
Very interesting developments right now in the NZX - it only recently seems to have recovered from the 2008 economic shock... and then this happens. Wave A was clearly defined and there are 5 sub-waves that are valid and meet all extensions / dimensions. Then things get a little complicated, Wave B seems to have taken the form of an expanding symmetrical triangle (its not a wedge, expanding or otherwise, as the upward waves seem to have 5 sub-waves - as opposed to a 3, 3, 3, 3, 3 count).
Scenario 1: BEARISH. I don't see many symmetrical expanding triangles in the B position. If it is a B wave then there should be a 5 wave down-move that follows this present swing high to form wave C. This would mean a 16 to 20+% drop. If it drops below the red line, which marks my wave 1 top (the first and only plausible wave 1 top) and definitely discounts the possibility that wave 5 is yet to come (it must have already happened) - and to expect further correction.
Scenario 2: BULLISH.
2a, This may be a little unorthodox. It may be that wave B happened and there is excess buying pressure that has flattened the 5 wave C move. This would result in quite a powerful upwards move shortly (no targets at this stage).
2b. Wave C is truncated and fails to break below the red line due to strong buying pressure / support. This would mean that wave 5 up into or over $160 is still in play.
I tend to se more of a bearish view unfortunately. I for one will be interested to see how things play out - so many of the world's sharemarkets seem to be in a corrective phase. This is not a professional publication - just a guy in his free time. Happy trading, protect yourself and thanks for viewing my post. You may not believe in Elliot Wave, but luckli belief isn't required (although possibly a more skilled technician than myself) so let's see how it all plays out.


NZD index loosing steamLooks to be in a big corrective structure and just completed a 5 wave and correcting down. It broke out of fork and went down as I said when I posted it a while back. Could push up 1 more time but it looks to be in a corrective type pattern in fork. When that thing breaks out of bottom of fork should go down for a while
