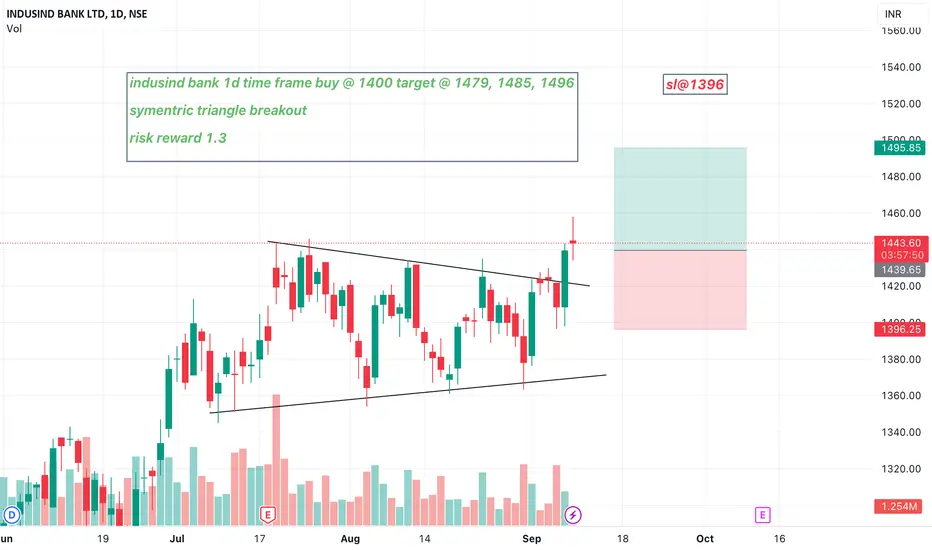
indusind bank 1d time frame buy @ 1400 target @ 1479, 1485, 1496indusind bank 1d time frame buy @ 1400 target @ 1479, 1485, 1496
symentric triangle breakout
risk reward 1.3
sl @1396
INDUSINDBK trade ideas
💥Indusind Bank💥-Nice Breakout 💥Indusind Bank💥-Nice Breakout
Capital to be deployed- 20k
Investing Price -1502-1507
Breakout Price-1502
Stoploss-1361
Targets-2039-2331-2749
RT for max reach
#IndusIndBank #StocksToBuy #stocks #StocksToTrade #StocksInFocus #stockstowatch #StocksInNews

INDUSIND BANK IS ABOUT TO HAVE A NICE UPWARDS RIDE...TECHNICAL INDICATORS :
ASCENDING TRIANGLE BREAKOUT -
The stock has broken out of the this pattern on weekly chart
REVERSAL FROM 50D, 100D, 200D SMA -
The stock has also reversed from all the 3 sma simultaneously indicating very strong upside pressure building up
REVERSAL FROM STRONG SUPPORT-RESISTANCE ZONE -
On top of that the stock has also reversed from a zone which had earlier acted as support and resistance level multiple times
FUNDAMENTAL INDICATORS :
BETTER PROFIT MARGIN POSTED COMPARED TO ITS PEERS ON THE LAST QUARTER -
The stock has also posted almost double profit margin percentage compared to ICICI, Kotak Mahindra and so on. Only SBI has posted same profit margin as indusind and sbi is also trading above all the 3 sma on Daily, Weekly & Monthly timeframes indicating the strength of this stock's upside momentum

INDUSAND BANKStocks trading near their 2 Day high as well as Bullish Derivation with rising volumes and closing strong , indicating a possible breakout
I am not SEBI register Advisor and I am not any trade and tips recommend here, This Idea post on this Channel Only for educational knowledge & learning purpose, I am not provide any trading tips, Before any Trade Advice your Financial Advisor, I am not responsible any profit and loss

Uptrend Channel breakdown in INDUSINDBKINDUSIND BANK LTD
Key highlights: 💡⚡
✅On 1Hour Time Frame Stock Showing Breakdown of Uptrend Channel Pattern .
✅ Strong bearish Candlestick Form on this timeframe.
✅It can give movement up to the Breakdown target of 1369-.
✅Can Go short in this stock by placing a stop loss above 1443+.

INDUSIND Bank Fresh Entry levelsAs per my analysis NSE:INDUSINDBK has more potential for upside. Fresh entry level could be 1440 with stop loss of 1412 (-28 points risk). We can expect upside targets of 1463 (+23), 1481 (+41), 1490 (+50) & 1501 (+61). It could be low risk and high reward idea..
Note: This is my personal analysis, only to learn stock market behavior. Thanks.

Indusind Bank addedAdded Indusind bank at 1460
Will add more quantity at 1440 and 1435 zones.
Any SL or Targets will be updated.

INDUSINDBK testing an important level multiple timesINDUSINDBK testing ~1425.00 level multiple times in today's session
We can go short if price breaks 1424.00 level
1st target - 1416.60
2nd target - 1406.60
Please do your own analysis before trading or investing
Happy Trading
Cheers :)

INDUDINDBK - Triangle breakout / flat formationElliott Wave Analysis:-
View 1:-
Triangle was formed and breakout happened and waiting for the retracement.
Once retracement took place we can enter into the trade with safe trade setup with Stop loss @ 1396 .
target 1:-1500
target2:-1575
View 2:-
There is a Flat formation in 4the Wave. expanding flat is getting into picture. Wave B crossed wave A and waiting for the C wave to get retraced. According to C wave we can decide whether it is an Expanding flat or Running flat.
we have to wait for retracement.
For Triangle Setup :-
aggressive buyer can enter the trade right now with same stop loss.
Conservative trader can wait for retracement.
I'm not a SEBI registered advisor.
Before taking a trade do your own analysis or consult a financial advisor.
I share chart for education purpose only.
I share my trade setup.

INDUSINDBKINDUSINDBK Chart Analysis......05/09/23
BULLISH PENNANT PATTERN
Indusindbk Long : 1430
Sl : 1415
Target : 1450 / 1496 / 1520 / 1555
Enjoy !

Indusind Bank - Looks BullishNSE:INDUSINDBK
NSE:INDUSINDBK1!
BSE:INDUSINDBK
According to wave count, IndusInd Bank is expected to see a small correction before an upside move.
This information is for educational purposes only.

Indusind bank - Triangle trading set up1. Beautiful, clean & crisp book set up
2. Good RR trade set up - 1:5+ RR
3. Very tight consolidation

INDUSINDBKIt is breaking out from good base and further the sector is also showing strength. So look for some low risk entry point here


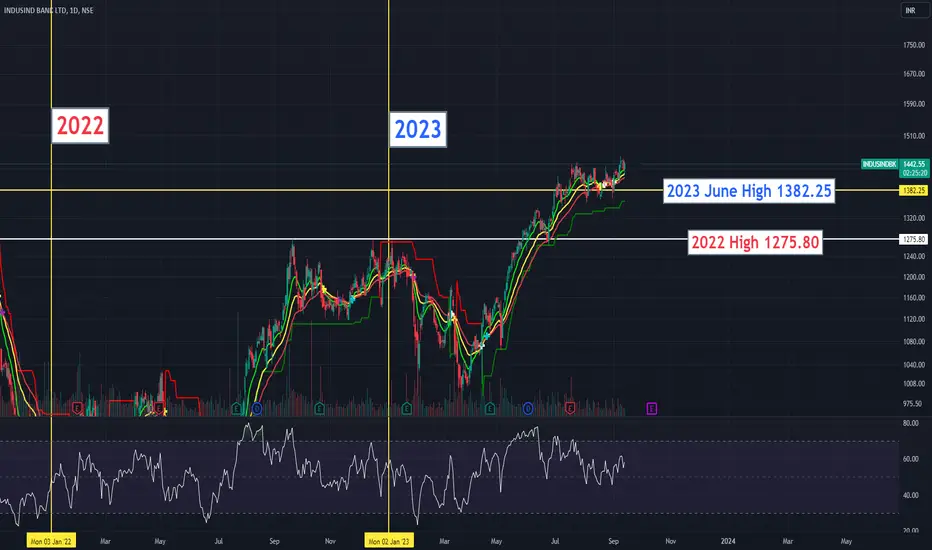
INDUSINDBK--Enters in Weekly Resistance Zone??the stock is trendnig upwards...
previously a strongfall is observed from the zone 1450.
previous resistance is broken @1270 zone and retested and moves up..
now price enters in to the weekly resistance zone...
keep safe...

INDUSIND BANK No big obstacles ahead just need to cross the previous high to go to the moon. remember good trades don't need big sl's. one can hold it for long term also.

Indusind bank Looks strong.The recent rally in Bank Nifty has played a crucial role in propelling IndusInd Bank to reach new heights. Benefiting from the overall uptrend in the Bank Nifty index, IndusInd Bank has demonstrated significant upward momentum. As the uptrend in the Bank Nifty index continues, there is a good chance that IndusInd Bank will sustain its upward trajectory. With a risk-reward ratio of 1:2, it presents an attractive opportunity for investors to consider a long position in the stock, particularly if it can surpass the 1400 mark. As always, it is important to conduct thorough analysis and consider market conditions before making any investment decisions.


INDUSINDBKIndusindbk chart Analysis........ 05/07/23
Indusindbk Short - 1363 ya Opening high
Sl - 1400
Target - 1336 / 1321 / 1300
Enjoy !
Someone from all of you members would like to know which candlestick pattern could not be formed here.

INDUSIND rising wedgeOn the chart we can see a rising wedge formation. We expect the price breaks down of the wedge. Our strategy is to short when the price breaks out of the wedge with increasing volume.
Regular bearish divergences confirm our bearish bias on the stock.

Indusind Inducing Confidence.IndusInd Bank Ltd. is one of the India’s leading financial services company. The Bank has network with 2606 branches and 2878 ATMs speeded across the country. They also have representative offices in London, Dubai and Abu Dhabi. Indujas are planning to hike their stake in the bank by inducing fresh amount of Rs.10,000/-Crores.
IndusInd Bank CMP is 1308.70. Negative aspects of the company are FIIs are decreasing stake, promoter holding decreasing and high promoter pledge. Positive aspects of the company are low debt, improving annual net profits and MFs are increasing stake.
Entry can be taken after closing above 1319. Targets in the stock will be 1344 & 1386. Long term target in the stock will be 1435. Stop loss in the stock should be maintained at closing below 1136.

Indusind BankHello
Traders I Hope You Are Doing Well.
Today I Am Sharing My Indusind Bank Chart Analysis For Tomorrow Morning.
