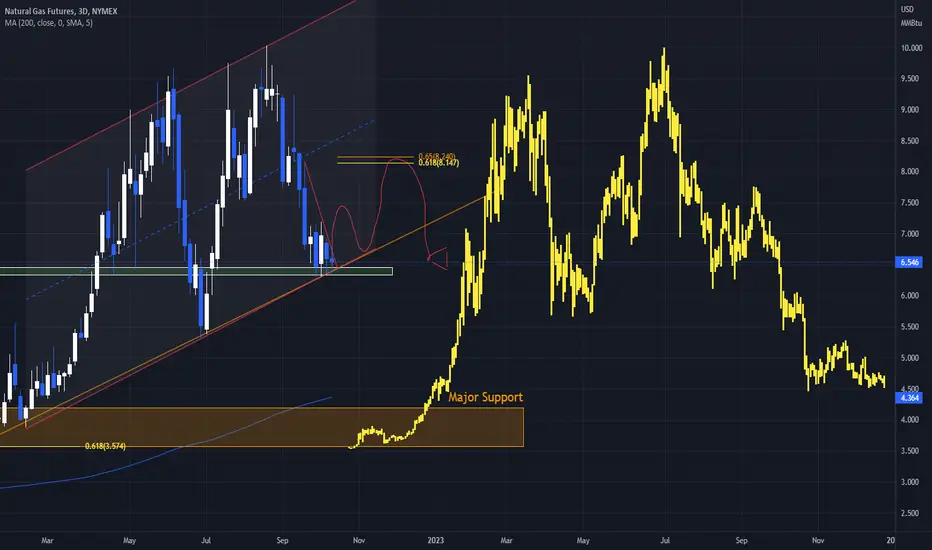
Natural Gas Short term target 4.35, long term target 2.33 Natural Gas recently hit the critical support at 3.4 and I see strong technical bounce to 4.3 level, hitting down sloping resistance line (red) which also coincides with Fib .618 level. Overall long term sentiment is still bearish, if the NG doesn't break above the 4.5 in upward momentum, we might see it crash towards 2.33 before mid of 2023.
Let me thoughts and comments on this post.
HH1! trade ideas

Nat Gas looking oddly similar to BTC chart before a deep declineI am not saying this will happen, in fact I am personally bullish at the moment based on a number of factors. (For more on why I am bullish check out my channel for my nat gas trade)
I thought it was worth mentioning that BTC price action over the past few years is lining up very similarly to the price action of nat gas over the past year. Based on this vague information I am still bullish, but as I explain in my other post I will be bearish as we approach a particular zone. That is when I will pull this chart back up and compare the direction between the two prices.
Just something interesting to watch over the next few months!
NG on September 24, 2001The last time Natural Gas traded at 150% away from it's 200 Day Moving average was September 24, 2001. 28 trading days later, futures had rallied 80%.
NYMEX:NG1!

BUYNG- As every trader knows, this is the most complicated commodity to trade, very aggressive with huge potential to win/lose.
On weekly chart, NG is now in multi year POC touching multi year trend line and RSI pointing 28.
Historically, each time when weekly RSI was at this level we have seen huge correction of more than 100%.
Trade safe.

Jan 30,22-NG-Almost long? Not so much!So NG price gapped down from the Big Boys on the weekend, putting the price of NG to almost a 2 year low. Not good for people like me that wanna go LONG and make some money.
Anyway, hold onto your shorts and keep waiting for the low...someone told me maybe 2.5 - looks like maybe they were correct :-)
Anyway, I'm still waiting (isn't that a song?) - doesn't look like anything is gonna change anytime soon. While the U.S. is in a cold snap right now, the long term forecast says seasonal norms so I don't see any crazy price spikes coming anytime soon.
Guess we shall see if we can trade the S n P 500 on Wed depending on how much the Fed raises rates.
Stay safe all.
Heiko

NattyNYMEX_MINI:QG1!
Natural gas trying to reverse
yet a retest of 2.7 - 2.6
seems to be waiting.
a bounce there will confirm the uptrend and fill towards the upper channels towards 3

NatGas will offer a nice recovery rallyeWe will reach the trough of NatGas very soon - my expectation is end of February 2023 - and from there, we could get a rapid recovery into the 4... or even 5.... level, which will reward very well considering the short timeframe during which this will happen. Technical indicators are looking like they want to balance out, which is indicating a bottom of price drawdowns for the time being. Watch the chart closely and make your own judgements and de cisions...........


NATGAS is trading in a Downtrend and keeps fallinHello,Traders!
NATGAS is trading in a
Downtrend and keeps falling
After the breakout of the
Key level just as I predicted
So the next goal is the
Strong support below at:
2.33$ and the key resistance
Is at: 3.445$
Like, comment and subscribe to boost your trading!
See other ideas below too!

Natural Gas: Latest Weekly Forecast- Drop to $2.60-$2.35 Following seven weeks of relentless selling, Natural Gas has entered extreme oversold conditions on Weekly Charts and either from current lows or a bit lower $2.60 and $2.35, an imminent rebound is very likely to test $3.00 and $3.275 resistance zone.
If buying momentum strengthens above initial resistance zone of $3.00 and $3.275 our next upside Target cum resistance zone would be $3.50 and $3.70 while the rebound will aim for $4.74 as strong supply zone.
In a trending bearish market, sell off can last longer enough that drives away most of the buyers from the arena before actual reversal takes place.

$QG1; bottom on natural gas futures?There is a bullish activity in ETF option markets linked to Futures of GAS, ProShares Ultra Bloomberg Natural Gas (BOIL) and United States Natural Gas Fund, LP (UNG), source: @MC_OptionTrades.
Inventories are decreasing (source: EIA)
Trend follows bearish but we shall pay attention

Bullish pattern on the 1-5 min carefulBullish pattern on the 1-5 min but careful for taking longs because the market still is in a downtrend looking weak with weak earnings especially top-line

BULLISH --> Demark Sequential - Perfected Set Up and 13 Count NYMEX:NG1! AMEX:UNG
$UNG $BOIL $NG1
demark.com

Natural Gas / NG - Act II: A Number That Starts With "2"My previous call on natural gas made Sept. 19 has come to fruition, achieving all three targets, and in a shorter than expected period of time:
Natural Gas / NG - It's Officially a Bear. Now, Hold My Beer
The question I've asked myself for the last few days is simply: Now that the June lows have been taken out, is it time for a reversal?
And frankly, I don't believe a (sustained) reversal is imminent, mostly because I really do believe $18 NG1 is incoming and these market makers, who are total maniacs, will not make it so easy for one to go long.
Things to keep in mind when we're so close to the end of the month and major lows have been achieved:
1. Look out for bounces as monthly candle wicks are painted
2. Look out for monthly candle highs to be painted in the first days/weeks of November
3. Big volume gaps between $6.3 and $5. "It's only 23%!"
4. Big bounce from $4.9 to $5.3 June lows are likely
Trendlines are astrology, for real. Stop believing in them. No banks and no trading floors at Shell, Exxon, Aramco, Gazprom, are sitting there thinking of what to do with billions of dollars of inventory and drawing a diagonal line between two lows and thinking to themselves about such and such "support." That is truly absurd.
Yet, you should pay attention to these things because, to the contrary, they're used to fleece dumb money. The markets revolve around fleecing dumb money, and there are entire funds with billions of dollars of dumb money.
To put this trendline into perspective, although it looks reasonable on the 4H, look how absurd this is on the monthly:
That being said, it's also reasonable on the 1W and 1D charts:
&
We are notably at that point, below the psychological $5 level and more or less at the trendline, and at the end of the month. When June made its Armageddon move downwards it came right as the monthly contract closed, so I personally do not expect a repeat of the same situation.
I think a bounce to $5.3 is more or less inevitable, and I suspect rather than break through it and act like Silver/Gold/WTI has retracing to newer highs, it will bounce off the low and manufacture the kind of "resistance" found in technical analysis books to encourage late shorts.
Early November may actually show us a more bullish impulse back to $6, but keep in mind that to get back to that mid-October weekly gap would more or less fill the entire October monthly bar with a November wick, so that gap is likely a breakaway gap that will stay in place for some time.
Anyways, what I expect to see is after some retrace to catch late shorts and squeeze and break them, as well as to exploit early bulls, we will see a retrace, one that won't last long and will probably be quickly accompanied by another breakaway gap.
I believe that natural gas will, in a very quick period of time, actually print a number as low as $2.9, a move that will be accompanied by WTI also setting new lows and approaching $50, as I noted in a recent call:
WTI Crude Oil / CL1 - Accumulation Before Global Conflict
Europe has already filled their coffers with $9-10 US LNG delivered via boat and until they need to refill the barrels in a few months after Freeport is re-opened, prices should be suppressed as producers and funds get net long on energy.
The reason is, problems between NATO and Russia and problems between the World and the Chinese Communist Party under the new found "Emperor" Xi and his delusional miscalculation to stay attached to Marxist-Leninism and communism will lead the Party to either attack Russia alongside NATO or to pinch both Russia and NATO with an assault on Taiwan.
Energy will be _extremely_ expensive everywhere once the global conflict breaks out. But as with all such moves, first come lows that are more uncomfortable than early bulls and scared bears are comfortable with.
2023 will not be a pleasant year, so make sure you do your utmost to have a proper Christmas with your family and act like a good person.
Whoever you are who is reading this, what I want to tell you is this: If you want a future, you need to start by first rejecting communist culture, especially all things Marxist-Leninism.
Next, you need to reject the Chinese Communist Party, for it is guilty of the crime of live organ harvesting genocide against Falun Gong and will be purged by history.
Third, you need to start to emphasize virtue and improve your conduct and morality on a foundation of traditional human culture.
I am not talking about dogma, and I am not talking about religion. Both of those are totally useless. I am talking about a rational understanding of what it means to be "a human being," the things that have allowed this civilization and this cycle of history to persist over the last 5,000 years, founded on the back of the Chinese dynasties.
There are so many lessons in history. I hope that whoever has the fortune to encounter my words can walk out of the catastrophe. But if your thoughts are unrighteous, then if you can't, you can't.
Regrets, however, will be no help at all.
It's just like poker: you have to figure it out and have your bets placed before the cards are turned face up. Once the truth is revealed, everything is fixed.

NATGAS Key Levels!
Hello,Traders!
NATGAS is trading in a
Downtrend and keeps falling
After the breakout of the
Key level just as I predicted
So the next goal is the
Strong support below at:
2.33$ and the key resistance
Is at: 3.445$
Like, comment and subscribe to boost your trading!
See other ideas below too!

Natural Gas Analysis and ForecastBearish pressure is expected to persist in the coming days or week due to increased natural gas production following a June explosion that shut down a Texas LNG facility. The facility is expected to take at least two weeks to become operational again, but bullish pressure may return once it does as well as if winter conditions return in late January or early February. If the 3.500 level is broken, prices may increase to the range of 4.500-5.000 before a possible drop again. NYMEX:NG1!
