AYI,,, BreakoutUptrend
Price level at 244 was a s/r level and its been broken by a good bullish candle today. In my view, it is a good buying position in a strong uptrend. About 233 could be a sure SL for it and next targets at about 273 and 300 .
AYI trade ideas

AYI Breaking through a Pivot from 2015AYI is currently breaking through a pivot that's been in place since 2015. Price currently above the major EMAs and has been riding the 20 EMA on the daily chart nicely. A follow through on this break could send price back up to test ATH at $280.

AYI Acuity Brands Options Ahead of EarningsAnalyzing the options chain of AYI Acuity Brands prior to the earnings report this week,
I would consider purchasing the 160usd strike price Puts with
an expiration date of 2023-7-21,
for a premium of approximately $6.35.
If these options prove to be profitable prior to the earnings release, I would sell at least half of them.
Looking forward to read your opinion about it.
AYI | Line DrawingInformation to have in mind:
I've graphed a few historic values that most analysts have in their notes.
Acuity Brands, Inc. reports their earnings 04/04/23 BMO: I'm anticipating the market will buy the surprise.
The %B is at a good value to "signal oversold".

AYI - Another Channel BreakoutPrice is now settling above the middle line of a strong channel.
I expect this to be a prompt reversal and price to rise above this up channel as it has in the past
The $400 psychological level looks nice right now following a breakout
Bullish

Acuity Brands Cup and Handle Pattern Acuity Brands, Inc (AYI) is an industrial technology company. They provide lighting and building management solutions in North America and internationally. The company was incorporated in 2001 and is headquartered in Atlanta, Georgia. AYI is a component of the S&P 400 Mid Cap Index
Market Cap: 5.968B
Beta (5Y Monthly): 1.54
PE Ratio (TTM): 16.75
Average Volume: 277,357 (1)
Cup and Handle (Bull Market Stats):
Overall performance rank (1 is best): 3 out of 39
Breakeven failure rate: 5%
Average rise: 54%
Throwback rate: 62%
Percentage meeting price target:
The above numbers are based on 913 perfect trades. (2)
AYI
Daily Volatility (Standard deviation YTD): 2.20%
Annualized Volatility (Standard Deviation YTD): 34.24%
S&P 400 Mid Cap Index
Daily Volatility (Standard deviation YTD): 1.59%
Annualized Volatility (Standard Deviation YTD): 24.76%
(The above were calculated using historical data)
The data above shows the daily and annualized volatility for AYI and the index it is a component of. As you can see AYI has a higher daily and annualized volatility. This can be good or bad. Depending on the way the stock goes and your position. For this pattern, I would say this is a good thing - the pattern requires volatility to breakout and reach the price target.
AYI has formed a cup and handle chart pattern. This pattern, as the name suggests, looks like the top ridge of a cup and the handle. The pattern forms as follows: price rise - left peak forms - price goes down at an angle and forms a trough - price rises again at an angle to form a peak. Sometimes, as in this case, the right peak may form a flag/consolidation pattern as well.
The blue line on the chart above represents a line of support for the stock. The red box represents what could possibly be a previous cup and handle position. However, in this pattern and the one on the right, I'm not that convinced of their authenticity.
The price rise before the pattern formations is not that convincing. I would ideally like to see an upwards trend for at least 3 months. The price has been in a downward trend YTD and then moving horizontally for nearly six months. However, this horizontal movement may be useful - if there is a upward breakout, the momentum could be strong.
Cup and handle patterns are ranked 3/34 patterns - meaning when done right, the pattern can bring good performance. The Breakeven failure rate is 5% which is low and hence a good signal. The Throwback rate is 62% which may be a concern. Especially if the pattern is not that strong - as in this case.
Totaling this all together, I would give this pattern a rating is 3/5. The ROI may not seem sufficient to justify a long position. Henceforth this is a riskier position.
The main issues are:
A previous cup and handle position formed before that did not breakout
Lack of a strong upwards trend before the pattern formation
The pattern duration is around 10 weeks. This is within the range of ideal 7 - 65 weeks, albeit at the lower end of the spectrum.
The price target is the difference between the right peak and trough * the percentage meeting price above:
$204.54
From the current price that represents a 9.13% ROI.
Macroeconomic considerations:
Interest rates are rising and so will inflation. We are most likely already in a recession. I would not be concerned about this for this trading idea. This will most likely be a short-term trade for a couple of weeks once the stock breaks out with a close above the trendline.
Fundamental analysis:
Since this will be a short-term trade, I did not find the need to include any further research- the next earnings is not until January so no concerns.
References:
1 finance.yahoo.com/quote/AYI
2 thepatternsite.com/cup.html

Head and Shoulders Price is under the neckline.
Price is up a bit, not much, after very good earnings were released.
Neckline slopes up to the 2nd shoulder.
AYI has a history of earnings beat and I will one day go long again on this security. Just not now )o:
Price may climb up a bit more. Just never know.
No recommendation


ACUITY BRANDS IdeaHey people, ACUITY BRANDS is in a bullish configuration with high negotiated buying volume and a marubozu. On the TIMEFRAME M1 we can see a marubozu with an explosion on the volume of purchase made, it goes towards the highest of the bollinger to test it. In order to break it in force and come over the top of the stabilization area for a retest. Big potential to breakout the price with the return of momentum thereafter to the zone to access the second and land on the next high. All this scenario is impossible or failure to fill a bearish breakout gap. Before testing the top of the bullish channel or stabilization zone.
Please LIKE & FOLLOW, thank you!


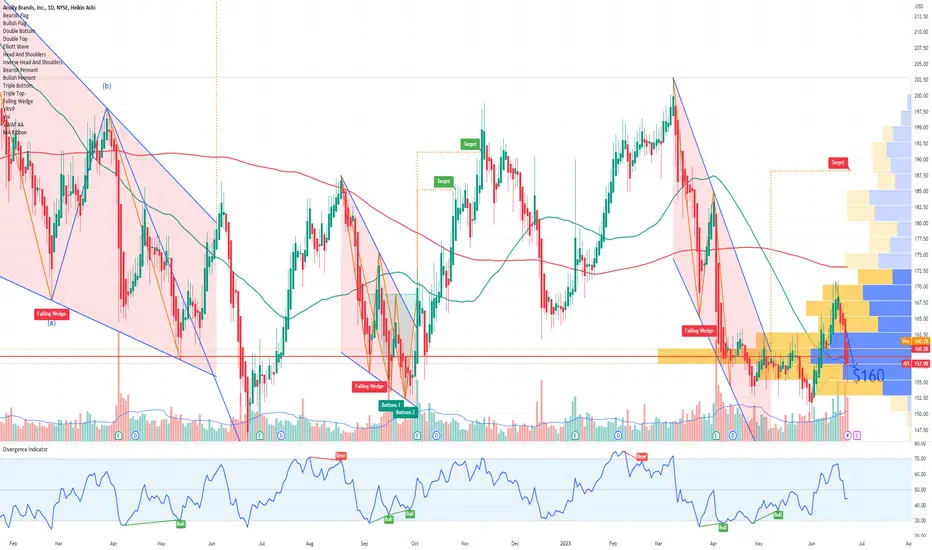
AYI Acuity Brands Inc pushing beyond the lower boundary$AYI is trading lower pushing beyond the lower projected boundary of the PEAD cone, with good room for a bullish move following the projection back towards the median line.


ABC AYI beat EPS this amTo my surprise AYI Beat earnings / EPS today
Acuity brands is trading in an ABC bullish pattern ad break out was 91.5 Perhaps there will be a pull back tomorrow as there often is. It looks like AYI was stopped cold at the bottom of prior gap down. Perhaps a level to watch
Target 1: 114 to 121
Target 2: 140 to 160
I will place my stop under 85
Hypothetical trade and we all know anything can happen!

AYI - Inverse Head and ShouldersI expect this to rise or churn before earnings. RSI and MACD show Bullish. I have opened a Calendar Spread and will close out before Earnings on July 3, 2019.

AYI: This bloated pig has only one place to goHighly overrated and it shows in the price action. Prices marked. Please study the company, environment and competition and GL.
Reporting next week.


AYI maybe a candidate for shortingAYI cannot break 135 resistance level almost 4 times already. MACD is declining and in the past two weeks red volume bars are more dominant. Therefore, Maybe now it's the perfect time for shorting AYI. Stop loss is 134. 1st target is 121 and 2nd target is 112.

Acuity Brands: Business Uncertainties from Tariffs and WagesAcuity Brands: The Business Uncertainties from Tariff and Wage Inflation
I last mentioned Acuity Brands (AYI), a lighting and building management solutions company with $3.7B in net sales in 2018, three months ago. At that time, I described a good risk/reward setup to go long the stock post-earnings. AYI shot nearly straight up from there. The stock broke through resistance at its 200-day moving average (DMA) and gained as much as 34.7% before peaking intraday in September. While I only participated in a portion of that run-up, I am glad I did not overstay my welcome. Fast forward to last week: AYI suffered a massive post-earnings gap down. The stock lost 16.3% and sliced right through 200DMA support after the 50DMA gap down. Sellers closed the week confirming the bearish breakdown. AYI has now almost erased its entire incremental gain from July earnings.
{Chart: Acuity Brands (AYI) looks set to reverse all its previous post-earnings gains after a disastrous earnings report that sent the stock crashing through its 50 and 200DMAs}
This moment is critical for the stock. AYI hit an all-time high in August, 2016 and sold off pretty steadily from there (on a monthly basis) until reaching a 4-year low in May, 2018. If AYI completes a full reversal of its gains from July earnings, then the stock greatly increases its risk of resuming the downtrend from the all-time high.
AYI’s earnings report was interesting for a lot more than the technical disaster. The company also delivered some telling remarks about today’s inflationary environment. The company begain its conference call by launching right into the bad news. From the Seeking Alpha transcript:
“While our results for the fourth quarter and the full year were records, we had higher expectations coming into 2018. Market conditions for growth were far more subdued than most had originally anticipated, especially for larger commercial projects and deflationary pricing persisted throughout the year, while cost pressures were far more significant than most had forecast, particularly in the fourth quarter.”
The general market environment hindered the business:
“Based on the information from various data collection and forecasting organizations, we believe the overall growth rate for the fourth quarter as measured in dollars for lighting in North America was flat to slightly down, continuing the sluggish trend over the last several quarters…
We believe the lighting industry will continue to lag the overall growth rate of the construction market, primarily due to continued product substitution to lower priced alternatives for certain products sold through certain channels.”
For the fourth quarter and full-year, the company sported record revenues and diluted earnings but significantly lower operating profit and margin. The cost pressures came from multiple inflationary fronts including tariffs and wages. Emphasis mine…
“Another significant factor impacting our adjusted gross profit and margin was higher input cost for certain items, including electronic and certain oil-based components, freight and certain commodity-related items, particularly for steel. Many of these items experienced dramatic increases in price in the fourth quarter due to several economic factors including enacted tariffs and wage inflation due to the tight labor markets.
We estimate the inflationary impact of these items reduced our adjusted gross profit in the quarter by more than $20 million, lowering our adjusted gross profit margin by 200 basis points and reduced adjusted earnings per share this quarter by $0.38…
…we expect employee-related costs will continue to rise as we enter fiscal 2019 as markets for certain skills remain tight contributing to a rise in wage inflation…”
AYI also explained that it sources from China about 15% of its components and finished goods which are subject to the new import tariffs.
Freight costs are an increasing burden. The combination of rising oil prices and the rising wages that come from a severe shortage of truck drivers are driving freight rates skyward. Shipping a lower-value product mix is exacerbating the shipping burdens.
As we would expect, AYI is scrambling to mitigate these costs by finding alternative suppliers and production sources, improving productivity, and increasing prices. The company announced price hikes last month and new price increases go into effect on October 15th. Assuming the new 25% bump in tariffs on Chinese imports goes into effect on January 1, 2019, AYI will raise prices yet again. IF AYI makes these price hikes stick without losing much demand, then the stock could represent a great buying opportunity. Better margin numbers should start appearing by the second fiscal quarter 2019.
AYI cautioned that a lot uncertainty surrounds the potential impact of the cost pressures. For example, the inflationary pressures from tariffs caught the general industry by surprise as participants have experienced a deflationary environment for a “handful of years.” The demand impacts are hard to assess: “It is not possible for us to precisely determine what the potential impact tariffs will have on demand as it is a very complex situation impacted by numerous factors including currency fluctuations and political outcomes.”
As the inflationary adjustments unfold, I will watch the technicals for signs of renewed buying interest. The company itself is one source of buying. AYI repurchased 2M shares at a cost of $298.4M in its fiscal year 2018. AYI still has 5.2M shares left under its repurchase authorization. I have to assume the company will aggressively buy shares in the coming months given the current stock price of $130.99/share is well below the average cost basis of $149.20/share of the to-date repurchased shares.
Finally, it is possible tariffs could HELP AYI although the company did not specifically say so. In the conference call AYI pointed out that the Chinese government is subsidizing lighting companies who are undercutting price for lower-value fixtures. This competitive pressure is important because, as noted earlier, some of AYI’s customers are downshifting to these lower-valued products. AYI is determined to compete – “We will not yield this space for many strategic reasons” – and this competition represents one more important risk factor for the business.
Overall, AYI is one more cautionary tale about the unanticipated impacts of today’s new inflationary environment. Given that financial markets are generally ignoring most potential fallouts from the expanding trade war between the U.S. and China, this earnings season should deliver many more surprises like AYI’s.
Be careful out there!
Full disclosure: no positions
For more, see One-Twenty Two by Dr. Duru


Dow drops 666 points :( #2 AYI )A support breakout accompanied with bad news is a good way for short selling stocks because of the threat of higher interest rates this year
Is Important that the past price behavior match with the intention
Look back in January 2017 the Big gap that finish with the bull trend and the past Lower Highs and Higher Lows that is making the price and the moving averages too
What more evidence do you need?

AYI possible risePlaying Trading Simulator Game:
Historically, big drops are followed by steady upward climb.
Also, large daily range to play.
If holding long, it might be a good idea to order a trailing stop.
