#altcoins' dominance matters!#others chart (#altcoin market cap excluding top 10 #alt) is showing severe weakness. Even more low cap and mid cap altcoin price correction continuation to minor altcoins seem necessary in a few months. Not financial advice.
OTHERS.D trade ideas


📈 How To Know Which Altcoins Will Grow And Which Ones Will MoveOk. There are tens of thousands of Altcoins trading pairs and this is the reason why it is obvious to consider each pair individually. There is no point in making generalisations because there are just too many of us.
Some people can have a 1-3% stop-loss while others can have a 20-30% stop-loss. A correction can affect very different an investor, a long-term trader, a day-trader, scalper, futures trader and so on.
Some will go down while others go up but there is a way to identify exactly at which point in the cycle each pair is currently at.
As always, I am an open book ... and I am sharing my experience, wisdom and knowledge with you. I am sending you LOVE! ... Know, that I love YOU!
Ok, let's get started!
➖ How do I know if the trading pair that I am interested in is likely to move lower or higher based on the current market situation?
➖ How do I know how far down a pair can go in this correction?
Let's start by saying that we can't know for sure and thus we are only going to be making some approximations. We look at the pairs that are more advanced within the current market cycle and whatever they are doing the rest will do the same. This is the method we used to find the main resistance levels on the way up for the previous bullish wave and the method I used to find the main support levels for the current bearish wave. It is the same method I will use to predict the next set of targets when the next bullish wave comes in a matter of months.
The majority of the Altcoins (we are talking about USDT pairs here), hit a low around September/October 2023. All these Altcoins went ahead to produce a very strong bullish wave. This wave peaked late 2023 for many, many Altcoins —some of the smaller ones that many of you are not looking at, while others continued through 2024 and present day.
Now, some pairs grew between 2-3X while others grew 10-15X.
The correction potential for those that grew between 10-15X is much stronger compared to those that grew only 2-3X. Cardano is a great example; while some other projects (like Solana) have to move much lower, Cardano doesn't have much lower to go or the bottom might be already in. Might be, there can be another drop but just to give you an example.
Another example is XRPUSDT.
This pair potentially bottomed while some others still have to go through the whole corrective phase. Now, and this is the hard part, many pairs are in-between their correction and these are the ones that I want to expose to you.
Say the bullish wave is over, Solana (SOLUSDT).
👉 The correction is likely to end around the 0.618 - 0.786 Fib. retracement range for the entire bullish wave.
We can be talking about a bullish wave that lasted 300 days or 30 days, makes no difference at this point.
We plot the "Fib Retracement" tool with the value '0' being the last high, this is the price that hit early 2024 or late 2023 for most pairs. The next value, '1', should be plotted at the last major low before the bullish wave; the bearish cycle bottom. Doing this will give you the Fibonacci retracement numbers for the entire bullish wave.
If you find a pair, using the weekly timeframe, where a wick or candle pierced through these levels, you can feel sure that the correction low is likely in. If it isn't in, then one more low and that's it.
This low won't necessarily lead to a straight up arrow as the next bullish jump. If it does, it would be a wave five of a bullish impulse leading to a major correction then higher low before the bull-market takes place.
Now, the general scenario that is likely to develop on most chart goes as follows: A drop in the above mentioned range, then an accumulation/consolidation phase forming kind of a cup pattern, can last 2-4 months and then the action starts going all the way through 2025 and new All-Time Highs.
The correction cannot be avoided.
We have a long-term triple top.
Leave a comment with your support, sending me some love and some questions.
Namaste.

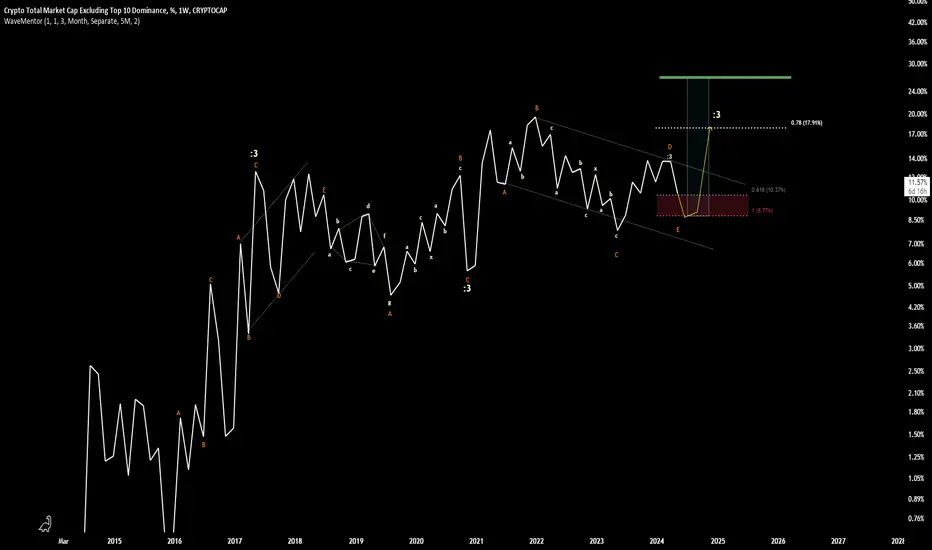
OTHER.DAccording to the existing structure in the 3-month time frame, it is expected that in order to complete a high-grade pattern of the neutral triangle type, further correction will be required up to the range of 8%-10%. The structure is expected to see an upward movement to the minimum range of 18%
Other.D crypto In the crypto market, cryptocurrencies like Bitcoin, Ethereum, and many others have revolutionized the way we think about money and transactions. With decentralized networks and blockchain technology, crypto has the power to disrupt traditional financial systems and provide greater financial inclusivity worldwide. Whether you're a seasoned investor or a curious newcomer, diving into the crypto world opens up a world of possibilities.
On the other hand, the Forex market, also known as the foreign exchange market, is the largest and most liquid market globally. It involves the buying and selling of currencies, where traders aim to profit from the fluctuations in exchange rates. Forex trading offers opportunities to capitalize on global economic trends and geopolitical events, making it an exciting space for traders to participate in.
Both markets have their unique characteristics and risks, but they also present tremendous opportunities for individuals to grow their wealth and expand their financial knowledge. Whether you're interested in the technological innovations of crypto or the global dynamics of Forex, these markets are constantly evolving, providing endless possibilities for those willing to explore and take calculated risks.
So, buckle up and embark on an exhilarating journey in the world of crypto and Forex, where innovation, wealth creation, and financial adventures await! Remember to stay informed, manage risks wisely, and embrace the thrilling ride that these markets offer. 🚀💰🌍 #Crypto #Forex #Investing #Finance #Opportunities


Others.D v USDT.d --- Shitcoinz v Stablecoin ratio inv H&SPretty simple ratio to keep an eye.
Others is the crypto index minus the top 10
So our blessed Shitcoins
Pulled up this ratio today and what do you know
we have a inverse Head & shoulders that will help us for profit taking levels.
Best of Luck
ALTs to run hard into April / May is what I have been calling for.
So maybe we get to the linear target
.... Pause....
And then finish the job end of the year.
best of luck.

Altseason about to start! Evening fellas,
We can't control the market, unless you're one of the fortunate ones...
But we can follow the wave and right now it means up!
Trade thirsty, my friends!

Alts DominanceAlts dominace bounce back from his support & also forming Falling Wegde on Weekly TF
According to Fixed Range Volume Profile , Dominance is below POC and LAR (Low Area Region)
I m expecting 12 to 13% Dominance Increase

Repeating Patterns May Lead to a New ATH for Alt DominanceAlt dominance formed something that looks a lot like an HSi with a very small right shoulder, which broke above its neckline and successfully re-tested, confirming the pattern and targeting 16.6%.
See the white drawn pattern and its white dashed neckline on the chart.
The same area of breakout and re-test from the smaller white pattern is forming another similar small right shoulder on a larger HSi as drawn in blue, with its neckline as the blue dashed line.
Should the blue pattern be a repeat of the smaller white one, and breakout of its neckline as well (note that it should as long as the white pattern continues up towards its initial target), it will target 21.8% upon confirmation and any successful re-tests of its neckline.
More related ideas for BTC.D and OTHERS.D in the Related Ideas section below.
This would suggest the possibility for a new ATH for alt dominance. For confluence, note that the halfway point towards 21.8% nearly equals the initial target of the smaller white pattern at 16.6%. And, rising green volume into the move.

Others Dominance v Bitcoin dominance --- may not give a new ATH ... for the cycle
Bitcoin could be so strong
That even though the others index ( aka shitcoins ) still do well from here.
Maybe they don't make a new high for this ratio.
As this chart shows -- last cycle
all the coins outside the top 10
peaked at 1 : 2 bitcoin.d
essentially the others.d was around 20% of the entire total market
bitcoin was around 40%
Eth was around 22%
(stables and the remainder of the top 10. made up the rest)
These targets are definitely worth keeping an eye on!

RSI divergence for Altcoin marketsWe are in the perfect RSI divergence on Weekly chart of altcoin markets it indicates that altcoin rallies will start from next week

📈 Ultra-Bullish Altcoins Market vs BitcoinThis is the "Others Dominance Index" chart. OTHERS.D
This is a great index and shows the dominance of the Altcoins market minus the TOP10. This can help us illustrate what I've been trying to share with you about Bitcoin, the big Altcoins vs the rest of the Altcoins market.
👉 Bitcoin and the TOP10/20 Altcoins are about to go down.
👉 The rest of the Altcoins market is about to grow strong.
You can read the most recent trade ideas on Solana & Polygon in my profile for additional information... Let's get started with this chart.
Others Dominance Long-Term Chart Analysis
➖ The first thing to notice is the current session. It has a long lower wick moving below strong support in the form of EMA10, EMA21 and MA200 but is now back green. These three are the most important moving averages for short and long-term potential gauge. The week closes tomorrow and these levels will be confirmed as support fully supporting a major bullish explosion.
➖ Trading volume is the highest, period, since May 2022.
➖ The RSI is the strongest in years with plenty of room to go higher.
➖ This index has been rising and building up momentum since June 2023. It is now ready for its final bullish explosion. We are talking 500%-1200% growth across hundreds if not thousands of Altcoins.
➖ Marketwide action supports these bullish signals. Notice that Others.D move down between late December 2023 up to this point; while Bitcoin produced it last high. Notice that the index is now poised to produce massive growth while Bitcoin is poised to retrace. This is already happening.
This is a major opportunity and Cryptocurrency traders can benefit by paying attention.
The market moves in cycles... And this is great, it helps us predict what comes next.
Bitcoin went through its cycle, we enjoyed it, we appreciate it but it is time to move on.
What Bitcoin did in 15 months some Altcoins can do in 2 weeks, some within a month, others will do many, many times more. The reasons are obvious, Bitcoin is so big that it can only grow so much, the Altcoins are new, young and small so they have plenty of room avaiable for growth!
Do what's best for you.
If you miss this opportunity, we will have a few more in 2024 and one last one in 2025.
But instead of missing it, let's just enjoy them all.
The market is great.
It will continue to bless those who support it and participate.
The market is great.
If you stay around, it will be pay you many times whatever you invest.
This is not financial advice.
Thanks a lot for your continued support.
It is truly appreciated.
Namaste.

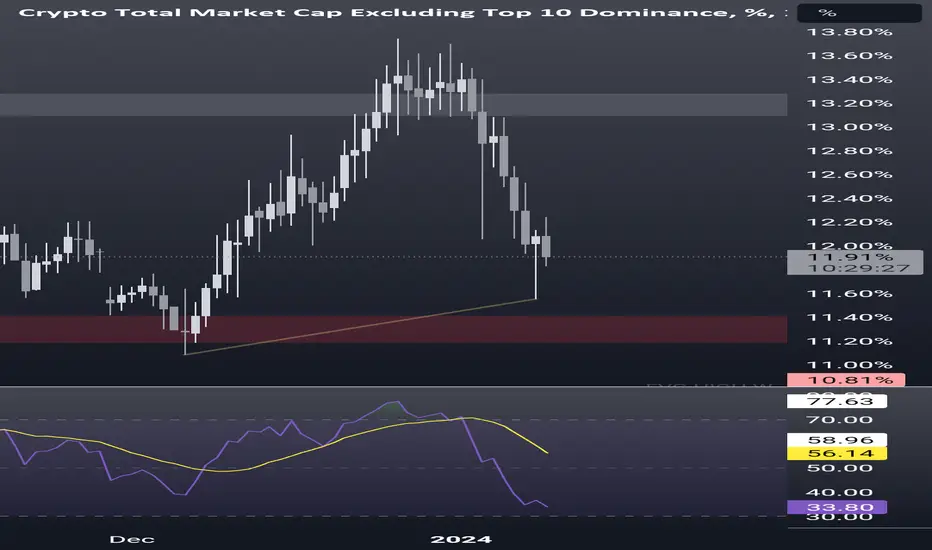
OTHERS.D likely path for weeks ahead...As you can see on the chart the current level at between 12.2% and 12.6% have acted as a strong ceiling for CRYPTOCAP:OTHERS.D on June 2017 , January 2018 , April 2018 , October 2020 , February 2023 and November 2023 . So obviously that ceiling is a valid candidate for a future strong support level .
On the other hand, OTHERS.D have broken out of a descending channel which it was inside from April 2022 to August 2023 and since, followed a bullish trend in which it have shown EMA 144 to act as a strong support .
So, in case of a LIKELY INCREASE in the OTHERS.D measure over the course of next several weeks , I will be looking at 13.75% and 15.40% as possible targets for the move.
Thank you for reading this,
Have a great trading and always KEEP IT SIMPLE.

ALTS pump $ALTS $FET $RNDR $ATOR $ZIG $OFN $BTC $ETH $WOOI think we gonna see a EURONEXT:ALTS weekend pump.
Enjoy the ride

Altcoin Season 2024 is about to beginTo delineate the onset of Altseason 2024, I have meticulously scrutinized CRYPTOCAP:OTHERS.D , which offers insights into Dominance distribution, excluding the Top10.
Historically, the level around 12% has proven to be extraordinarily significant. Presently, the "price" rests just below this pivotal level (specifically at 11.93%). However, we have recently witnessed a compelling inverse head and shoulders pattern, followed by a move above 12%. This suggests that the current level may simply be a retest of 12%, potentially heralding the beginning of a journey towards new highs and triggering a substantial Altcoin Season.
I've opted to illustrate this phenomenon using the "Baseline" chart style. However, transitioning to regular candlesticks would further accentuate the significance of the 12% level.

The fate of crypto currencies in the coming daysThe analysis here matches the analysis of Bitcoin and Tether, which confirms the falling of the
crypto currency market in a correctional wave, as we mentioned.

Prospects of OthersVolume is the key here; if the local channel breaks, 2-3% would be an ideal target, as it has never been properly tested.

Other.D●Other.D bullish divergence worked..which made the Altcoins to pump.
●Bullish divergence was spotted earlier and shared by me here..
●Divergence works the best.

Get ready for giga ALT coin season :)!!!Hi all,
Get aboard for a giga pump over the next two years in ALT coins. Buy on spot and hold!!! :)
Have a great day :)


We've Done This BeforeAlt dominance may be repeating its prior pattern, where it wicked up to it's ATH after a series of drops, and then dropped hard before making a new ATH.
I still question whether it will actually make a new ATH this time, but imagine it will at least revisit the area of previous ATH.
Related idea linked below - a falling wedge breakout that is targeting previous ATH

Another Rally for Altcoins coming??●Other.D showing the bullish divergence on the Daily Timeframe.
●If this divergence played out then we might see another Rally for Altcoins
●Once the Btc.D reached the HTF targets and Btc started to consolidate that's when Altcoins will Rally..
●Note: ETF Date is coming 10th January