RLCUSDT IDEAHi guys,
RLC can also have big potancial. You can follow this setup. Yellow lines Take profit. Enter from green line.
1.12 entry
1.04 stop
1.30-1.45 and +++ can come.
Good luck.
If you like tap.
RLCUSDT.P trade ideas

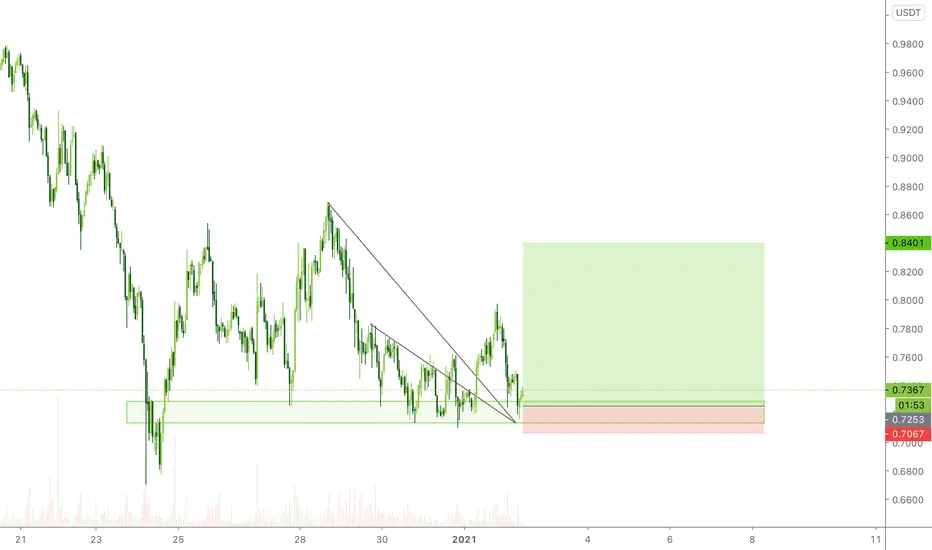
RLCUSDTA volume diversion bar has formed on the daily chart. Fractal is above the 13ema and price has pushed into the high/low 5ema channel without crossing the high. Price is above the 200ema and RSI above 50, which tells us this is an up-trending market. The first target is the last fractal high or a volume diversion bar to the downside. A stop will be placed below the prior daily candle 13-01-2021. Enter on today's candle 14-01-2021. Good luck!

RLC Breaking out, TODAY!RLC will go after soo much weeks pushing in the end more up. I see it will reach around first 1,45 and after that higher.
This is the best moment what i think to buy, i buy more and what you do?

RLCUDTIf you cross the specified range, the buy signal will be activated at target 1.25, otherwise, it will return to the support level of 0.90.

RLCUSDT is testing 4h resistance 🦐$RLC.X IF the price will have a breakout from bull flag, According to Plancton's strategy (check our Academy), we can set a nice order
–––––
Follow the Shrimp 🦐
Keep in mind.
🟣 Purple structure -> Monthly structure.
🔴 Red structure -> Weekly structure.
🔵 Blue structure -> Daily structure.
🟡 Yellow structure -> 4h structure.
⚫️ Black structure -> <4h structure.
Here is the Plancton0618 technical analysis, please comment below if you have any question.
The ENTRY in the market will be taken only if the condition of the Plancton0618 strategy will trigger.

RLC READY FOR A RUNCurrently its facing some resistance , As Soon As Volumes Come in it Will Run Hard.
Targets On Chart :)

RLCUSDT What we see now :
1- the price at 1.24$
2- the support level at 0.89$
3- the resistance level at 1.80 $
4- the price cross MA 50 and MA200 " wait for daily close confirmation "
5- three positive buy signals are active now
what we should do :
- according to TA and robo signals it is a good opportunity to take a position in this trade
- follow the robo sell signals
trade with your own responsibility

RLCUSDT ready to surprise us?Meme coin likes to go crazy every 6 months. Coming up on the end of a falling wedge here. Double bottom, higher lows. Going to start a position here. could see a 3 bagger.

BINANCE: RLC/USDT🛒 Pair: RLC/USDT 🛒
== SPOT==
⏰ 1399/09/27 ⏰
🕰 17/12/2020 🕰
Duration:
📈 SHORT - MID 📈
Ex: Binance
🛒 Buy1 : 0.990 - 1.00 🛒 1/6
🛒 Buy2 : hidden 🛒 2/6
🛒 Buy3 : hidden 🛒 3/6
👉Sell Targets👈
🎯TP1: 1.020 🥉
🎯TP2: hidden 🥈
🎯TP3: hidden 🥇
🎯TP4: hidden 🏆
🎯TP5: hidden 🚁
🎯TP6: hidden ✈️
🎯TP7: hidden 🚀
🎯TP8: hidden 🛰
⛔️ SL: 0.899 ⛔️ with 4Hrs. candle closing below


I expect RLC to move in this channelWe have two options:
If supported, prices could rise.
or
it passes through the middle of the channel,Falling will be possible

RLC - USDTResistence at 0.96 ( Long if break )
or waiting at Buying Zone 0.85 - 0.9
Very tight SL : 0.79
TP : 1.0 - 1.1 - 1.2 - 1.3 - 1.4 ---- 1.5 ++++
DWYOR


RLC Making That Bullish Reversal?My Fellow Crypto Traders,
Appreciate you taking the time to view my analysis which I hope you may find beneficial. Please be sure to “LIKE” if you indeed find my analysis useful and/or find my analysis intriguing.
Cheers & Happy Trading!


RLC Breaking OutRLC retested this summer's breakout starting point, and is now attempting to breakout. Volume has been steady, trend is on its side and it can ride the altszn narrative.

RLCUSDT - Elliottwave analysis - C down cycle RLCUSDT - It is in C wave down within ABC zigzag pattern. The sharp drop was 1st wave of C and it seems like 2nd wave correction was finished. Sell it here with stop level above 1.0830 for target below 0.75 or lower level.
Give thumbs up if you really like the trade idea.

RLCUSDT - Elliottwave analysis - C down cycleRLCUSDT - It is in 1st wave down and about to finish soon. Thereafter 2nd wave correction of C wave up expected to move higher up to 1.009-1.0335 zone, Sell with stop level above 1.0829 for target below 0.75 or lower level.
Give thumbs up if you really like the trade idea.


RLCUSDT - Elliottwave analysis - 5th of C wave upRLCUSDT - It is in ABC zigzag up and seems like 4th wave correction in progress. So pump it near 1.1239 level with stop level below 1.0792 for target above 1.250 as 5th of C wave up.
Give thumbs up if you really like the trade idea.
