NASDAQ100 D1Very bear day today!
Regardless we are in a support zone, we could still see index testing lower prices.
Let´s wait and see how reacts from here to take action
NDQ trade ideas

US Equities Fall Amid Inflationary Pressures and Trade TensionsUS equities closed the week with significant losses, reversing the gains recorded during the previous week. The S&P 500 and Nasdaq dropped more than 1%, reflecting a clear deterioration in market sentiment amid multiple adverse factors.
The bearish session unfolded in an environment dominated by worrying signs of inflationary pressures, particularly the Personal Consumption Expenditures (PCE) Price Index, a key gauge followed by the Federal Reserve (FED). The core PCE posted a monthly increase of 0.4%, the largest gain since January 2024, exceeding market expectations. On an annual basis, this measure accelerated to a concerning 2.8%, signaling persistent inflationary pressure that could complicate future monetary policy decisions by the FED.
At the same time, soft data has continued to deteriorate significantly, adding uncertainty regarding the resilience of hard data. The University of Michigan consumer sentiment index fell to 57, its lowest level since November 2022, due to negative expectations regarding personal finances, unemployment, and inflation. In fact, two-thirds of consumers anticipate a rise in the unemployment rate, reflecting a level of concern not seen since the 2009 financial crisis.
Much of this uncertainty has been fueled by recent policies implemented by the Trump administration, particularly government spending cuts and aggressive trade policies. The latest move came with the announcement of 25% tariffs on imported cars and auto parts, effective April 3. This measure triggered an immediate negative reaction in both local and international markets, anticipating higher costs for US consumers and potential trade retaliation from key partners such as the European Union, Canada, China, Japan, and South Korea.
At the sector level, discretionary consumer goods were the most affected on Friday, while utilities showed relative resilience. This uneven performance supports the case for a defensive market, reflecting a growing risk aversion among investors.
The combination of inflationary pressures, economic slowdown, and rising trade tensions creates a challenging environment for equities. Overall, current conditions point toward a concerning scenario with signs of stagflation: low economic growth coupled with persistent inflation and a rapidly deteriorating economic sentiment.
In conclusion, it will be key to closely monitor the evolution of hard economic data as well as the international response to US trade policies. The big question in the coming months is whether the current fragility in economic sentiment will ultimately translate into hard economic indicators, decisively impacting equities.
Pepperstone doesn’t represent that the material provided here is accurate, current or complete, and therefore shouldn’t be relied upon as such. The information, whether from a third party or not, isn’t to be considered as a recommendation; or an offer to buy or sell; or the solicitation of an offer to buy or sell any security, financial product or instrument; or to participate in any particular trading strategy. It does not take into account readers’ financial situation or investment objectives. We advise any readers of this content to seek their own advice. Without the approval of Pepperstone, reproduction or redistribution of this information isn’t permitted.


"NAS100/US100" Indices Market Heist Plan (Scalping / Day Trade)🌟Hi! Hola! Ola! Bonjour! Hallo! Marhaba!🌟
Dear Money Makers & Robbers, 🤑 💰💸✈️
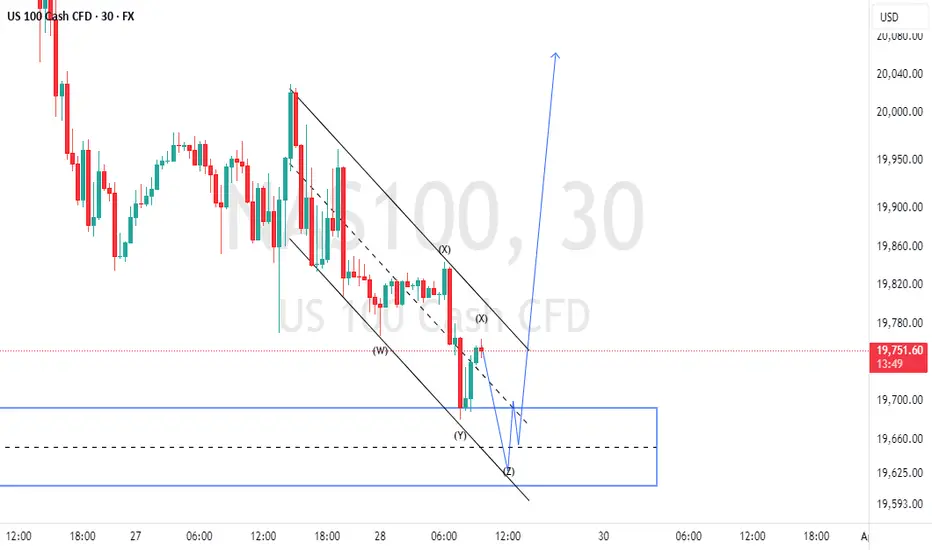
Based on 🔥Thief Trading style technical and fundamental analysis🔥, here is our master plan to heist the "NAS100/US100" Indices Market. Please adhere to the strategy I've outlined in the chart, which emphasizes long entry. Our aim is the high-risk Red Zone. Risky level, overbought market, consolidation, trend reversal, trap at the level where traders and bearish robbers are stronger. 🏆💸"Take profit and treat yourself, traders. You deserve it!💪🏆🎉
Entry 📈 : "The vault is wide open! Swipe the Bullish loot at any price - the heist is on!
however I advise to Place buy limit orders within a 15 or 30 minute timeframe most recent or swing, low or high level. I Highly recommended you to put alert in your chart.
Stop Loss 🛑:
Thief SL placed at the recent/swing low level Using the 30m timeframe (19700) swing trade basis.
SL is based on your risk of the trade, lot size and how many multiple orders you have to take.
🏴☠️Target 🎯: 20350 (or) Escape Before the Target
🧲Scalpers, take note 👀 : only scalp on the Long side. If you have a lot of money, you can go straight away; if not, you can join swing traders and carry out the robbery plan. Use trailing SL to safeguard your money 💰.
"NAS100/US100" Indices Market Heist Plan (Scalping / Day Trade) is currently experiencing a bullishness,., driven by several key factors.
📰🗞️Get & Read the Fundamental, Macro, COT Report, Geopolitical and News Analysis, Sentimental Outlook, Intermarket Analysis, Index-Specific Analysis, Positioning and future trend targets.. go ahead to check 👉👉👉
📌Keep in mind that these factors can change rapidly, and it's essential to stay up-to-date with market developments and adjust your analysis accordingly.
⚠️Trading Alert : News Releases and Position Management 📰 🗞️ 🚫🚏
As a reminder, news releases can have a significant impact on market prices and volatility. To minimize potential losses and protect your running positions,
we recommend the following:
Avoid taking new trades during news releases
Use trailing stop-loss orders to protect your running positions and lock in profits
💖Supporting our robbery plan 💥Hit the Boost Button💥 will enable us to effortlessly make and steal money 💰💵. Boost the strength of our robbery team. Every day in this market make money with ease by using the Thief Trading Style.🏆💪🤝❤️🎉🚀
I'll see you soon with another heist plan, so stay tuned 🤑🐱👤🤗🤩


KEEP TRADING SIMPLE - NDXGood Morning,
Hope all is well. We saw some rejection at the 20,288 mark. Volume is still holding in a bearish partner. Trend is now signalling a bearish pattern. I will re-evaluate any accumulation until 19,100 to see if support holds.
Currently my portfolio is 75% SQQQ. I am holding No Crypto at the moment and have 25% in stocks and etfs.
Have a great day!

NSDQ100 INTRADAY bearish reaction to US PCE data US PCE Inflation – Market Impact (NASDAQ Focus)
Headline PCE YoY: 2.5% (steady, in line with expectations).
Core PCE YoY: 2.8% (higher than 2.7% prior, above forecasts).
MoM Figures: Headline +0.3%, Core +0.4% (showing steady inflation pressure).
Market Implications for NASDAQ:
Slightly hawkish as Core PCE remains elevated—could delay Fed rate cuts.
Tech stocks (NASDAQ) may face short-term selling pressure as yields react.
If risk appetite holds, dips could present buying opportunities in growth stocks.
Watch Treasury yields & Fed commentary for further market direction.
Key Support and Resistance Levels
Resistance Level 1: 20000
Resistance Level 2: 20350
Resistance Level 3: 20650
Support Level 1: 19,440
Support Level 2: 19,140
Support Level 3: 18880
This communication is for informational purposes only and should not be viewed as any form of recommendation as to a particular course of action or as investment advice. It is not intended as an offer or solicitation for the purchase or sale of any financial instrument or as an official confirmation of any transaction. Opinions, estimates and assumptions expressed herein are made as of the date of this communication and are subject to change without notice. This communication has been prepared based upon information, including market prices, data and other information, believed to be reliable; however, Trade Nation does not warrant its completeness or accuracy. All market prices and market data contained in or attached to this communication are indicative and subject to change without notice.


NAS100 TRADE IDEALooking for buying opportunities on nas100 since on monday we gap and we came back to fill in that gap now im looking for buying pressure to take place


Nasdaq100 Update: Another Leg Down Likely After Recent Reversal?For quite some time, I have been highlighting the possibility of a strong correction in the Nasdaq 100 ( TRADENATION:USTEC ), with the 17,500 level remaining a realistic downside target.
In my more recent analyses, I argued that while a reversal from the 19,100 support zone was likely, it was merely a dead cat bounce , and the index could decline further from the 20,300-20,500 resistance zone. The lower boundary of this range was tested, and as expected, the index has started to fall again.
Although a temporary rally above 20,000 cannot be ruled out, my overall outlook remains unchanged—I still anticipate another leg down.
In conclusion, selling into rallies continues to be my preferred strategy, with 17,500 as the medium-term target.
Disclosure: I am part of Trade Nation's Influencer program and receive a monthly fee for using their TradingView charts in my analyses and educational articles.


20323.3-20647.3 The key is whether it can rise above this level
Hello, traders.
If you "Follow", you can always get new information quickly.
Please also click "Boost".
Have a nice day today.
-------------------------------------
The April TradingView competition is sponsored by PEPPERSTONE.
Accordingly, we will look at the coins (tokens) and items that can be traded in the competition.
Let's talk about the NAS100 chart.
--------------------------------------
(NAS100 1M chart)
I think the stock market is fluctuating due to the rapidly changing situation and various economic issues.
Therefore, I think it is not easy to analyze index charts such as NAS100 and US30.
However, since the HA-High indicator of the current 1M chart is newly generated and is showing a downward trend, if it does not rise above 20647.3 when the competition starts, it is likely to eventually fall.
If it falls below the M-Signal indicator of the 1M chart, it is necessary to check for support near the Fibonacci ratio range of 0.5 (15898.2) ~ 0.618 (17130.8).
-
(1D chart)
The key is whether it can receive support near 19598.6, the HA-Low indicator point of the 1D chart, and rise above the M-Signal indicator of the 1W chart.
If not, it is expected that it will eventually meet the M-Signal indicator of the 1M chart and determine the trend again.
Currently, the price is being maintained above the M-Signal indicator of the 1M chart, so it is maintaining an upward trend in the medium to long term.
Therefore, when the competition starts, you should respond depending on whether the price is being maintained above or below the M-Signal indicator of the 1D chart.
Currently, the short-term support zone is 19269.9-19598.6, and the medium to long-term resistance zone is 20323.3-20647.3.
Even if it is supported and rises in the short-term support zone, if it fails to break through the medium to long-term resistance zone, it will eventually fall.
-
Thank you for reading to the end.
I hope you have a successful transaction.
--------------------------------------------------

NQ: End of day analysis!We got another bearish day, but NO change in the structure! Price is making a HL. As long as there is no LL, we can expect anytime a move up to create a new HH.
Tariffs noises are weighing a lot and restraining the move up to 50%.
Tomorrow we have Core PCE.
1- An overshoot, cancel the 50% and price go south;
2- Inline and undershoot, the 50% is reachable and price goes north.
Monday is end of Month and Quarter. Rebalancing portfolios large hands and corporations is in play.
Good evening/night!

NASDAQ Supercycle — Welcome to the Age of Global DistributionOn the long-term chart of NASDAQ:NDX IG:NASDAQ , we are likely in Wave IV of the Supercycle, which appears to be unfolding as a running flat (rFL). The current decline may not be a mere correction, but a motive Wave C, potentially retesting the 2021 ATH zone (around 16,500–17,000) before a powerful new bullish wave begins.
Volume spikes at the top confirm the phase of global distribution, with institutional players gradually locking in profits and reducing exposure.
🧩 Base Scenario:
- We are in the final Wave C within the rFL structure.
- Once complete, a strong Wave V rally may follow.
- Key support zone: around the 2021 all-time high.
🧪 Alternative Scenario:
- This could be part of an extended Wave III of the Supercycle.
- Even so, a significant correction is expected in the near term before the next leg higher.
Structural Drivers for Long-Term NASDAQ Growth:
- 📉 Monetary policy easing from the Fed
- 💵 Fiat currency devaluation
- 🤖 Tech innovation boom — AI, biotech, semiconductors, Big Tech
- 🌍 Global digital transformation
- 🏦 Asset repricing amid structural macro shifts
📌 In conclusion, NASDAQ CME_MINI:NQ1! is entering a period of heightened volatility and capital redistribution — but its long-term upside potential remains intact.

NASDAQ INDEX (US100): Bullish Reversal Confirmed?!
I see 2 very strong bullish reversal confirmation on US100 on a daily.
First the market violated a resistance line of a falling channel.
Then, a neckline of a cup & handle pattern was broken.
Both breakouts indicate the strength of the buyers.
We can expect a growth at least to 20300 resistance.
❤️Please, support my work with like, thank you!❤️

Title: How to Spot Potential Price Reversals: Part 2A subject within technical analysis that many find difficult to apply to their day-to-day trading is the ability to spot reversals in price.
Yesterday we posted part 1 of this 2 part educational series, where we used GBPUSD as an example of how you could identify and trade a Head and Shoulders/Reversed Head and Shoulders pattern.
In today’s post we discuss a Double Top/Double Bottom, using a recent US 100 example.
Our intention is to help you understand why price activity is reversing and highlight how knowledge of this may be applied within your own individual trading strategies.
The Double Top Reversal:
The Double Top, is formed by 2 distinct price highs.
This pattern highlights the potential,
• reversal of a previous uptrend in price, into a phase of price weakness
• reversal of a previous downtrend in price into a more prolonged period of price strength.
In this example, we are going to talk about a bearish reversal in price called a Double Top.
Points to Note: A Double Top
• An uptrend in price must be in place for the pattern to form.
• A Double Top pattern is made up of 2 clear highs and one low, forming a letter ‘M’ shape on a price chart.
• This pattern reflects an inability of buyers to push price activity above a previous peak in price, potentially highlighting a negative shift in sentiment and sellers gaining the upper hand. This is regarded as a ‘weak test’ of a previous price failure high and leaves 2 price peaks at, or very close to each other.
• A horizontal trendline is drawn at the low between the 2 peaks, which highlights the neckline of the pattern. If this is broken on a closing basis, the pattern is completed, reflecting a negative sentiment shift and the potential of further price weakness.
Point to Note: To understand a bullish reversal, known as a ‘Double Bottom’ please simply follow the opposite analysis of what is highlighted above.
US 100 Example:
In the chart below, we look at the US 100 index and the formation of a Double Top pattern from earlier in 2025.
As with any bearish reversal in price, a clear uptrend and extended price advance must have been seen for the reversal pattern to be valid. On the chart above, this was reflected by the advance from the August 5th 2024 low up into the December 16th price high.
The Double Top pattern is made up of 2 price highs close or at the same level as each other, with a low trade in the middle, which forms a letter ‘M’ on the chart (see below).
In this example above, the highs are marked by 22142, the December 16th and 22226, the February 18th highs, with the 20477 level posted on January 13th represents the low traded in the middle, which helps to form the ‘M’.
The Neckline of the pattern is drawn using a horizontal line at the 20477 January 13th low, with the Double Top pattern completed on closes below this level. Potential then turns towards a more extended phase of price weakness to reverse the previous uptrend, even opening the possibility a new downtrend in price being formed.
Does the Double Top Pattern Suggest a Potential Price Objective?
Yes, it does. This can be done by measuring the height of the 2nd peak in price down to the Neckline level at that time, this distance is projected lower from the point the neckline was broken, suggesting a possible minimum objective for any future price decline.
In the example above, the 2nd high was at 22226, posted on February 18th 2025, with the Neckline at 20477, meaning the height of the pattern was 1749 (points). On February 27th the Neckline of the pattern was broken on a closing basis.
This means… 20477 – 1749 = 18728 as a minimum potential price objective for the Double Top pattern.
Of course, as with any technical pattern, completion is not a guarantee of a significant phase of price movement, with much still dependent on future sentiment and price trends.
Therefore, if initiating a trade based on a Double Top pattern, you must ALWAYS place a stop loss to protect against any unforeseen event or price movement.
This stop loss should initially be placed just above the level of the 2nd price high, as any break negates the pattern, meaning we were wrong to class the pattern as we did.
Hopefully, as prices fall after completion of the pattern, you can consider moving your stop loss lower, keeping it just above lower resistance levels to protect your position and lock in potential gains.
While both the Head and Shoulders and Double Top/Bottom patterns can take a prolonged period to form and we must be patient to wait for completion, they reflect important signals indicating potential changes in price sentiment and direction.
By understanding how and why these patterns form can offer an important insight to potential price activity that can help to support day to day decision making when deciding on trading strategies.
The material provided here has not been prepared in accordance with legal requirements designed to promote the independence of investment research and as such is considered to be a marketing communication. Whilst it is not subject to any prohibition on dealing ahead of the dissemination of investment research, we will not seek to take any advantage before providing it to our clients.
Pepperstone doesn’t represent that the material provided here is accurate, current or complete, and therefore shouldn’t be relied upon as such. The information, whether from a third party or not, isn’t to be considered as a recommendation; or an offer to buy or sell; or the solicitation of an offer to buy or sell any security, financial product or instrument; or to participate in any particular trading strategy. It does not take into account readers’ financial situation or investment objectives. We advise any readers of this content to seek their own advice. Without the approval of Pepperstone, reproduction or redistribution of this information isn’t permitted.

Tarrif shock about to hitI believe markets will go down ~10% coming days into 2nd of April. The market will not stay complacent and take profit just in case to see what will happen. Some believe Trump will cancel or postpone the tarrifs again, but he can't do that each time or people will not believe him anymore. Perhaps the big move down will be because the EU will announce their counter tarrifs against the USA.


Hanzo | Nas100 15 min Breaks – Confirm the Next Move🆚 Nas100 – The Way of the Silent Blade
⭐️ We do not predict—we calculate.
We do not react—we execute.
Patience is our shield. Precision is our sword.
🩸 market is a battlefield where hesitation means death. The untrained fall into traps, chasing shadows, believing in illusions. But we are not the crowd. We follow no signal but the one left behind by Smart Money. Their footprints are our way forward.
🩸 Bullish Structure Shatters -
Key Break Confirms the Path – 19980
reasons
Liquidity Swwep
liquidity / choch
key level / multi retest before
weekly / monthly zone
🩸 Bearish Structure Shatters
Key Break Confirms the Path – 19840 Zone
our reversal always at key level
even a reversal area is well studded
reasons
Liquidity Swwep
liquidity / choch
key level / multi retest before
weekly / monthly zone
🔻 This is the threshold where the tides shift. If price pierces this level with authority, it is no accident—it is designed. The liquidity pool above has been set, and the institutions will claim their prize. Volume must confirm the strike. A clean break, a strong push, and the path is set.
Watch the volume. Watch the momentum. Strike without doubt
