SPX500 Local Short!SPX500 went up to
Retest the horizontal
Resistance level of 5313
From where we will be
Expecting a local
Move down!
USA500 trade ideas

SPX500, PLAN 05/06After finding a new ATH on Thursday May 23, the price of the S&P500 fell by 3%.
I was a seller at the end of last week and the beginning of this week.
However, we've now reached some interesting levels that could signal a change in trend (CHoCH).
Initially, EQHs will be sought at $5302. But for me, the real CHoCH is at $5326 (the zone where I'll go back to buying).
If we look at the H1 chart, we can see that the price has returned to the OTE zone before starting to rise again.
This supports my idea of a potential return to the upside, and why not back to the ATH...
Feel free to subscribe and boost this post if you enjoyed my analysis, and tell me what you think!
Happy trading and a great week :)

SPX500 H4 | Potential resistance at 78.6% Fibonacci retracementThe SPX500 is rising towards a pullback resistance and could potentially reverse off this level to drop lower.
Sell entry is at 5,324.57 which is a pullback resistance that aligns with the 78.6% Fibonacci retracement level.
Stop loss is at 5,395.04 which is a level that aligns with the 127.2% Fibonacci extension level and sits above the all-time high.
Take profit is at 5,205.39 which is an overlap support that aligns close to the 38.2% Fibonacci retracement level.
High Risk Investment Warning
Trading Forex/CFDs on margin carries a high level of risk and may not be suitable for all investors. Leverage can work against you.
Stratos Markets Limited (www.fxcm.com):
CFDs are complex instruments and come with a high risk of losing money rapidly due to leverage. 68% of retail investor accounts lose money when trading CFDs with this provider. You should consider whether you understand how CFDs work and whether you can afford to take the high risk of losing your money.
Stratos Europe Ltd, previously FXCM EU Ltd (www.fxcm.com):
CFDs are complex instruments and come with a high risk of losing money rapidly due to leverage. 70% of retail investor accounts lose money when trading CFDs with this provider. You should consider whether you understand how CFDs work and whether you can afford to take the high risk of losing your money.
Stratos Trading Pty. Limited (www.fxcm.com):
Trading FX/CFDs carries significant risks. FXCM AU (AFSL 309763), please read the Financial Services Guide, Product Disclosure Statement, Target Market Determination and Terms of Business at www.fxcm.com
Stratos Global LLC (www.fxcm.com):
Losses can exceed deposits.
Please be advised that the information presented on TradingView is provided to FXCM (‘Company’, ‘we’) by a third-party provider (‘TFA Global Pte Ltd’). Please be reminded that you are solely responsible for the trading decisions on your account. There is a very high degree of risk involved in trading. Any information and/or content is intended entirely for research, educational and informational purposes only and does not constitute investment or consultation advice or investment strategy. The information is not tailored to the investment needs of any specific person and therefore does not involve a consideration of any of the investment objectives, financial situation or needs of any viewer that may receive it. Kindly also note that past performance is not a reliable indicator of future results. Actual results may differ materially from those anticipated in forward-looking or past performance statements. We assume no liability as to the accuracy or completeness of any of the information and/or content provided herein and the Company cannot be held responsible for any omission, mistake nor for any loss or damage including without limitation to any loss of profit which may arise from reliance on any information supplied by TFA Global Pte Ltd.
The speaker(s) is neither an employee, agent nor representative of FXCM and is therefore acting independently. The opinions given are their own, constitute general market commentary, and do not constitute the opinion or advice of FXCM or any form of personal or investment advice. FXCM neither endorses nor guarantees offerings of third-party speakers, nor is FXCM responsible for the content, veracity or opinions of third-party speakers, presenters or participants.

SPX500USD ( UPWARD PRESSURE )SPX500USD
Tendency the price is a long in 5,327
Turning level : The turning 5,327, so as long as the price trending above this level, there will be a upward
resistance level : trade above 5,327 , the price will up to 5,375, then trending in this level it will reach a new peak
support level : braking a turning level 5,327 and stable this level ,the price will reach the support level of 5,300 and 5,252 , if the price stable below 5,300 , the price change direction
to the downtrend
corrective level : price will attempt 5,327 , correct itself before long , then create a new historical price
* if the price trading above 5,327 for this week should be reach a new historical price

S&P500 Short-term accumulation before strong rise.The S&P500 index (SPX) has turned sideways since practically May 16 and, supported by the 1D MA50 (blue trend-line), is consolidating. Even though this consolidation is taking place at the top of the 1.5 year Channel Up (Fibonacci 0.0 - 0.236 range), it is similar in some way to the accumulation of April - May 2023 (also a little like November - December 2023), which was again supported by the 1D MA50.
As a result, as long as the price remains above the 1D MA100 (green trend-line), which provided the crucial Support on April 19 and started the recovery from the -6.65% decline, we expect a similar Channel Up to start when the accumulation ends. Our short-term Target is 5500 (top of 1.5 year Channel Up).
-------------------------------------------------------------------------------
** Please LIKE 👍, FOLLOW ✅, SHARE 🙌 and COMMENT ✍ if you enjoy this idea! Also share your ideas and charts in the comments section below! This is best way to keep it relevant, support us, keep the content here free and allow the idea to reach as many people as possible. **
-------------------------------------------------------------------------------
💸💸💸💸💸💸
👇 👇 👇 👇 👇 👇

SPX rising wedge into electionsClear rising wedge here supporting a slow summer meltup continuation into 5555-5638 area before election / breakdown before election
Plan is to play the wedge for continued upside into 5555+
Will flip short if 5179 is lost. If 5179 falls then a short to 4750-4820 begins.

SPX500USD ( UPWARD )SPX500USD
Tendency the price is a long in 5,327
Turning level : The turning 5,327, so as long as the price trending above this level, there will be a bullish trend
resistance level : trade above 5,327 , the price will up to 5,375, then trending in this level touch a 5,400
support level : braking a turning level 5,327 and stable this level ,the price will reach the support level of 5,300 and 5,252
corrective level : price will attempt 5,327 , correct itself before long , then create a new historical price

SPX Continues Its Bullish Trend (CPI + FED RATE)SP500 Index Technical Analysis
SPX Continues Its Bullish Trend
The price successfully retested and pushed higher, reaching our previously mentioned target.
Today's Outlook:
The market is maintaining its bullish trend, aiming for approximately 5420. The release of the CPI data today will significantly impact the market. A CPI reading below 3.4% is expected to be positive for indices, potentially driving the SPX to a new all-time high.
Bullish Scenario:
As long as trades above 5372 means will continue the bullish trend toward 5420
Bearish Scenario:
If the price trades below 5372, it indicates a potential drop towards 5347. A breach of 5347 could further lead to 5320. Stabilizing below 5301 would activate the downward area, with the next target at 5260.
- Pivot Line: 5372
- Resistance Levels: 5404, 5422, 5484
- Support Levels: 5347, 5320, 5301
Today's Expected Trading Range:
- Support: 5320
- Resistance: 5480
In summary, maintaining a position above 5347 favors a bullish outlook, aiming for higher resistance levels. Conversely, trading below 5347 suggests a bearish trend, with potential support targets at 5320 and 5301.
Our Previous idea:

Fed Expected to Hold Rates Amid Mixed Economic IndicatorsFed Expected to Hold Rates Amid Mixed Economic Indicators
Focus on CPI Data and Rate Decision:
Wednesday's U.S. Consumer Price Index (CPI) data and the Federal Reserve's interest rate decision are in the spotlight. This follows rate cuts by the Bank of Canada and the European Central Bank last week. However, the Fed is not expected to follow suit—at least not immediately.
CPI Growth Expectations:
U.S. CPI growth for May is anticipated to remain steady at 3.4% year-over-year. Energy prices likely declined in May as oil prices edged lower, while core CPI (excluding food and energy) is expected to decrease slightly to 3.5% from 3.6% in April. This reflects a more normal 0.2% month-over-month increase. Additionally, home rent price growth is projected to slow, alongside a decrease in the core services ex-rent measure that Fed policymakers closely monitor. In April, this measure increased by 0.4%, down from an average of 0.7% per month over the first quarter of the year.
Inflation Pressure Measures:
The diffusion index, which gauges the breadth of inflation pressures, has shown little improvement recently. Fed policymakers believe the current interest rates are restrictive enough to eventually bring inflation back to the 2% target. Firm U.S. employment numbers in May, including a slight increase in wage growth, indicate no immediate pressure on the Fed to lower rates.
Interest Rate Outlook:
Our base case scenario suggests that the Fed will not be in a position to cut interest rates until December. This assumption hinges on the expectation that economic growth and inflation will slow in the coming months.
Technical Analysis: SP500 Index Outlook
Weekly Chart Analysis:
The SP500 index recently retested its support line at 5260, stabilizing in a bullish zone. This suggests a continuation of the upward trend towards targets of 5423 and 5500, particularly if the CPI comes in below 3.4%.
Bullish Scenario:
As long as the price remains above 5260, the bullish trend is expected to continue, targeting 5425 and 5500, potentially reaching a new all-time high.
Bearish Scenario:
For a bearish trend to emerge, the price must fall below the support line at 5260, which could then lead to targets of 5040 and 4923.
Key Levels:
Pivot Price: 5320
Support Levels: 5260, 5193, 4930
Resistance Levels: 5423, 5520, 5600
Trading Range:
The price is anticipated to fluctuate between the resistance at 5525 and the support at 5260.
Overall Tendency:
The outlook appears bullish.

SPX Continues Bullish Trend After RetestSPX Continues Bullish Trend After Retest
The SPX has completed its retest and subsequently pushed higher, maintaining its bullish trend. As long as the index trades above the key levels of 5347 and 5320, the bullish momentum is expected to continue. This week, the SPX is projected to reach the initial target of 5378, with the potential to advance further towards 5423.
Bullish Scenario:
the price has a bullish trend to reach 5378 as long as trades above 5347, breaking 5378 means will continue the bullish trend to get 5423
Bearish Scenario:
If the price trades below 5347, it indicates a potential drop towards 5320. A breach of 5320 could further lead to 5301. Stabilizing below 5301 would activate the bearish area, with the next target at 5260.
Key Level
- Pivot Line: 5347
- Resistance Levels: 5378, 5400, 5423
- Support Levels: 5320, 5301, 5260
Today's Expected Trading Range:
- Support: 5320
- Resistance: 5420
In summary, maintaining a position above 5347 favors a bullish outlook, aiming for higher resistance levels. Conversely, trading below 5347 suggests a bearish trend, with potential support targets at 5320 and 5301.

SPX - Waiting for ADP and ISM SPx
The price already pushed up and reached our price we mentioned which is 5301, due to the JOLTs result was Negative results, so today also we have ADP and ISM that remain Negative results expectation, so depending on the news expected the direction should be bullish trend,
However, it tries to continue its bullish trend to get 5320, then the movement will be between 5320 and 5302
Bullish scenario: as long as the price trades above 5302 means will continue the bullish trend toward 5320 and above it will be 5347
Bearish scenario: should be stabilized under 5301 to get 5260, and stabilize 1h candle under 5260 means will drop to get 5226
Pivot line: 5302
Resistance line: 5320, 5347, 5390
Support line: 5260, 5226, 5193
The price will move between Support 5284 and Resistance 5347

S&P500 - Possible Short Term Top in. OANDA:SPX500USD is looking like its in the end of the move higher. Thursday/Friday were very slow after the early week rally even with NFPs giving things a spike.
now we look for Monday to give us some clues for the next move.
Option 1 - We get a move down to 5320 before one more high up to 5400 area.
Option 2 - The top is in on this run from the April low and we get a deeper PB down towards 5200 followed by another ATH around 5500.
Option 3 - But less likely, it holds Fridays lows and we get one more run up to 5400 then a deeper correction.
Things to watch going into this week with Inflation data Wednesday/Thursday and the next Interest rate decision out of the US Wednesday were they are expected to keep things at the same level.
I will also post expected intra-day movements throughout the week.
Enjoy the week, watch for Monday clues.

S&P500 The structure is completeYes. It's over. Full five waves have been developed to complete all the upside movement from the October 2022 bottom. The S&P500 has now completed 5 waves from October 2022 and has completed 5 waves from March 2009. The market is going to see a very deep and long correction.

Market Crash - SPX Ascending Wedge From 2018.Not only do we have bearish patterns on some shorter term time frames, but we're also seeing it on much larger term time frames as well. This is yet another ascending wedge, but this time it's one that has formed over a 5-6 year period. If it is broken to the downside, the move will most likely be substantial, but it may take a while. Analyzing a 1 week chart showing the past 20 years is a completely different story than what you would see on a 1hr chart showing the last 20 days.
www.investopedia.com

USSPX ( BULLISH TREND PRESSURE )USSPX
Tendency the price is a long in 5,336
Turning level : The turning 5,336, so as long as the price trending above this level, there will be a bullish trend
resistance level : trade above 5,336 , the price will up to 5,375, then trending in this level touch a 5,400
support level : braking a turning level 5,336 ,the price will reach the support level of
5,300 and 5,252
corrective level : price will attempt 5,336 , correct itself before long , then create a new historical price

SP500 Index Technical AnalysisSP500 Index Technical Analysis
The SP500 index appears poised for a retest of the 5320 level. A break below 5320 would likely lead the index to touch 5301.
Bullish Scenario:
For the bullish trend to continue, the price must stabilize above 5347. If it does, the next target will be 5375. Breaking through 5375 could lead to new record highs.
Bearish Scenario:
If the price trades below 5347, it indicates a potential drop towards 5320. A breach of 5320 could further lead to 5301. Stabilizing below 5301 would activate the bearish area, with the next target at 5260.
Key Levels:
- Pivot Line: 5347
- Resistance Levels: 5378, 5400, 5423
- Support Levels: 5320, 5301, 5260
Today's Expected Trading Range:
- Support: 5301
- Resistance: 5375
In summary, maintaining a position above 5347 favors a bullish outlook, aiming for higher resistance levels. Conversely, trading below 5347 suggests a bearish trend, with potential support targets at 5320 and 5301.

$SPX Trading Range for 6.10.24 for Day Traders SP:SPX Trading Range for 6.10.24 for Day Traders
So I am looking for a way to get the transcripts from my nightly video on to here but for tonight no success so if you need the video walkthrough it’s on tonight’s the video. I will work on that for sure, though!!
No economic data today, but Wednesday we have CPI & FOMC, Thursday we have PPI, and Friday Consumer Sentiment and Industrial Inflation
Happy Trading today, y’all!!

Are we heading into euphoria or a technical reset?Here we can clearly see that the market structure keeps trending up, in very aggressive manners. Many technical resets have been made, and recently we went through one that lasted almost the entire Biden administration. Even though this reset is great for price action, it seems that it is quickly becoming parabolic. If price continues to behave in this manner, then we could be headed into euphoria. It's crazy to think that the yield curve has been inverted for this long.
Failure to reset technicals could bring us into a period with great short term yield. This could potentially captivate novice traders to become overconfident. Start paying attention to people around you if we keep on trending upward. Is your common foe suddenly talking about stocks and investments? I personally don't feel that way yet. But I can't deny the excitement people feel of finally reaching new time highs.
I'm not saying we are heading into a crash right now. But technicals and fundamentals are beginning to line up for what seems to be extreme optimism with flashing warning signs. I don't feel too confident in this market and would prefer to be buying at lower prices and see price trend up slower. A reset is necessary, or else we will be headed into an unhealthy and very violent uptrend.

SPX - Summer of painSPX has topped on a weekly timeframe and should give a ~10% drop. Now, it is highly likely that we are also seeing a top of much higher degree from '08 lows, but will judge that for later. Step by step. SP:SPX

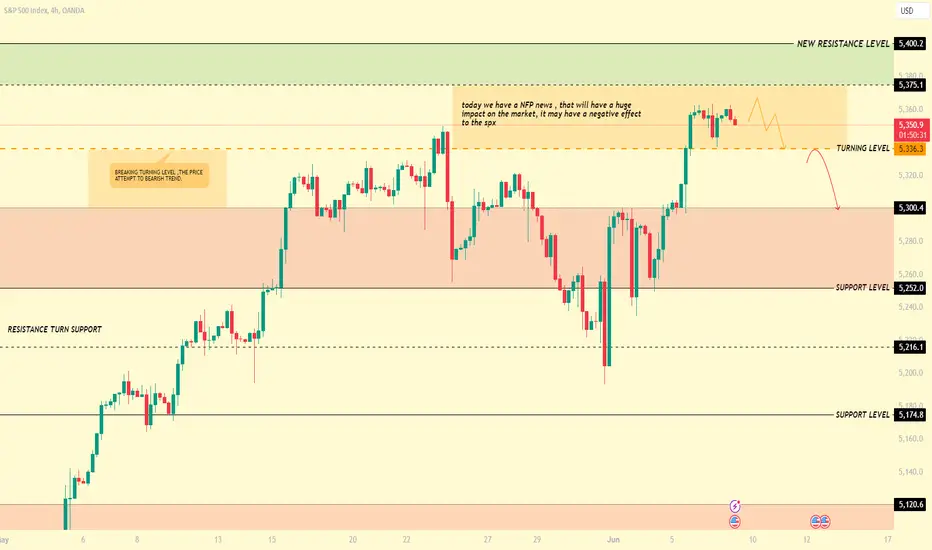
SPX500USD ( EFFECT NFP )SPX500USD
Tendency the price effect downward pressure
Turning level : The turning 5,336, so as long as the price trending above this level, there will be a bullish trend , but breaking this level the price it comes down ward pressure
resistance level : trade above 5,336 , the price will up to 5,375, then trending in this level touch a 5,400
support level : braking a turning level 5,336 ,the price will reach the support level of
5,300 and 5,252
* today we have a NFP , news I urge the trader to trading very carefully
US500RSI indicates Bearish Divergence. Which means that at any time the market trend can change to LL and LH.

What happens when everyone's looking at the same trendline?I think we overthrow the trendline for a massive bull trap.

$SPX Trading range for CPI & FOMC, and PPI tomorrowCBOE:SPX TVC:VIX Trading range for today and tomorrow and the video version here!! GL today, y'all.
Inflation is still unacceptably high. The FED really needs to see DEFLATION before cutting rates.
Video version has the full walkthrough.
🚨Don't forget to subscribe & turn on notifications in case I forget to cross post here.
