WTI Crude Oil Analysis – Is a Major Wave 3 About to Begin?🛢 WTI Crude Oil Analysis – Is a Major Wave 3 About to Begin? 🚀
According to Elliott Wave count, it appears that the corrective Wave 2 has either completed or is in its final stages. The (ABC) corrective structure, combined with reactions to key Fibonacci levels, suggests a potential end to the correction and the start of a powerful Wave 3.
Key Fibonacci Support Levels:
📍 $60.39 – 50% retracement
📍 $58.84 – 78.6% retracement
As long as price holds above these levels, the bullish structure remains intact, with the ultimate target for Wave 3 projected well above the previous all-time highs.
💬 What’s your view? Is crude oil ready for a historic move, or is there still room for more correction?
✅ Save this idea & follow for future updates.
-------------------------------------------------------------------------------------------------------------------
🚀 Who am I?
I'm Mahdi, a prop firm trader with 7+ years of experience in technical analysis, mainly focusing on Smart Money Concepts and Elliott Wave theory.
I specialize in delivering high-quality trading signals, market insights, and educational content tailored for serious traders and investors.
📊 My Tools: SMC, Elliott Wave, Fibonacci, Liquidity Grabs, Order Blocks
💼 Prop Challenge Passed: Yes | Funded Account: In Progress
🔗 Follow for consistent updates and trading insights.
CFDs on WTI Crude Oil
63.58USD / BLLR
−0.27−0.42%
As of today at 17:30 GMT
USD / BLL
No trades
USOIL trade ideas

USOIL Sellers In Panic! BUY!
My dear subscribers,
USOIL looks like it will make a good move, and here are the details:
The market is trading on 63.34 pivot level.
Bias - Bullish
My Stop Loss - 63.05
Technical Indicators: Both Super Trend & Pivot HL indicate a highly probable Bullish continuation.
Target - 63.89
About Used Indicators:
The average true range (ATR) plays an important role in 'Supertrend' as the indicator uses ATR to calculate its value. The ATR indicator signals the degree of price volatility.
Disclosure: I am part of Trade Nation's Influencer program and receive a monthly fee for using their TradingView charts in my analysis.
———————————
WISH YOU ALL LUCK

USOIL BEST PLACE TO BUY FROM|LONG
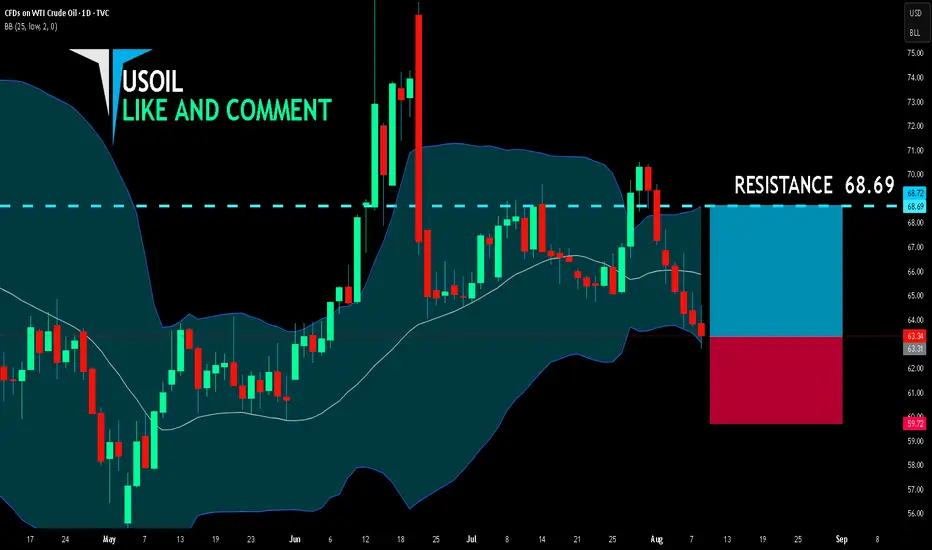
USOIL SIGNAL
Trade Direction: long
Entry Level: 63.31
Target Level: 68.69
Stop Loss: 59.72
RISK PROFILE
Risk level: medium
Suggested risk: 1%
Timeframe: 1D
Disclosure: I am part of Trade Nation's Influencer program and receive a monthly fee for using their TradingView charts in my analysis.
✅LIKE AND COMMENT MY IDEAS✅

OIL - shortFollowing our previous forecasted up-move, from now on we will switch to looking for sell setups only. We would normally expect the C wave of the corrective pattern retrace all the way to the 0.618 fib of the downward impulse, as the A wave had already retraced to the 0.382. But that isn't necessarily always the case. As long as the C retracement has broken the top of the A retracement, the pattern formally speaking can be complete. We will not be looking for further buys, therefore, from now on. Even if it does continue to the 0.618, we will skip the eventual buy and focus on the sells. At the same time, because the eventuality of more up exists, we will wait for a proper sell setup before we enter any short position. Updates will follow.

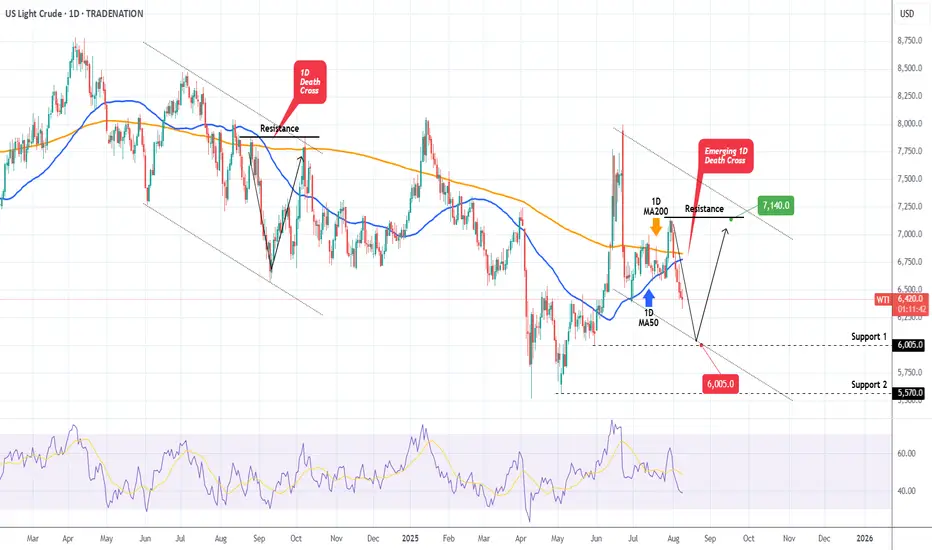
WTI OIL on its first 1D Death Cross since Sep 2024!WTI Oil (USOIL) is on the decline and is about to form a 1D Death Cross for the first time since September 06 2024! That is technically a bearish signal but last time once completed, the market formed a bottom 2 days later.
As a result, we expect a max drop to Support 1 ($60.05) but then more likely a rebound back to the Resistance ($71.40), especially given the fact that the 1D RSI will almost get oversold (>30.00).
-------------------------------------------------------------------------------
** Please LIKE 👍, FOLLOW ✅, SHARE 🙌 and COMMENT ✍ if you enjoy this idea! Also share your ideas and charts in the comments section below! This is best way to keep it relevant, support us, keep the content here free and allow the idea to reach as many people as possible. **
-------------------------------------------------------------------------------
Disclosure: I am part of Trade Nation's Influencer program and receive a monthly fee for using their TradingView charts in my analysis.
💸💸💸💸💸💸
👇 👇 👇 👇 👇 👇
Is oil price heading back up? Watching a potential inverse head and shoulders forming on the 30-minute chart for Oil.
🔹 Risk/Reward: 2.7
🔹 Entry: 63.290
🔹 Stop Loss: 63.043
🔹 Take Profit 1 (50%): 63.93
🔹 Take Profit 2 (50%): 64.21
A couple of key factors still need to align before I pull the trigger:
• One will confirm around 14:45 SAST (GMT+2)
• Looking for lower volume on the right shoulder compared to the left
What do you think? Is oil ready to push higher?
Drop your thoughts or how you trade inverse head and shoulders below! 👇

Crude oil under pressure as geopolitical talks developCrude oil confirms the bearish trend, having pressured from intermediate-term peak. The fair price, according to the STEO forecast, stays at around $60 and that level might be perceived as a target area for the current price swing.
Geopolitical agenda adds more pressure on oil, as Steve Witkoff, the special negotiator from Donald Trump’s team, has visited Moscow and had a positive effect from talks with Vladimir Putin. Next week, markets will look forward to potential three-sided talks between Ukraine, Russia and the US. This situation adds more pressure to the already bearish Crude oil market.
One may think of cautious short positions in the direction of a price swing, closing it before “the news”.
Don't forget - this is just the idea, always do your own research and never forget to manage your risk!
USOIL Is Going Up! Buy!
Take a look at our analysis for USOIL.
Time Frame: 1D
Current Trend: Bullish
Sentiment: Oversold (based on 7-period RSI)
Forecast: Bullish
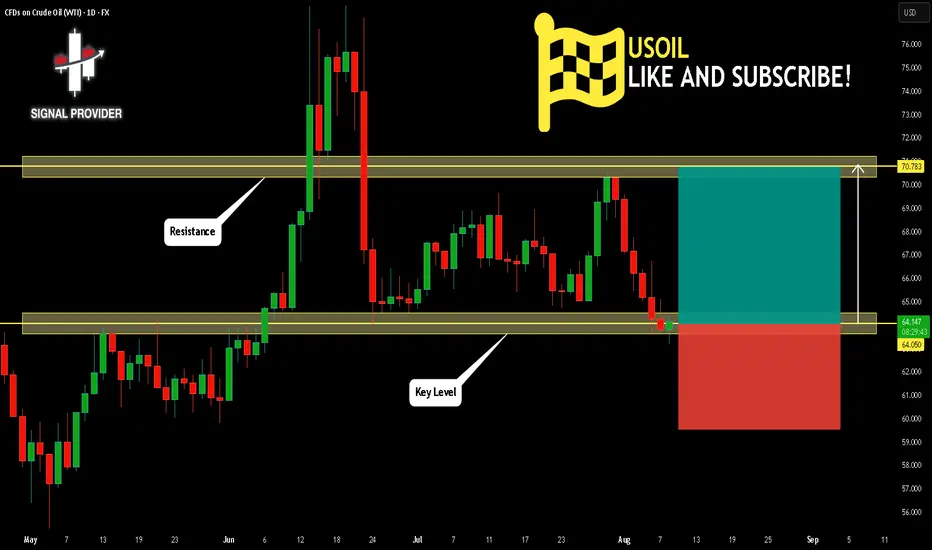
The market is approaching a key horizontal level 64.050.
Considering the today's price action, probabilities will be high to see a movement to 70.783.
P.S
Please, note that an oversold/overbought condition can last for a long time, and therefore being oversold/overbought doesn't mean a price rally will come soon, or at all.
Disclosure: I am part of Trade Nation's Influencer program and receive a monthly fee for using their TradingView charts in my analysis.
Like and subscribe and comment my ideas if you enjoy them!
Crude oil next move (expecting mild bullish move) (08-08-2025)Go through the analysis carefully, and do trade accordingly.
Anup 'BIAS for the mid term (08-08-2025)
Current price- 63.400
"if Price stay above 62.00 then next target is 64.400, 66.00 and 70.00 and below that 58.00"
-POSSIBILITY-1
Wait (as geopolitical situation are worsening )
-POSSIBILITY-2
Wait (as geopolitical situation are worsening)
Best of luck
Never risk 2% of principal to follow any position.
Support us by liking and sharing the post.

Crude Oil (WTI / USOIL) Analysis:Crude oil is currently trading near a short-term resistance area at $64.00, while the overall trend remains bearish.
🔻 Bearish Scenario:
If the price breaks below $63.25 and holds beneath it, we could see a move toward the $62.00 support level.
🔺 Bullish Scenario:
If the price regains strength and breaks above $64.00, it may retest the $65.00 level. With continued bullish momentum, it could reach as high as $66.30.
⚠️ Disclaimer:
This analysis is not financial advice. It is recommended to monitor the markets and carefully analyze the data before making any investment decisions.

WTI: Oil Markets on Edge Despite Trump Considering Major TariffsOil prices could drop if Trump backs down on tariffs on countries buying Russian oil, but short-term bullish catalysts, like geopolitical tensions and bullish speculative bets, may still push prices up before longer-term headwinds take hold.
----------------------------------------------------------------------------------------------------------------------
Trump’s threats of steep tariffs on countries buying Russian oil have sent oil prices surging, as traders fear a global supply crunch if Russian barrels are cut off.
But here’s the twist: Trump has a history of backing down or delaying tariffs after using them as leverage. When he does, oil prices usually fall, as the immediate risk of supply disruption fades.
If he caves in again by the deadline, which is 10 to 12 days from 4 August, or extends it, oil prices could drop. The bigger picture also appears bearish: OPEC+ is ramping up supply, global demand is slowing and expected to drop in H2, and inventories are rising (first glimpse by EIA, Wed).
But with the deadline falling around 14–16 August, 2025, short-term bullish catalysts could spark a rally up to the 38.2%-61.8 % Fibonacci retracement levels, positioning WTI better for declines (conditional on Trump!).
This content is not directed to residents of the EU or UK. Any opinions, news, research, analyses, prices or other information contained on this website is provided as general market commentary and does not constitute investment advice. ThinkMarkets will not accept liability for any loss or damage including, without limitation, to any loss of profit which may arise directly or indirectly from use of or reliance on such information.

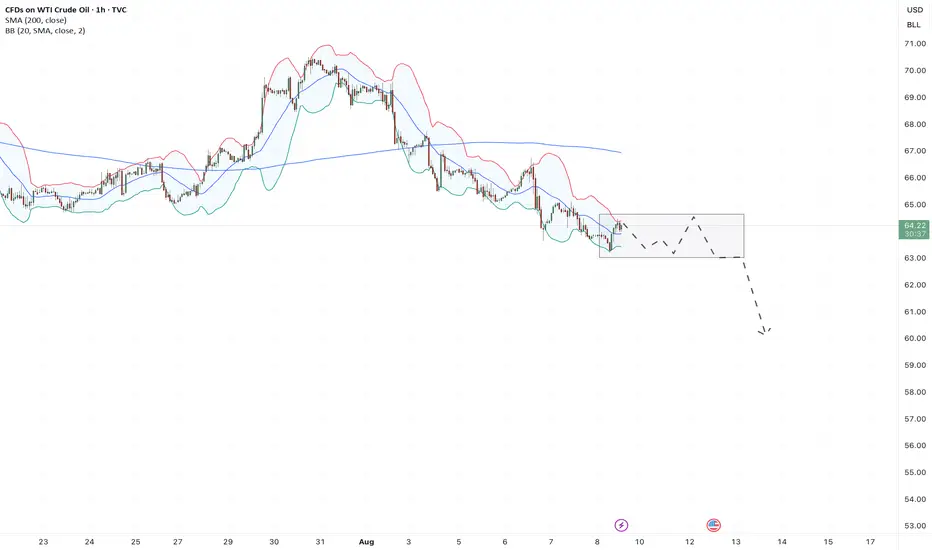
Oil continues to decline due to geopolitics optimismOil continues to decline due to geopolitics optimism
A Kremlin official announced that Presidents Trump and Putin will hold a summit soon, their first since 2021, with a White House source suggesting it could occur as early as next week. Optimism surrounding potential U.S.-Russia discussions on the Ukraine conflict has alleviated concerns about oil supply disruptions, despite U.S. sanctions targeting India for its continued Russian crude imports. Trump introduced a 25% tariff on Indian goods and signaled possible additional tariffs on China. However, increased OPEC production and ongoing trade tensions remain key concerns, raising fears of slower economic growth and reduced demand.
Technically, USOIL trades just above the 6,300.00 support level. Insignificant rebound from this level is expected with possible decline towards crucial 6,000.00 support level.

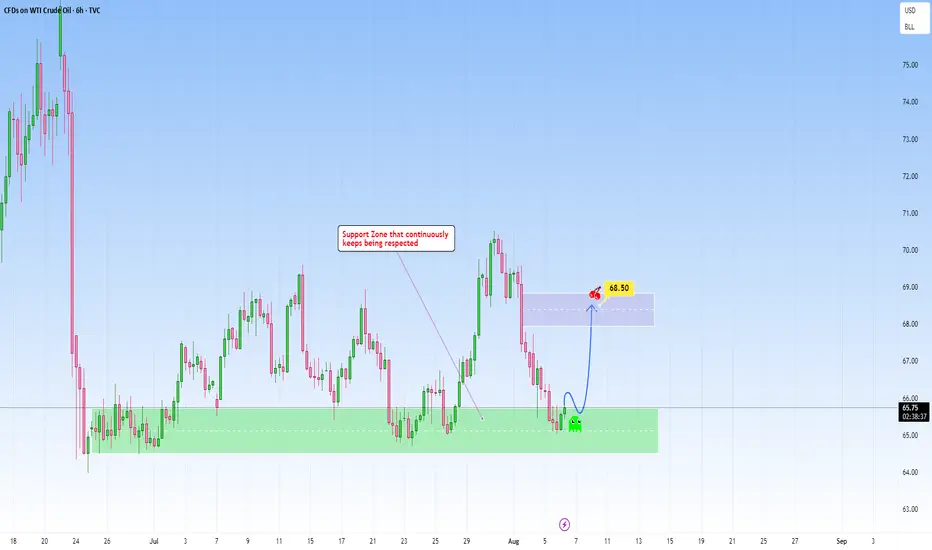
USOIL: Respecting support, repeating opportunity The chart on USOIL presents a compelling technical setup that blends structure, behavioral dynamics. The core technical analysis here lies in this support zone that is well-defined area that has been tested multiple times and consistently held, suggesting strong demand.
The narrative structure is one of rebound. Every time price approaches the support zone, the reaction is not only immediate but also structured, price responds with conviction.
So I am recognizing the strength of the reaction and forecasting an upward move to the 68.50 level.
The target at 68.50 is achievable, acting as both a profit objective and a psychological level, round enough to attract attention and previously strong enough to cause a drop. If momentum sustains, a breakout from there would depend on volume confirmation and structure shifts, but for now, the play back into that range makes sense and respects both the chart’s geometry and price action logic.
Not reacting to noise, but to repeatable high-probability zones.

WTI crude spotafter breaching 65.238 wti get more weaker as its wave 3 or c open and may take it to 57-58 $ but one bearish crab again also appear may develop. Levels in chart, sell on rally market but near that level with sl and buy signal one can see reversal. I am not Sebi registered analyst. This is not buy , sell hold recommendation.

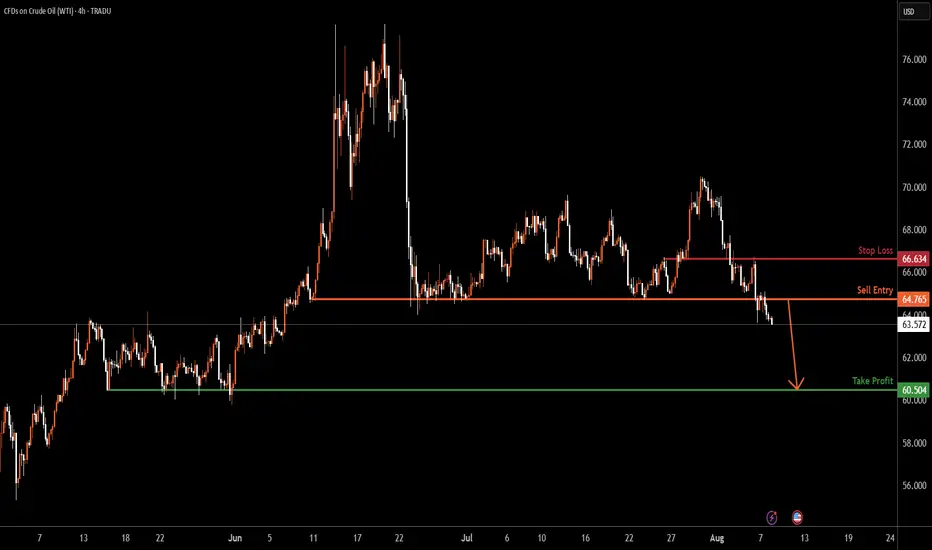
USOIL H4 | Potential bearish dropUSOIL has rejected the sell entry which has been identified as a pullback resistance and could drop from this level to the downside.
Sell entry is at 64.76, which is a pullback resistance.
Stop loss is at 66.63, which is an overlap resistance.
Take profit is at 60.50, which is a multi-swing low support.
High Risk Investment Warning
Trading Forex/CFDs on margin carries a high level of risk and may not be suitable for all investors. Leverage can work against you.
Stratos Markets Limited (tradu.com ):
CFDs are complex instruments and come with a high risk of losing money rapidly due to leverage. 65% of retail investor accounts lose money when trading CFDs with this provider. You should consider whether you understand how CFDs work and whether you can afford to take the high risk of losing your money.
Stratos Europe Ltd (tradu.com ):
CFDs are complex instruments and come with a high risk of losing money rapidly due to leverage. 66% of retail investor accounts lose money when trading CFDs with this provider. You should consider whether you understand how CFDs work and whether you can afford to take the high risk of losing your money.
Stratos Global LLC (tradu.com ):
Losses can exceed deposits.
Please be advised that the information presented on TradingView is provided to Tradu (‘Company’, ‘we’) by a third-party provider (‘TFA Global Pte Ltd’). Please be reminded that you are solely responsible for the trading decisions on your account. There is a very high degree of risk involved in trading. Any information and/or content is intended entirely for research, educational and informational purposes only and does not constitute investment or consultation advice or investment strategy. The information is not tailored to the investment needs of any specific person and therefore does not involve a consideration of any of the investment objectives, financial situation or needs of any viewer that may receive it. Kindly also note that past performance is not a reliable indicator of future results. Actual results may differ materially from those anticipated in forward-looking or past performance statements. We assume no liability as to the accuracy or completeness of any of the information and/or content provided herein and the Company cannot be held responsible for any omission, mistake nor for any loss or damage including without limitation to any loss of profit which may arise from reliance on any information supplied by TFA Global Pte Ltd.
The speaker(s) is neither an employee, agent nor representative of Tradu and is therefore acting independently. The opinions given are their own, constitute general market commentary, and do not constitute the opinion or advice of Tradu or any form of personal or investment advice. Tradu neither endorses nor guarantees offerings of third-party speakers, nor is Tradu responsible for the content, veracity or opinions of third-party speakers, presenters or participants.


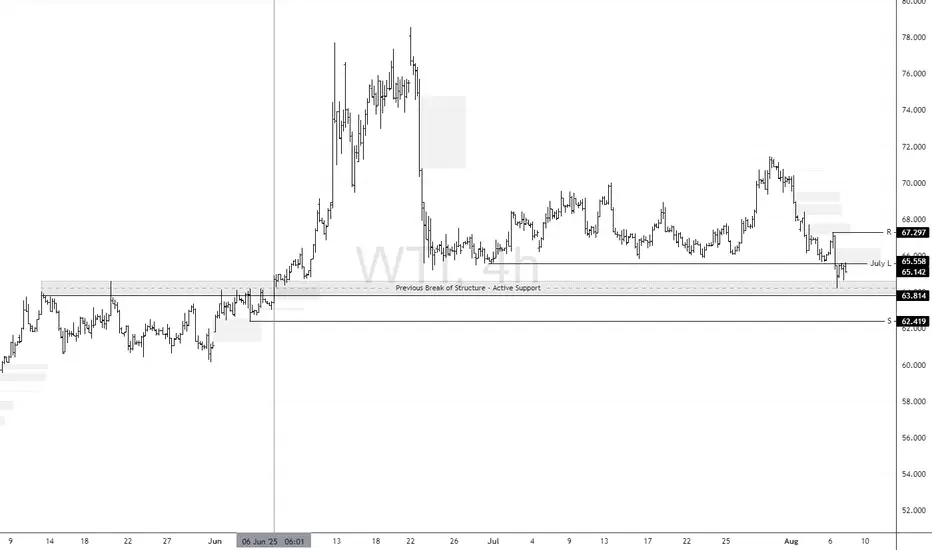
Oil Left Bulls Bruised and Bankrupt: A Silver Lining for RecoverFenzoFx—Crude Oil remains bearish, taking out bulls and breaking July's low this week—an unexpected move for the month. WTI Crude currently trades near $65.2, aligning with its prior market structure shift from bearish to bullish, marked by a bullish engulfing on June 6.
Forecast : Immediate resistance stands at July's low of $65.5. If price breaks above, Oil may begin to recover some losses. Technically, the next upside target is the order block at $67.29.
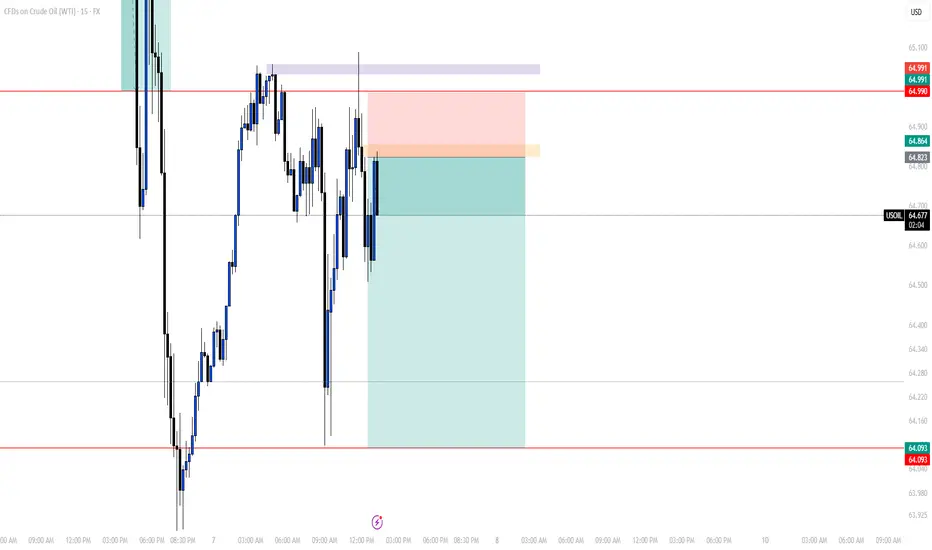
UPDATE ON THIS MORNING'S TRADEEarly in the morning, I posted a trade (Sell USOIL) in which we trargeted the LQ level which the market came closer to and didn't touch, which isn't a big deal.
As you can see on the chart, as I told my students during the LIVE TRADING SESSION they assisted, it's all about trade management.
On the screenshot on the left, we added another order at 50% lvl of the FVG, xhich the market respected at that moment before giving us a double bottom which is a sign to the change of the movement of the market.
For a safe closure of the trade, as you can see in the picture on the left, we waited for the market to break through the 5min LQ we have to close, and that's what exactly happened.
We'll wait for another trade to take later in the US session.
Follow for more!

Crude Oil (WTI / USOIL) Analysis:Crude oil is currently trading near a short-term support zone around $64.70.
🔻 Bearish Scenario:
If the price breaks below $64.00 and holds beneath it, we could see a decline toward $63.60 as the first target, followed by $62.00 as a secondary target.
🔺 Bullish Scenario:
On the other hand, if the price regains bullish momentum and breaks above $65.00, we may see a retest of the $66.70 area, and with continued buying pressure, a potential move toward $67.50.
⚠️ Disclaimer:
This analysis is not financial advice. It is recommended to monitor the markets and carefully analyze the data before making any investment decisions.
