Crude oil prices test 10-week highs amid trade optimism!Crude oil prices are testing fresh 10-week highs today, with WTI futures flirting with the key resistance level at $65.50, a price not seen since the onset of trade tariff tensions in early April.
Investor sentiment remains cautiously optimistic as US-China trade talks continue in London this week, raising hopes that both parties can make progress toward a resolution on tariffs and trade restrictions. A positive outcome could further boost crude oil prices.
Seasonal factors are also playing a supportive role. The onset of the summer travel season in the northern hemisphere is expected to drive increased demand for crude, adding a bullish layer to the outlook. Energy traders are closely watching for signs that a successful trade agreement could trigger a sustained rally.
From a technical perspective, WTI bids have peaked near $65.50, although further upside appears constrained by the 200-day EMA, which is acting as a firm resistance level. However, a potential inverse head and shoulders pattern is forming, which could support a breakout and add further confidence to bullish positions.
On the downside, failure to breach the $65.50 resistance may invite selling pressure, with a potential re-test of the $60.00 support level if momentum weakens.
USOILSPOT trade ideas

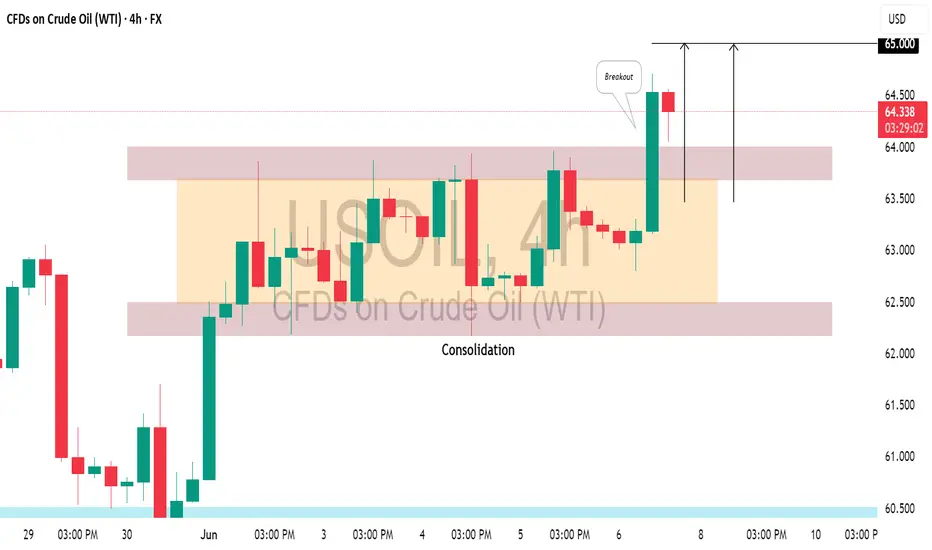
US CRUDE OIL(#WTI) : Bullish Trend Continues📈USOIL is trading in a bullish trend on a 4H time frame.
After a prolonged upward movement, it started to consolidated within a horizontal range for a while.
Recently, the resistance of this range was breached, indicating strong buyer momentum.
I believe the upward movement may persist, potentially leading the market to reach the 65.00 level soon.
Hellena | Oil (4H): SHORT to support area of 58.00.Colleagues, the previous forecast did not meet expectations for too long, and the price has been in a prolonged sideways movement.
In this regard, I decided to slightly revise the waves and make a new forecast.
At the moment, I believe that the price will resume its downward movement in the medium-term wave “3.” The complex configuration of the correction makes it difficult to fully understand whether it is a combined correction or a five-wave movement.
In either case, I expect the price to reach the support area of 58.00.
Manage your capital correctly and competently! Only enter trades based on reliable patterns!

Crude oil next move (expecting bullish move) (09-06-2025)Go through the analysis carefully, and do trade accordingly.
Anup 'BIAS for the mid term (09-06-2025)
Current price- 65.00
"if Price stay above 62.00 then next target is 70.00, 80.00 and 90.00 and below that 55.00
-POSSIBILITY-1
Wait (as geopolitical situation are worsening )
-POSSIBILITY-2
Wait (as geopolitical situation are worsening)
Best of luck
Never risk 2% of principal to follow any position.
Support us by liking and sharing the post.

Bullish momentum to extend?WTI/Oil (XTI/USD) is falling towards the pivot which is a pullback support and could bounce to the 1st resistance.
Pivot: 63.32
1st Support: 61.18
1st Resistance: 65.80
Risk Warning:
Trading Forex and CFDs carries a high level of risk to your capital and you should only trade with money you can afford to lose. Trading Forex and CFDs may not be suitable for all investors, so please ensure that you fully understand the risks involved and seek independent advice if necessary.
Disclaimer:
The above opinions given constitute general market commentary, and do not constitute the opinion or advice of IC Markets or any form of personal or investment advice.
Any opinions, news, research, analyses, prices, other information, or links to third-party sites contained on this website are provided on an "as-is" basis, are intended only to be informative, is not an advice nor a recommendation, nor research, or a record of our trading prices, or an offer of, or solicitation for a transaction in any financial instrument and thus should not be treated as such. The information provided does not involve any specific investment objectives, financial situation and needs of any specific person who may receive it. Please be aware, that past performance is not a reliable indicator of future performance and/or results. Past Performance or Forward-looking scenarios based upon the reasonable beliefs of the third-party provider are not a guarantee of future performance. Actual results may differ materially from those anticipated in forward-looking or past performance statements. IC Markets makes no representation or warranty and assumes no liability as to the accuracy or completeness of the information provided, nor any loss arising from any investment based on a recommendation, forecast or any information supplied by any third-party.

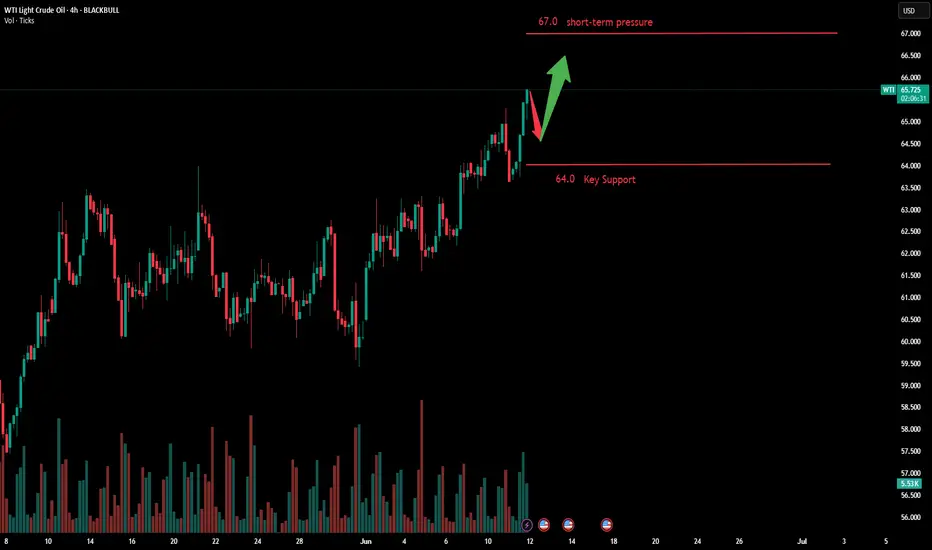
"Go long on crude oil with strong unilateral pullback"The market is weighing the impact of global trade tensions on the global crude oil demand outlook. After two days of intense consultations in London, the Asian giant and the U.S. have reached a framework agreement on restarting trade talks. U.S. Commerce Secretary Howard Lutnick said after the negotiations that the framework still needs review and approval from President Trump. Crude oil continued to rise after a pullback correction, showing a single bearish candlestick retracement pattern on the daily chart. With price supported at the MA5 level, it continues to make new highs, and this rally could target the 67.0 level.
Humans need to breathe, and perfect trading is like breathing—maintaining flexibility without needing to trade every market swing. The secret to profitable trading lies in implementing simple rules: repeating simple tasks consistently and enforcing them strictly over the long term.
Trading Strategy:
buy@64.0-64.5
TP:66.5-67.0
USOILThe correlation between USOIL (WTI crude oil prices) and DXY (US Dollar Index) has historically been inverse, but structural shifts in global energy markets and economic dynamics are altering this relationship.
Oil is globally traded in USD. A stronger dollar makes oil more expensive for buyers using other currencies, potentially dampening demand and lowering oil prices. Conversely, a weaker dollar makes oil cheaper, boosting demand and prices.
Trade Balance Impact:
Historically, the U.S. was a net oil importer. Rising oil prices worsened its trade deficit, weakening the dollar. This reinforced the inverse correlation.
Recent Structural Shifts
U.S. as a Net Oil Exporter:
Since becoming the world’s largest crude oil producer (surpassing Saudi Arabia and Russia), higher oil prices now improve the U.S. trade balance by boosting export revenue. This has weakened the traditional inverse relationship
Geopolitical risks: Oil supply fears and safe-haven dollar demand can push both higher.
Federal Reserve Policy:
Hawkish monetary policies that strengthen the dollar can suppress oil prices, but if paired with strong U.S. growth (supporting oil demand), the correlation may turn neutral or positive.
Positive correlations may persist during risk-off events or U.S.-centric demand surges.
Inverse correlations likely resurface if global growth slows or the Fed pivots dovish.
The U.S. dollar may increasingly behave like a "petrocurrency," strengthening with oil prices as exports grow.
#usoil

Heading into 61.8% Fibonacci resistance?WTI Oil (XTI/USD) is rising towards the pivot which is a pullback resistance and could drop to the 1st support.
Pivot: 66.66
1st Support: 60.10
1st Resistance: 71.18
Risk Warning:
Trading Forex and CFDs carries a high level of risk to your capital and you should only trade with money you can afford to lose. Trading Forex and CFDs may not be suitable for all investors, so please ensure that you fully understand the risks involved and seek independent advice if necessary.
Disclaimer:
The above opinions given constitute general market commentary, and do not constitute the opinion or advice of IC Markets or any form of personal or investment advice.
Any opinions, news, research, analyses, prices, other information, or links to third-party sites contained on this website are provided on an "as-is" basis, are intended only to be informative, is not an advice nor a recommendation, nor research, or a record of our trading prices, or an offer of, or solicitation for a transaction in any financial instrument and thus should not be treated as such. The information provided does not involve any specific investment objectives, financial situation and needs of any specific person who may receive it. Please be aware, that past performance is not a reliable indicator of future performance and/or results. Past Performance or Forward-looking scenarios based upon the reasonable beliefs of the third-party provider are not a guarantee of future performance. Actual results may differ materially from those anticipated in forward-looking or past performance statements. IC Markets makes no representation or warranty and assumes no liability as to the accuracy or completeness of the information provided, nor any loss arising from any investment based on a recommendation, forecast or any information supplied by any third-party.

Crude Oil Eyes 65.40 Support Amid Middle East Uncertainty!!Hey Traders,
In today’s trading session, we’re closely monitoring USOIL for a potential buying opportunity around the 65.40 zone. The commodity remains in an overall uptrend, and is currently undergoing a corrective phase, approaching a key support/resistance area near 65.40. This level aligns well with the broader trend structure and may offer a favorable risk-to-reward setup.
On the fundamental side, geopolitical tensions are on the rise. Reports indicate that U.S. embassy personnel are being evacuated from parts of the Middle East amid growing regional instability. Allegedly, Israel is preparing for potential military action against Iran should nuclear deal talks collapse.
If these tensions escalate further into military conflict, oil prices could spike in response to the heightened risk to regional supply chains.
Trade safe,
Joe

USOIL BEST PLACE TO SELL FROM|SHORT
USOIL SIGNAL
Trade Direction: short
Entry Level: 65.62
Target Level: 62.64
Stop Loss: 67.59
RISK PROFILE
Risk level: medium
Suggested risk: 1%
Timeframe: 9h
Disclosure: I am part of Trade Nation's Influencer program and receive a monthly fee for using their TradingView charts in my analysis.
✅LIKE AND COMMENT MY IDEAS✅

WTI OIL Massive rejection on the 1D MA200.WTI Oil (USOIL) has been trading within a Channel Down for over a year now and today its latest Bullish Leg hit the 1D MA200 (orange trend-line) for the first time since February 03 2025.
Unless we see a sustainable structured rise that turns it into a Support, the long-term bearish trend should prevail, and the market has already reacted to this with a strong rejection.
With the 1D RSI almost overbought (>70.00), being consistent with the last 3 major tops, we expect a gradual decline towards Support 1, as it happened on the January - February 2025 Bearish Leg.
Our Target is just above it at $55.50.
-------------------------------------------------------------------------------
** Please LIKE 👍, FOLLOW ✅, SHARE 🙌 and COMMENT ✍ if you enjoy this idea! Also share your ideas and charts in the comments section below! This is best way to keep it relevant, support us, keep the content here free and allow the idea to reach as many people as possible. **
-------------------------------------------------------------------------------
💸💸💸💸💸💸
👇 👇 👇 👇 👇 👇

CRUDE OIL (WTI): Detailed Support & Resistance Analysis
Here is my latest structure analysis for WTI Oil.
Resistance 1: 63.6 - 65.9 area
Resistance 2: 68.2 - 69.2 area
Resistance 3: 71.4 - 75.2 area
Support 1: 61.8 - 62.8 area
Support 2: 59.0 - 60.8 area
Support 3: 55.1 - 57.2 area
Consider these structures for pullback/breakout trading.
❤️Please, support my work with like, thank you!❤️

USOIL SHORT FROM RESISTANCE
USOIL SIGNAL
Trade Direction: short
Entry Level: 64.71
Target Level: 56.98
Stop Loss: 69.85
RISK PROFILE
Risk level: medium
Suggested risk: 1%
Timeframe: 1D
Disclosure: I am part of Trade Nation's Influencer program and receive a monthly fee for using their TradingView charts in my analysis.
✅LIKE AND COMMENT MY IDEAS✅


Crude oil pullback bullish trend
💡Message Strategy
Saudi price cuts and OPEC+ supply adjustments affect market sentiment
Crude oil came under pressure in the middle of the week after Saudi Arabia cut its July sales price to Asia to the lowest level in nearly two months. This follows OPEC+'s decision to increase production by 411,000 barrels per day in July, indicating that major oil producers are still prioritizing market share even amid volatile demand signals. This coordinated move by Saudi Arabia and Russia is seen as an attempt to constrain overproducers and strengthen control over global supply dynamics.
Refineries drive crude stock draw, but fuel demand lacks
Weekly data from the U.S. Energy Information Administration (EIA) delivered mixed messages. U.S. crude stockpiles fell by 4.3 million barrels to 436.1 million barrels, driven by a sharp increase in refinery runs, exceeding expectations. Utilization rose to 93.4%, indicating that refineries are preparing for a seasonal peak in demand. Adding to the bullish signal from the crude stock draw.
📊Technical aspects
On the technical side, the daily chart of WTI crude oil shows that oil prices have been under pressure for three consecutive trading days and are currently trading above the 20-day and 50-day moving averages, reflecting the dominance of short-term bullish sentiment. The MACD indicator shows a dead cross and the momentum column is enlarged, indicating that the upward trend is still continuing.
In the previous post, we have pointed out that the upward target and trend of crude oil have been reached. The main theme of crude oil in the future will still be a bullish correction.
💰 Strategy Package
Long Position: 62.50-63.00

WTI Oil D1 | Potential bounce off a pullback supportWTI oil (USOIL) is falling towards a pullback support and could potentially bounce off this level to climb higher.
Buy entry is at 73.17 which is a pullback support that aligns with the 23.6% Fibonacci retracement.
Stop loss is at 70.50 which is a level that lies underneath a a pullback support and the 38.2% Fibonacci retracement.
Take profit is at 78.07 which is a a pullback resistance.
High Risk Investment Warning
Trading Forex/CFDs on margin carries a high level of risk and may not be suitable for all investors. Leverage can work against you.
Stratos Markets Limited (tradu.com ):
CFDs are complex instruments and come with a high risk of losing money rapidly due to leverage. 63% of retail investor accounts lose money when trading CFDs with this provider. You should consider whether you understand how CFDs work and whether you can afford to take the high risk of losing your money.
Stratos Europe Ltd (tradu.com ):
CFDs are complex instruments and come with a high risk of losing money rapidly due to leverage. 63% of retail investor accounts lose money when trading CFDs with this provider. You should consider whether you understand how CFDs work and whether you can afford to take the high risk of losing your money.
Stratos Global LLC (tradu.com ):
Losses can exceed deposits.
Please be advised that the information presented on TradingView is provided to Tradu (‘Company’, ‘we’) by a third-party provider (‘TFA Global Pte Ltd’). Please be reminded that you are solely responsible for the trading decisions on your account. There is a very high degree of risk involved in trading. Any information and/or content is intended entirely for research, educational and informational purposes only and does not constitute investment or consultation advice or investment strategy. The information is not tailored to the investment needs of any specific person and therefore does not involve a consideration of any of the investment objectives, financial situation or needs of any viewer that may receive it. Kindly also note that past performance is not a reliable indicator of future results. Actual results may differ materially from those anticipated in forward-looking or past performance statements. We assume no liability as to the accuracy or completeness of any of the information and/or content provided herein and the Company cannot be held responsible for any omission, mistake nor for any loss or damage including without limitation to any loss of profit which may arise from reliance on any information supplied by TFA Global Pte Ltd.
The speaker(s) is neither an employee, agent nor representative of Tradu and is therefore acting independently. The opinions given are their own, constitute general market commentary, and do not constitute the opinion or advice of Tradu or any form of personal or investment advice. Tradu neither endorses nor guarantees offerings of third-party speakers, nor is Tradu responsible for the content, veracity or opinions of third-party speakers, presenters or participants.

WTI CRUDE OIL: Channel Down needing to fill its top. Bullish.WTI Crude Oil turned bullish on its 1D technical outlook (RSI = 62.137, MACD = 0.740, ADX = 26.844), having completed a very strong 1W candle last week. This is the continuation of the May 5th bottom rebound. All prior such rebounds have filled at least the 1W MA50, having touched the 0.618 Fibonacci retracement level. The 1W RSI LH trendline gives a good sense of where to sell, but since the 0.618 Fib is the guide, the target is TP = 71.15.
## If you like our free content follow our profile to get more daily ideas. ##
## Comments and likes are greatly appreciated. ##

WTI CRUDE OIL: Going for a LH rejection. Sell signal.WTI Crude Oil is practically neutral on its 1D technical outlook (RSI = 55.991, MACD = 0.160, ADX = 24.748) as it's on the 3rd straight day of flat consolidation on the 1D MA50. The last time it did this was on April 2nd, which resulted in a LH rejection to the S1 level. As the presence of the R1 level (64.90) is just above, we expect the market to get rejected and aim for the S1 again (TP = 56.00).
## If you like our free content follow our profile to get more daily ideas. ##
## Comments and likes are greatly appreciated. ##

WTI: Need a Breakout the STOP.DISCLAIMER : All labelling and wave counts done by me by manually and i will keep change according to the LIVE MARKET PRICE ACTION. So don't bias, hope on my trade plans...try to learn and make your own strategy...Following is not that much easy...I AM NOT RESPONSIBLE FOR ANY LOSSES IF U TOOK THE TRADE ACCORDING TO MY TRADE PLANS....THANKS LOT..CHEERS

USOIL What Next? SELL!
My dear friends,
USOIL looks like it will make a good move, and here are the details:
The market is trading on 64.73 pivot level.
Bias - Bearish
Technical Indicators: Supper Trend generates a clear short signal while Pivot Point HL is currently determining the overall Bearish trend of the market.
Goal - 63.36
Recommended Stop Loss - 65.42
About Used Indicators:
Pivot points are a great way to identify areas of support and resistance, but they work best when combined with other kinds of technical analysis
Disclosure: I am part of Trade Nation's Influencer program and receive a monthly fee for using their TradingView charts in my analysis.
———————————
WISH YOU ALL LUCK
Could the price bounce from here?WTI Oil (WTI/USD) is falling towards the pivot, which has been identified as an overlap support and could bounce to the 1st resistance, which is a pullback resistance.
Pivot: 62.36
1st Support: 61.81
1st Resistance: 63.24
Risk Warning:
Trading Forex and CFDs carries a high level of risk to your capital and you should only trade with money you can afford to lose. Trading Forex and CFDs may not be suitable for all investors, so please ensure that you fully understand the risks involved and seek independent advice if necessary.
Disclaimer:
The above opinions given constitute general market commentary, and do not constitute the opinion or advice of IC Markets or any form of personal or investment advice.
Any opinions, news, research, analyses, prices, other information, or links to third-party sites contained on this website are provided on an "as-is" basis, are intended only to be informative, is not an advice nor a recommendation, nor research, or a record of our trading prices, or an offer of, or solicitation for a transaction in any financial instrument and thus should not be treated as such. The information provided does not involve any specific investment objectives, financial situation and needs of any specific person who may receive it. Please be aware, that past performance is not a reliable indicator of future performance and/or results. Past Performance or Forward-looking scenarios based upon the reasonable beliefs of the third-party provider are not a guarantee of future performance. Actual results may differ materially from those anticipated in forward-looking or past performance statements. IC Markets makes no representation or warranty and assumes no liability as to the accuracy or completeness of the information provided, nor any loss arising from any investment based on a recommendation, forecast or any information supplied by any third-party.

USOIL Will Go Down From Resistance! Sell!
Here is our detailed technical review for USOIL.
Time Frame: 6h
Current Trend: Bearish
Sentiment: Overbought (based on 7-period RSI)
Forecast: Bearish
The market is trading around a solid horizontal structure 64.869.
The above observations make me that the market will inevitably achieve 63.448 level.
P.S
Please, note that an oversold/overbought condition can last for a long time, and therefore being oversold/overbought doesn't mean a price rally will come soon, or at all.
Disclosure: I am part of Trade Nation's Influencer program and receive a monthly fee for using their TradingView charts in my analysis.
Like and subscribe and comment my ideas if you enjoy them!

USOIL:Sharing of the Trading Strategy for Next WeekAll the trading signals this week have resulted in profits!!! Check it!!!👉👉👉
Fundamental Analysis:
OPEC+ plans to increase production by 411K bpd in July, with major producers like Saudi Arabia and the UAE holding ample idle capacity. This expansion could exacerbate global crude oil oversupply, pressuring prices. Concurrently, the U.S. steel import tariff hikes may trigger trade frictions, dampening global economic recovery and curbing industrial crude demand.
Technical Analysis:
The MACD indicator shows expanding green bars (bearish momentum), with short-term moving averages trending toward a bearish crossover of long-term averages. However, recent price retracement from relative highs suggests potential rebound. Key resistance lies at the $66–67/barrel zone, while critical support holds at $61.5–62/barrel.
Trading Recommendation:
Aggressive traders may initiate light short positions near 66 on a confirmed resistance rejection.
Trading Strategy:
Sell@66-65.5
TP:63-62
Share accurate trading signals daily—transform your life starting now!
👇 👇 👇 Obtain signals👉👉👉
