Pullback resistance holding – Bearish reversal in play?WTI Oil (XTI/USD) is reacting off the pivot, which has been identified as a pullback resistance that lines up with the 38.2% Fibonacci retracement and could drop to the 1st support.
Pivot: 65.81
1st Support: 62.17
1st Resistance: 68.85
Risk Warning:
Trading Forex and CFDs carries a high level of risk to your capital and you should only trade with money you can afford to lose. Trading Forex and CFDs may not be suitable for all investors, so please ensure that you fully understand the risks involved and seek independent advice if necessary.
Disclaimer:
The above opinions given constitute general market commentary, and do not constitute the opinion or advice of IC Markets or any form of personal or investment advice.
Any opinions, news, research, analyses, prices, other information, or links to third-party sites contained on this website are provided on an "as-is" basis, are intended only to be informative, is not an advice nor a recommendation, nor research, or a record of our trading prices, or an offer of, or solicitation for a transaction in any financial instrument and thus should not be treated as such. The information provided does not involve any specific investment objectives, financial situation and needs of any specific person who may receive it. Please be aware, that past performance is not a reliable indicator of future performance and/or results. Past Performance or Forward-looking scenarios based upon the reasonable beliefs of the third-party provider are not a guarantee of future performance. Actual results may differ materially from those anticipated in forward-looking or past performance statements. IC Markets makes no representation or warranty and assumes no liability as to the accuracy or completeness of the information provided, nor any loss arising from any investment based on a recommendation, forecast or any information supplied by any third-party.
USOUSD trade ideas

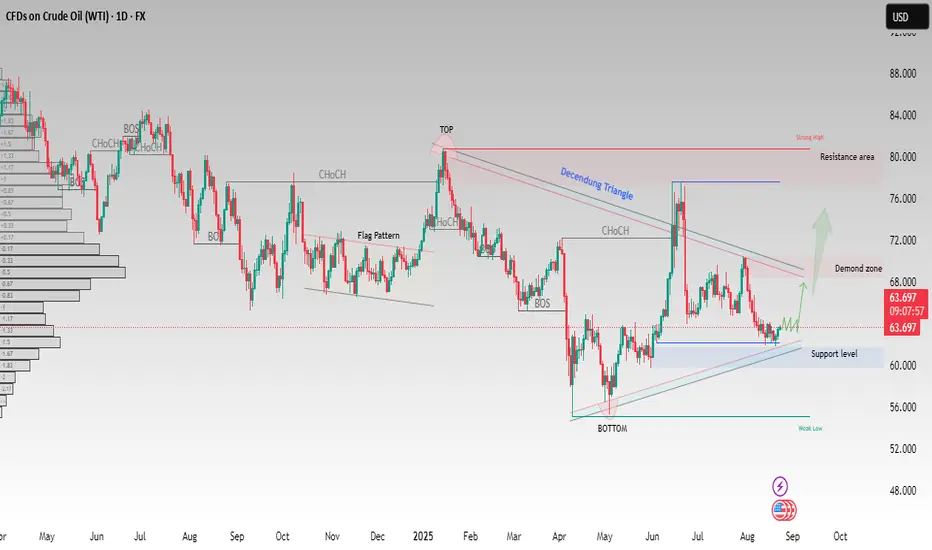
USOIL(WTI) – Demand Zone Tested,Potential Bullish Reversal AheadCrude Oil (WTI) is showing signs of strength after respecting the support level near $60–62 and forming a clear demand zone. Price has been consolidating within a descending structure and is now attempting to push higher.
Key observations:
✅ Support level held strongly near $60.
✅ Multiple Change of Character (CHoCH) signals indicating momentum shift.
✅ A potential breakout above the descending triangle may open the path toward the $70–72 demand zone.
📈 If bullish momentum continues, next targets lie around $76–80 resistance area.
On the downside, a break below $60 would invalidate the bullish setup and expose a move toward $56–54.
This structure highlights a possible trend reversal from the bottom toward higher levels, as long as buyers maintain control above support.
This analysis is for educational purposes only. It is not financial advice. Please trade responsibly and manage your risk
WTI falls after US slaps 50% tariff on India over Russian oilWTI oil prices have dropped from $65 to around $62.80 as markets react to new US tariffs on India, triggered by India’s ongoing oil trade with Russia. These tariffs, along with threats of even higher tariffs on China, are weighing on global demand and pushing oil prices lower. Meanwhile, Iran’s oil production has hit multi-year highs, adding more supply to the market and reinforcing the bearish trend.
Technically, oil has broken below a key Fibonacci support level, signalling a deeper pullback. If prices fall below $62, further downside toward $57 is possible. Upside moves may be short-lived unless there’s a major geopolitical shock, such as an escalation in the Russia-Ukraine conflict. For now, both the macro environment and technical signals indicate continued pressure on oil prices.
This content is not directed to residents of the EU or UK. Any opinions, news, research, analyses, prices or other information contained on this website is provided as general market commentary and does not constitute investment advice. ThinkMarkets will not accept liability for any loss or damage including, without limitation, to any loss of profit which may arise directly or indirectly from use of or reliance on such information.

XTI/USD Analysis: Oil Price Falls 2.8% from This Week’s HighXTI/USD Chart Analysis: Oil Price Falls 2.8% from This Week’s High
As the XTI/USD chart shows, this morning (27 August) WTI crude oil is trading around the $63 level, although on Monday it climbed above $64.70. This means the price has retreated by approximately 2.8% from this week’s high.
The bearish momentum may be linked to the market’s reassessment of geopolitical risks. According to Reuters, US Special Representative Steve Witkoff stated that:
→ he will meet with a Ukrainian delegation in New York this week;
→ the US administration is also in talks with Russia, seeking to bring the war to an end.
He also noted that Washington is striving for de-escalation in the Middle East. We could assume that market participants are pricing in the possibility that these efforts could lead to the easing of sanctions and reduce risks and restrictions in global oil trade.
Technical Analysis of the XTI/USD Chart
On 19 August, we highlighted that:
→ the August downtrend remained intact, though it appeared to be weakening;
→ bulls might exploit this situation and attempt to launch an attack.
Indeed, since then the price rallied to a peak near $64.80, forming an upward trajectory shown by the orange lines. However, at the start of this week, momentum shifted back to the bears, as evidenced by a series of bearish signals on the chart:
→ Yesterday, bulls attempted to resume the upward trend from the lower orange boundary but failed – this was reflected in a candlestick with a long upper shadow, touching the $64 level before reversing downwards.
→ Bears then built on this success, pushing the price below $63.50 (where the lower orange line had been positioned).
→ This morning, WTI is trading close to weekly lows, highlighting the bulls’ inability to counter the pressure.
As a result, bears have driven the price back into the descending channel that has been in place since the start of the month. Given the above, we could assume that the market may continue to develop bearish dynamics within this downward channel – with WTI potentially heading towards the red median line.
The forthcoming oil inventory report (due today at 15:30 GMT+3) might have a significant influence on how the situation unfolds.
This article represents the opinion of the Companies operating under the FXOpen brand only. It is not to be construed as an offer, solicitation, or recommendation with respect to products and services provided by the Companies operating under the FXOpen brand, nor is it to be considered financial advice.

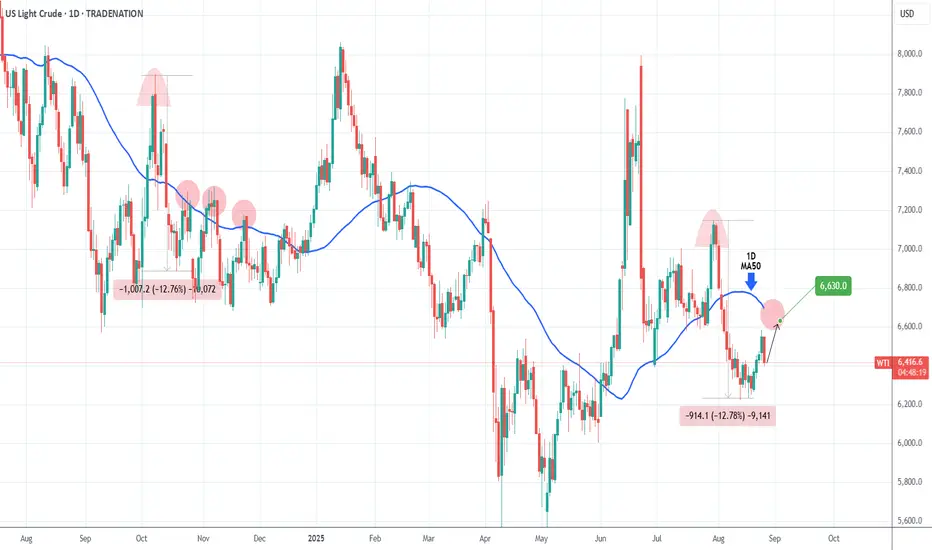
WTI OIL technically more chances to test the 1D MA50. Buy.Last week (August 20, see chart below) we issued a bullish break-out signal on WTI Oil (USOIL) that reached our $65.60 Target within 3 days:
This time we get a new buy signal, despite today's sharp pull-back. The -12.78% decline since the July 30 rejection, resembles the one since the October 08 2024 High.
This rebounded to just above the 1D MA50 (blue trend-line) to form a new Lower High and get rejected again.
As a result, our immediate short-term Target is $66.30.
-------------------------------------------------------------------------------
** Please LIKE 👍, FOLLOW ✅, SHARE 🙌 and COMMENT ✍ if you enjoy this idea! Also share your ideas and charts in the comments section below! This is best way to keep it relevant, support us, keep the content here free and allow the idea to reach as many people as possible. **
-------------------------------------------------------------------------------
Disclosure: I am part of Trade Nation's Influencer program and receive a monthly fee for using their TradingView charts in my analysis.
💸💸💸💸💸💸
👇 👇 👇 👇 👇 👇
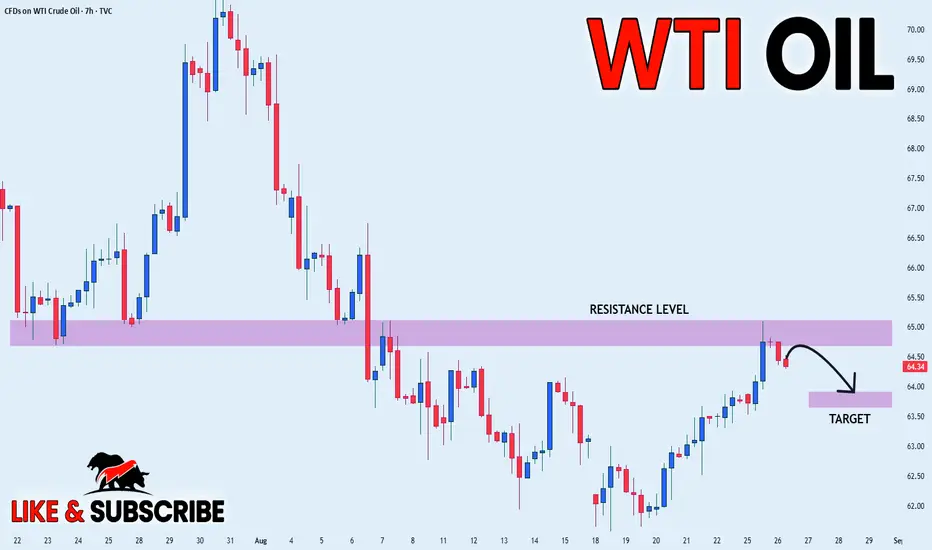
CRUDE OIL SHORT FROM RESISTANCE|
✅CRUDE OIL has retested a key resistance level of 65.10$
And as the price is already making a bearish pullback
A move down to retest the demand level below at 63.85$ is likely
SHORT🔥
✅Like and subscribe to never miss a new idea!✅
USOIL - NEW BREAKOUT!Hello Traders!
The USOIL failed to create a new lower low!
The price broke the resistance level (64.427 - 63.894).
This key level becomes new support!
So, I expect a bullish move🚀
______________
TARGET: 66.200🎯

Hellena | Oil (4H): SHORT to support area of 60 (Wave "3").Wave “C” continues to develop in a five-wave movement. Right now, I think wave “1” has just ended and we will see a small correction to the 66,280 area (wave ‘2’), after which I expect wave “3” to develop, which should go further than the 60 support level, but this is a fairly strong psychological level at which it would be good to take profits.
Manage your capital correctly and competently! Only enter trades based on reliable patterns!


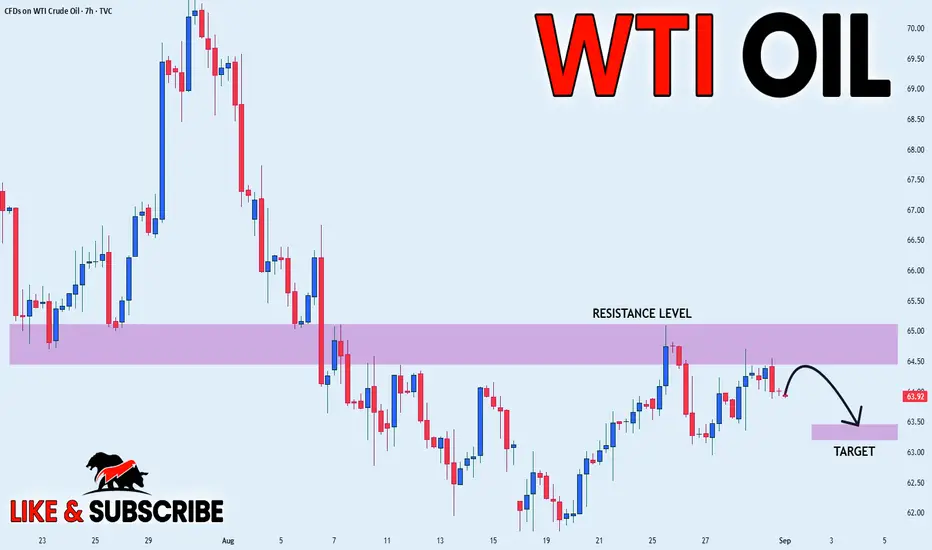
Market Analysis: WTI Crude Oil Faces HurdlesMarket Analysis: WTI Crude Oil Faces Hurdles
Crude oil is showing bearish signs and might decline below $62.80.
Important Takeaways for WTI Crude Oil Price Analysis Today
- Crude oil prices failed to clear the $65.00 region and started a fresh decline.
- There was a break below a major bullish trend line with support at $64.00 on the hourly chart of XTI/USD.
WTI Crude Oil Price Technical Analysis
On the hourly chart of WTI Crude Oil, the price struggled to clear the $65.00 level and started a fresh decline below $64.50.
There was a break below a major bullish trend line at $64.00, opening the doors for more losses. The price dipped below the 50% Fib retracement level of the upward move from the $61.56 swing low to the $64.85 high.
XTI/USD even dipped below $63.50 level and the 50-hour simple moving average. The bulls are now active near $63.00. If there is a fresh increase, it could face a barrier near $63.70.
The first major resistance is near $64.10. Any more gains might send the price toward $64.85 and call for a test of $65.50. Conversely, the price might continue to move down and revisit the $62.80 support and the 61.8% Fib retracement.
The next major support on the WTI crude oil chart is $62.35. If there is a downside break, the price might decline toward $61.55. Any more losses may perhaps open the doors for a move toward $60.50.
This article represents the opinion of the Companies operating under the FXOpen brand only. It is not to be construed as an offer, solicitation, or recommendation with respect to products and services provided by the Companies operating under the FXOpen brand, nor is it to be considered financial advice.

WTI Edges Up On Big EIA Draw, Risk-on ToneFundamental approach:
- Last week, USOIL was modestly higher amid risk-on sentiment and tighter supply signals after a larger‑than‑expected US crude draw.
- Support came from the EIA’s reported six-million-barrel crude draw tied to lower imports and stronger exports, reinforcing a tightening balance even as Cushing stocks ticked up; broader sentiment also leaned on expectations of looser Fed policy aiding demand.
- Gains were tempered by mixed macro cues, fading Eastern Europe risk headlines, choppy dollar moves, and cautious positioning ahead of the next API/EIA prints.
- However, China's Sinopec last week reported a sharp profit drop, citing weak fuel consumption. The trend of subdued fuel demand is likely to continue as factors including lower consumer confidence, rising electric-vehicle adoption and improved fuel efficiency are reducing petroleum demand in China.
- Into late week, USOIL could firm if US inventories show continued draws and risk tone improves, while any surprise builds or de‑escalation of supply risks may cap rallies; follow‑through from Fed‑cut pricing and geopolitics could potentially steer near‑term direction.
Technical approach:
- USOIL found support quickly after closing below the key level at 63.90. The price is retesting both EMAs and closed above the key level at 63.90, signaling a make-or-break situation. The market awaits a clear breakout to determine the short-term movement.
- If USOIL closes above both EMAs and breaks the descending trendline, the price may continue to advance to retest the following resistance at 67.50.
- On the contrary, closing below the support at 63.90 may prompt a further weakness to retest the next support at 60.00.
PS: I shared a piece of the above ideas on The Wall Street Journal: www.wsj.com
Analysis by: Dat Tong, Senior Financial Markets Strategist at Exness

Bearish reversal off major resisstance?USO/USD is rising towards the resistance level, which is an overlap resistance that lines up with the 61.8% Fibonacci projection and the 38.2% Fibonacci retracement, and could reverse from this level to our take profit.
Entry: 65.87
Why we like it:
There is an overlap resistance that aligns with the 51.8% Fibonacci projection and the 38.2% Fibonacci retracement.
Stop loss: 67.42
Why we like it:
There is a pullback resistance level that lines up with the 61.8% Fibonacci retracement.
Take profit: 63.50
Why we like it:
There is an overlap in support.
Enjoying your TradingView experience? Review us!
Please be advised that the information presented on TradingView is provided to Vantage (‘Vantage Global Limited’, ‘we’) by a third-party provider (‘Everest Fortune Group’). Please be reminded that you are solely responsible for the trading decisions on your account. There is a very high degree of risk involved in trading. Any information and/or content is intended entirely for research, educational and informational purposes only and does not constitute investment or consultation advice or investment strategy. The information is not tailored to the investment needs of any specific person and therefore does not involve a consideration of any of the investment objectives, financial situation or needs of any viewer that may receive it. Kindly also note that past performance is not a reliable indicator of future results. Actual results may differ materially from those anticipated in forward-looking or past performance statements. We assume no liability as to the accuracy or completeness of any of the information and/or content provided herein and the Company cannot be held responsible for any omission, mistake nor for any loss or damage including without limitation to any loss of profit which may arise from reliance on any information supplied by Everest Fortune Group.

USOIL BEARS WILL DOMINATE THE MARKET|SHORT
USOIL SIGNAL
Trade Direction: short
Entry Level: 64.00
Target Level: 62.79
Stop Loss: 64.80
RISK PROFILE
Risk level: medium
Suggested risk: 1%
Timeframe: 4h
Disclosure: I am part of Trade Nation's Influencer program and receive a monthly fee for using their TradingView charts in my analysis.
✅LIKE AND COMMENT MY IDEAS✅

Crude Oil Update: Bearish Momentum Continues🔥!
In our previous analysis, we anticipated a downward move in oil—and it delivered, generating solid gains for many of our followers. The technical setup was clear, and price action confirmed our expectations.
📉 Current Outlook:
The bearish trend remains intact, and we continue to expect further downside to reach our remaining targets. Momentum is building, and the chart signals are aligning for continuation.
📌 Full breakdown and chart analysis will be posted in the comments—stay tuned and trade smart!

Bearish continuation?WTI Oil (XTI/USD) is rising towards the pivot and could reverse to the 1st support, which is a pullback support.
Pivot: 65.65
1st Support: 60.66
1st Resistance: 70.97
Risk Warning:
Trading Forex and CFDs carries a high level of risk to your capital and you should only trade with money you can afford to lose. Trading Forex and CFDs may not be suitable for all investors, so please ensure that you fully understand the risks involved and seek independent advice if necessary.
Disclaimer:
The above opinions given constitute general market commentary, and do not constitute the opinion or advice of IC Markets or any form of personal or investment advice.
Any opinions, news, research, analyses, prices, other information, or links to third-party sites contained on this website are provided on an "as-is" basis, are intended only to be informative, is not an advice nor a recommendation, nor research, or a record of our trading prices, or an offer of, or solicitation for a transaction in any financial instrument and thus should not be treated as such. The information provided does not involve any specific investment objectives, financial situation and needs of any specific person who may receive it. Please be aware, that past performance is not a reliable indicator of future performance and/or results. Past Performance or Forward-looking scenarios based upon the reasonable beliefs of the third-party provider are not a guarantee of future performance. Actual results may differ materially from those anticipated in forward-looking or past performance statements. IC Markets makes no representation or warranty and assumes no liability as to the accuracy or completeness of the information provided, nor any loss arising from any investment based on a recommendation, forecast or any information supplied by any third-party.

Brent Crude Futures Remember when Oil was $100 a barrel??? Looks like we are headed right back there.
Every 90 weeks we get a "change in trend" for Brent. This week Brent is 180 weeks down from high and 90 weeks from low. It is time for a turn. Brent was up 1.4% August 26. It is turning higher in sync with this 90-week cycle. And when you see a close above 72.65, be ready for "panic buying" and an oil shock.
But we all can use a little exercise. Time to either ride bikes, car share or SAVE and MANAGE money for Gas!!

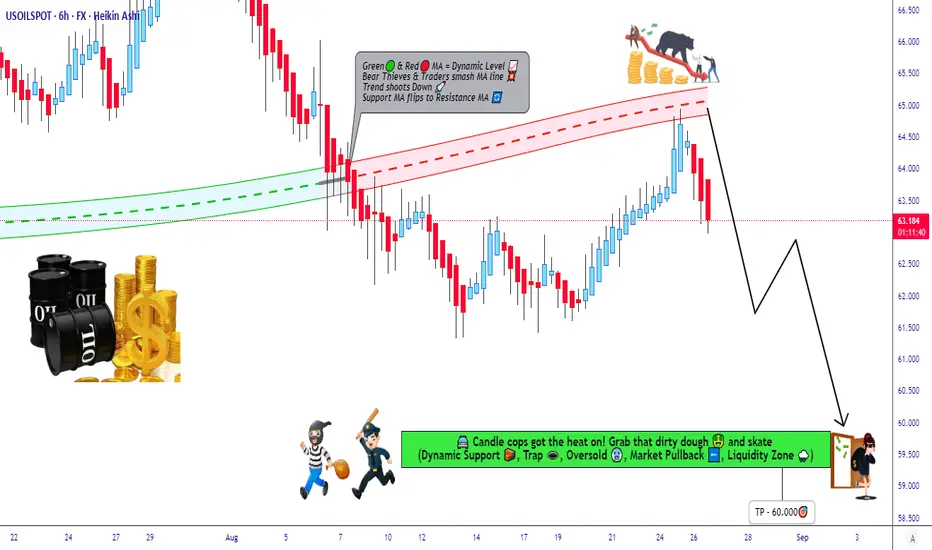
USOil Bear Trap Set: Ready For The Downside Raid?🛢️ WTI Oil Bearish Heist Plan 💣 | Thief Trader Layers Activated 🔐
💥 Welcome to the vault raid, Thief OG’s! 💥
We’re targeting US Oil Spot / WTI (XTIUSD) — and this time, the plan is pure Bearish robbery.
🚨 The Robbery Setup:
This isn’t just a sell — it’s a layered ambush. We place traps, let bulls walk in, and then we rob clean.
📌 Thief Entry Plan (Limit Layers):
Sell Limit @63.000
Sell Limit @63.500
Sell Limit @64.000
Sell Limit @64.500
👉 You can stack more layers if the vault door keeps opening.
🛑 Thief Stop Loss:
SL locked @65.500 🔒
⚠️ Adjust your SL like a true Thief — according to your risk + number of layers.
🎯 Escape Plan (Target):
🚔 Police barricade spotted around 59.000.
📌 Official Heist Exit: 60.000 — grab the loot before the cops arrive.
🧠 Thief Strategy Logic:
Multi-layer sell ambush 🏴☠️
Bearish pressure from supply + demand shifts 📊
Technical rejection zones aligning with macro weakness 📉
⚠️ Risk Management Note:
Thieves don’t rush!
👉 Place alerts before the raid.
👉 Don’t dump blind orders — wait for price to approach layers.
👉 Manage your position like a stealth operation, not a casino gamble.
💬 Thief Community Code:
Smash ❤️ & Boost if you’re with the robbery crew.
Drop your charts + sniper entries below.
We rob together. We win together. 🏆
🔔 Stay locked in — more heist plans dropping soon.
💰 Rob Smart. Trade Sharp. Exit Clean.
USOIL SENDS CLEAR BEARISH SIGNALS|SHORT
USOIL SIGNAL
Trade Direction: short
Entry Level: 64.06
Target Level: 61.35
Stop Loss: 65.86
RISK PROFILE
Risk level: medium
Suggested risk: 1%
Timeframe: 12h
Disclosure: I am part of Trade Nation's Influencer program and receive a monthly fee for using their TradingView charts in my analysis.
✅LIKE AND COMMENT MY IDEAS✅

OIL - at a very interesting point for longsWatch OIL carefully:
if the day closes above 65.38 (daily bullish engulfing) therefore above the previous weeks close, we could be going for another weekly impulse that would take us to the $86.40 level (conservative target: $78.40). According to your edge and how you are able to structure your operations, you have great risk to reward potential. For instance, even if you use the engulfing candle as your buy stop entry and the low of the candle as your stop loss i.e. you are going for the full daily swing, you are talking about a 1:6.5 R:R, which is already amazing in itself.
Levels on the chart, trade with care.
Please support my work by following me if you can!

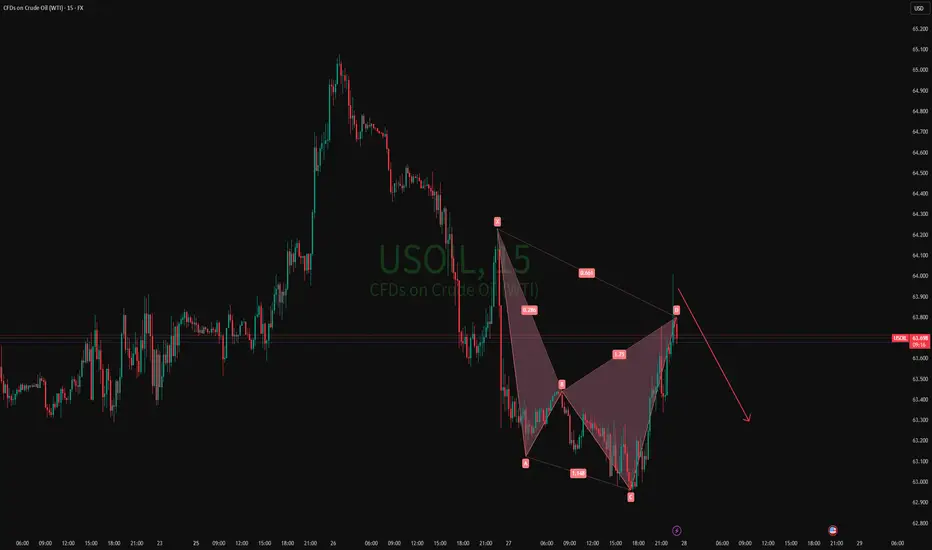
27-08-2025 USOILThe market is not always chaotic and disorderly, and there is a precise geometric beauty hidden in price fluctuations. The harmonic form long strategy is a powerful tool for accurately identifying potential market reversal points based on the Fibonacci ratio. When the form forms perfectly at the key support level, it often indicates the depletion of bearish momentum and the initiation of bullish trends.
As shown in the figure: 15M Bearish shark

CRUDE OIL WILL FALL|SHORT|
✅CRUDE OIL price went up
Sharply but a strong resistance
Level was hit at 65.00$
Thus, as a pullback is
Already happening
And a move down towards
The target of 63.50$shall follow
SHORT🔥
✅Like and subscribe to never miss a new idea!✅
USOIL H4 | Bearish reversal offUSOIL has reacted off the sell entry, which acts as a pullback resistance that aligns with the 50% Fibonacci retracement and could drop from this level to the downside.
Sell entry is at 63.96, which is a pullback resistance that aligns with the 50% Fibonacci retracement.
Stop loss is at 65.00, which is a pullback resistance.
Take profit is at 61.80, which is a swing low support.
High Risk Investment Warning
Trading Forex/CFDs on margin carries a high level of risk and may not be suitable for all investors. Leverage can work against you.
Stratos Markets Limited (tradu.com ):
CFDs are complex instruments and come with a high risk of losing money rapidly due to leverage. 65% of retail investor accounts lose money when trading CFDs with this provider. You should consider whether you understand how CFDs work and whether you can afford to take the high risk of losing your money.
Stratos Europe Ltd (tradu.com ):
CFDs are complex instruments and come with a high risk of losing money rapidly due to leverage. 66% of retail investor accounts lose money when trading CFDs with this provider. You should consider whether you understand how CFDs work and whether you can afford to take the high risk of losing your money.
Stratos Global LLC (tradu.com ):
Losses can exceed deposits.
Please be advised that the information presented on TradingView is provided to Tradu (‘Company’, ‘we’) by a third-party provider (‘TFA Global Pte Ltd’). Please be reminded that you are solely responsible for the trading decisions on your account. There is a very high degree of risk involved in trading. Any information and/or content is intended entirely for research, educational and informational purposes only and does not constitute investment or consultation advice or investment strategy. The information is not tailored to the investment needs of any specific person and therefore does not involve a consideration of any of the investment objectives, financial situation or needs of any viewer that may receive it. Kindly also note that past performance is not a reliable indicator of future results. Actual results may differ materially from those anticipated in forward-looking or past performance statements. We assume no liability as to the accuracy or completeness of any of the information and/or content provided herein and the Company cannot be held responsible for any omission, mistake nor for any loss or damage including without limitation to any loss of profit which may arise from reliance on any information supplied by TFA Global Pte Ltd.
The speaker(s) is neither an employee, agent nor representative of Tradu and is therefore acting independently. The opinions given are their own, constitute general market commentary, and do not constitute the opinion or advice of Tradu or any form of personal or investment advice. Tradu neither endorses nor guarantees offerings of third-party speakers, nor is Tradu responsible for the content, veracity or opinions of third-party speakers, presenters or participants.
