BEARISH REVERSAL price has hit strong daily resistance and formed a head and shoulder structure. this could possibly be a sign of reversal and sellers gaining momentum again
USOUSD trade ideas


USOIL next week trend analysis, hope it helps youThe current crude oil price stands at 60.49, a level shaped by multiple factors. On the supply side, news of an OPEC+ planned production increase has exerted significant pressure on the market. Although the specific details of the July production increase have not yet been finalized, expectations of higher output have spread, fueling concerns that a substantial increase in future crude oil supply will depress prices. At the same time, there are new developments in the U.S. shale oil industry: recent resumptions of production by some shale oil companies have led to rising output, further increasing uncertainties on the supply side.
On the demand side, the situation is equally bleak. Slower global economic growth and poor economic data in some countries have resulted in weak growth in industrial demand for crude oil. Moreover, with continuous advancements in new energy technologies, more and more sectors are adopting new energy as a substitute for traditional crude oil. For example, the popularity of electric vehicles has reduced demand for gasoline, thereby impacting overall crude oil demand.
Considering both supply and demand factors, the outlook for crude oil prices next week is pessimistic, and prices may continue to face downward pressure. If OPEC+ confirms a large-scale production increase plan at its upcoming meeting, expectations of higher supply will be further reinforced, and oil prices are likely to fall. However, the crude oil market is highly volatile, and geopolitical factors cannot be ignored. If instability emerges in the Middle East—such as escalated geopolitical conflicts affecting crude oil production and transportation—oil prices could unexpectedly rebound. Based on current information, however, the likelihood of a downward adjustment in crude oil prices next week remains high under the dual pressures of increased supply and weak demand.
USOIL next week trend analysis, hope it helps you
USOIL SELL@61~60.5
SL:62
TP:60~59.5

USOIL MONTHLYUSOIL,oil is on a demand floor and will continue to upswing into 70-69 dollar zone ,am holding oil buy till 70$ per barrel
at 70$ zon,e buyers will face supply roof ,a critical make or break zone ,if they break the structure ,oil will fly higher and if they respect the supply roof, we sell on the fundamentals of a broken SR/RS RULE..35$ zone will be watched in a bearish scenario.
Relationship Between US Oil Prices (USOIL), Bond Yields, and Interest Rates
1. General Correlation Between Oil Prices and Bond Yields
Over recent years, US crude oil prices and 10-year US Treasury bond yields have shown a strong positive correlation, often moving in tandem.
When oil prices rise, it typically signals stronger economic activity and higher inflation expectations, which tend to push bond yields higher as investors demand greater compensation for inflation risk and growth prospects.
Conversely, falling oil prices often correlate with lower bond yields due to expectations of weaker growth and reduced inflationary pressure.
2. Oil Prices Leading Bond Yield Movements
Short-term trend changes in crude oil prices often lead changes in bond yields by a few weeks, meaning oil price movements can be a useful indicator for bond market trends.
For example, a sustained rise in oil prices due to supply constraints or geopolitical tensions often precedes an increase in Treasury yields.
3. Recent Divergences and Market Dynamics
Recently, the usual positive relationship between oil prices and bond yields has broken down temporarily, reflecting unusual market conditions such as US fiscal uncertainties and changing safe-haven dynamics.
For instance, oil prices dropped due to expectations of increased production, while US bond yields increased following economic data releases, showing a temporary divergence.
4. Impact of Oil Prices on Interest Rates and Inflation Expectations
Rising oil prices contribute to higher inflation expectations, which in turn can lead to higher nominal bond yields as investors seek compensation for inflation risk.
Central banks, including the Federal Reserve, may respond to sustained high oil prices and inflation by maintaining or raising interest rates, which also pushes bond yields higher.
Conversely, falling oil prices can act as a disinflationary force, potentially easing pressure on interest rates and bond yields, though recent market behavior shows this effect can be muted by other factors.
5. Economic Implications
Higher oil prices combined with rising bond yields and a strengthening dollar can act as a "tax" on the US economy, potentially slowing growth and increasing recession risks.
The interplay of oil prices and bond yields is a key factor in assessing the economic outlook, inflation trajectory, and monetary policy stance.
Summary Table
Factor Relationship / Impact
Oil Price ↑ Bond yields ↑ (due to inflation & growth expectations)
Oil Price ↓ Bond yields ↓ (due to lower inflation & growth fears)
Oil price trend leads bond yields Oil price changes precede bond yield changes by weeks
Recent divergence Temporary breakdown due to fiscal concerns, policy uncertainty
Inflation expectations Higher oil → higher inflation expectations → higher yields
Economic growth impact Higher oil + yields = economic headwind (stagflation risk)
Conclusion
The relationship between US oil prices (USOIL) and bond yields is generally positive and significant, with oil price movements often leading bond yield trends. Rising oil prices tend to push bond yields and interest rates higher through increased inflation expectations and stronger economic activity signals. However, recent market conditions have caused some temporary divergences due to fiscal uncertainties and changing safe-haven demand. Monitoring oil prices is crucial for anticipating bond market movements and understanding the broader macroeconomic environment.
#usoil #dollar #oil

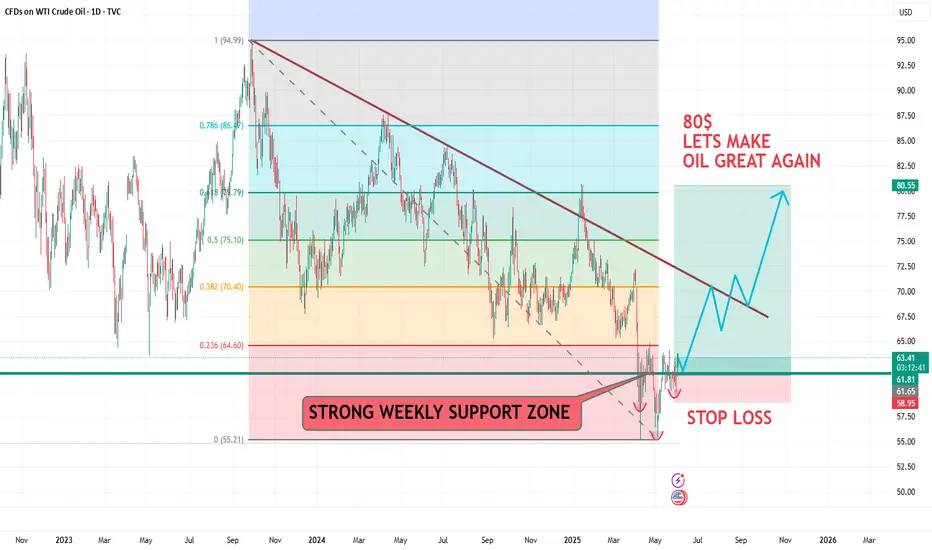
USOIL LETS MAKE OIL GREAT AGAIN TO 80$HELLO TRADERS
As i can see USOIL it formaing H & S pattrent and now trading above a strong Weekly horizontal Support zone if prices hold above 65$ then given Tp can be easy target if we see a higher demand and tight supply with the War going on around the world its a huge possibilty that pricce can shoot up we have to monitor the 65$ price zone which is importat to hold bull cycle on smaller TF 4HR it is creating Wickoff pattren too and we can see Fibo levels golden ratio can hit our targers or risk reward is great for us becaus we was buying the dip in May it is just starting chart is crystal clear its just a trade idea share your thoughts we appriciate ur comments and support Stay tuned for more updates
USOIL: Short Signal Explained
USOIL
- Classic bearish pattern
- Our team expects retracement
SUGGESTED TRADE:
Swing Trade
Sell USOIL
Entry - 64.73
Stop - 66.13
Take - 62.38
Our Risk - 1%
Start protection of your profits from lower levels
Disclosure: I am part of Trade Nation's Influencer program and receive a monthly fee for using their TradingView charts in my analysis.
❤️ Please, support our work with like & comment! ❤️

Potential bullish rise?WTI Oil (XTI/USD) has bounced off the pivot and could rise the 1st resistance which is a pullback resistance.
Pivot: 61.68
1st Support: 60.72
1st Resistance: 63.49
Risk Warning:
Trading Forex and CFDs carries a high level of risk to your capital and you should only trade with money you can afford to lose. Trading Forex and CFDs may not be suitable for all investors, so please ensure that you fully understand the risks involved and seek independent advice if necessary.
Disclaimer:
The above opinions given constitute general market commentary, and do not constitute the opinion or advice of IC Markets or any form of personal or investment advice.
Any opinions, news, research, analyses, prices, other information, or links to third-party sites contained on this website are provided on an "as-is" basis, are intended only to be informative, is not an advice nor a recommendation, nor research, or a record of our trading prices, or an offer of, or solicitation for a transaction in any financial instrument and thus should not be treated as such. The information provided does not involve any specific investment objectives, financial situation and needs of any specific person who may receive it. Please be aware, that past performance is not a reliable indicator of future performance and/or results. Past Performance or Forward-looking scenarios based upon the reasonable beliefs of the third-party provider are not a guarantee of future performance. Actual results may differ materially from those anticipated in forward-looking or past performance statements. IC Markets makes no representation or warranty and assumes no liability as to the accuracy or completeness of the information provided, nor any loss arising from any investment based on a recommendation, forecast or any information supplied by any third-party.

The first crude oil target was reached perfectly
💡Message Strategy
Last Friday (May 31), oil prices fell slightly as traders generally expected OPEC+ to "play a big trick" - increasing production in July to more than 500,000 barrels per day.
Potential risks: The supply and demand game is not over
OPEC+'s production increase plan still faces implementation difficulties. Countries such as Kazakhstan have previously refused to cut production, and the actual production capacity of some member countries (such as Nigeria and Angola) is close to the upper limit. If global demand declines due to expectations of economic recession, OPEC+'s "moderate production increase" may evolve into "passive inventory accumulation", thereby suppressing medium- and long-term oil prices.
Short-term supply concerns: Russia is the world's second largest crude oil exporter. If its military facilities are frequently attacked, it may affect the stability of its energy infrastructure.
"Extreme pressure" before negotiations: The attack occurred on the eve of the ceasefire negotiations between Russia and Ukraine. Ukraine tried to increase its bargaining chips through military actions. If the negotiations fail, Western sanctions against Russia may be increased, further disrupting crude oil trade flows.
Risk premium returns: Geopolitical conflicts have always been a "fuel" for oil prices. When the war between Russia and Ukraine broke out in 2022, Brent crude oil once surged to $139 per barrel. Although the current supply and demand environment is different, the market's sensitivity to emergencies remains.
📊Technical aspects
Crude oil fluctuated in a range last week, with a minimum of 59.8 and a maximum of 63. The weekly line closed at 60.7. The weekly line shows that oil prices are in an upward channel and there is a rebound. The focus is on whether 64 can be broken through. The daily line shows a large range of fluctuations. In summary, this week's operation ideas are mainly based on callbacks and longs. First look at the 63-61-58 range. In the day, the four-hour line is range-oscillated. First look at 4 on the top. The hourly line is oscillating upward. Today's big rise has come to our first target position, rising to the 63 line. From the shape, there is still room for growth. In summary, the intraday operation ideas are mainly oscillating upward, and the focus is on 61 and 60 below.
💰 Strategy Package
Long Position: 61.50-62.00

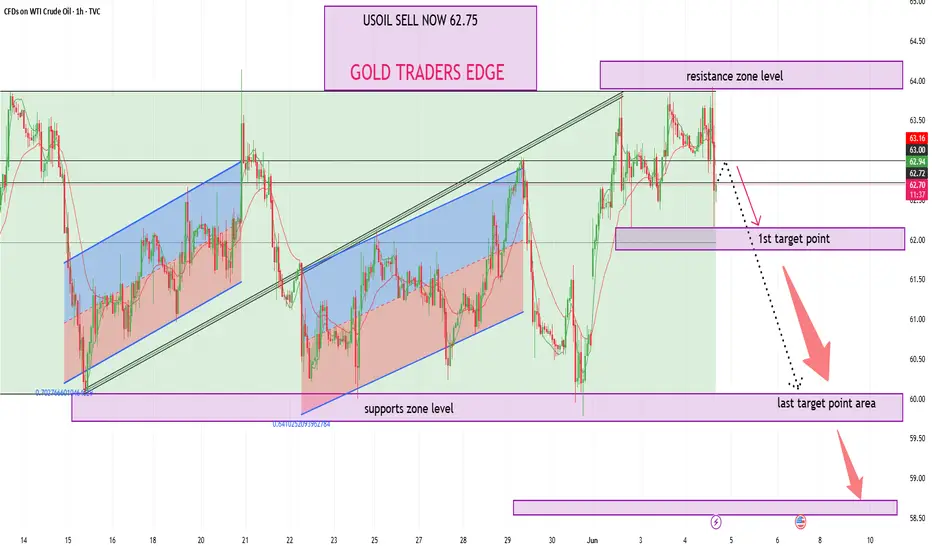
USOIL SHORT TRADE SETUP Entry: 62.75USOIL SHORT TRADE SETUP
Entry: 62.75
🔹 Direction: Sell / Short
🎯 Target Levels:
1️⃣ First Target: 62.00
2️⃣ Second Target: 61.00
3️⃣ Final Target: 60.00
🛡️ Risk Management:
✅ Position size according to your account size
✅ Use stop loss based on personal strategy
✅ Protect capital first – always
📊 Rationale:
Expecting bearish continuation below 63.00
Price facing resistance at higher levels
Downtrend pressure remains intact
⚠️ Disclaimer:
This is not financial advice
Trade at your own risk
Always do your own analysis
Stick to your trading plan
📈 Stay disciplined – patience pays!
USOIL - Long - WWIIIUkraine just bombed Russia's fighter jets in which Zelensky call a well coordinated plan that took one years since month to carry out. Russia being the third largest oil producer is likely to defend their most important resource oil companies which might limit oil production in the short term. However Russia is likely going to respond with equal force if not more which will then disrupt trades routes therefore cutting oil global supply. A shock supply will lead to higher oil prices. Technical analysis also supports these thesis by current prices being above moving averages however a pullback before prices ascend is imminent.
Summary
If entry 1 is triggered and hits target 1 then you can take a second entry( Entry2).
Entry 1 or Current = Target 1 or Target 2
Entry 2 = Target 2
Follow, Boost and share my ideas.
Foreign Capital
'If you Know, you Know."

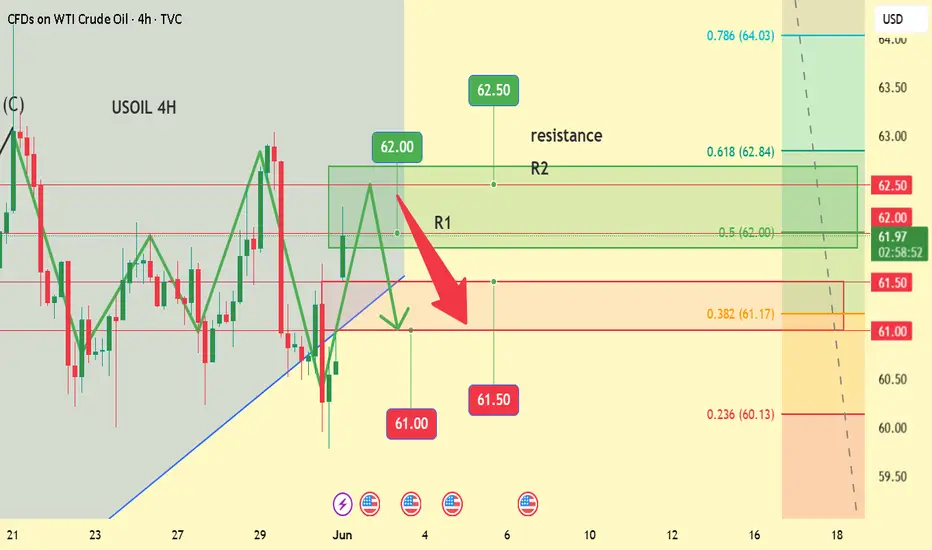
USOIL Today's Trading Strategy Hope this helps you### (1)Significant Pressure on the Supply Side
OPEC+ has a strong expectation to increase production, with some oil-producing countries planning to further raise output in July. Core producers such as Saudi Arabia and the United Arab Emirates have ample idle capacity and can rapidly expand supply. The resurgent production activity of U.S. shale oil enterprises, with an increase in the number of drilling rigs and sustained production growth, has further exacerbated the global crude oil supply glut. Once OPEC+'s production increase plan is implemented, the supply of crude oil in the market will surge. In the absence of a significant improvement in demand, oil prices will inevitably face enormous downward pressure.
### (2)Weak Demand Growth
The global economic recovery has been slow, with economic growth data in some countries and regions falling short of expectations. Sluggish industrial production activities have made it difficult to boost demand for crude oil. The rapid development and widespread application of new energy technologies have also been continuously squeezing the market space for crude oil, as more and more sectors are using clean energy as a substitute for crude oil, leading to limited growth in crude oil demand. In addition, recently released economic data show that the manufacturing purchasing managers' index (PMI) in many countries is below the expansion-contraction threshold, indicating that demand for crude oil from industrial production will continue to be weak in the future.
From a technical analysis perspective, crude oil prices face strong resistance in the $62-$62.50 range, with the price repeatedly encountering resistance and falling back in this area in the past. The current price is approaching this resistance zone, and if it fails to break through effectively, the price is highly likely to reverse and decline. At the same time, the moving average system is in a bearish arrangement, with short-term moving averages suppressing long-term ones. Technical indicators such as MACD and KDJ also suggest a downward trend in prices, further validating the possibility of shorting.
USOIL Today's Trading Strategy Hope this helps you
USOIL SELL@62~62.5
SL:63.5
TP:61~61.5
Crude oil pullback bullish trend
💡Message Strategy
Saudi price cuts and OPEC+ supply adjustments affect market sentiment
Crude oil came under pressure in the middle of the week after Saudi Arabia cut its July sales price to Asia to the lowest level in nearly two months. This follows OPEC+'s decision to increase production by 411,000 barrels per day in July, indicating that major oil producers are still prioritizing market share even amid volatile demand signals. This coordinated move by Saudi Arabia and Russia is seen as an attempt to constrain overproducers and strengthen control over global supply dynamics.
Refineries drive crude stock draw, but fuel demand lacks
Weekly data from the U.S. Energy Information Administration (EIA) delivered mixed messages. U.S. crude stockpiles fell by 4.3 million barrels to 436.1 million barrels, driven by a sharp increase in refinery runs, exceeding expectations. Utilization rose to 93.4%, indicating that refineries are preparing for a seasonal peak in demand. Adding to the bullish signal from the crude stock draw.
📊Technical aspects
On the technical side, the daily chart of WTI crude oil shows that oil prices have been under pressure for three consecutive trading days and are currently trading above the 20-day and 50-day moving averages, reflecting the dominance of short-term bullish sentiment. The MACD indicator shows a dead cross and the momentum column is enlarged, indicating that the upward trend is still continuing.
In the previous post, we have pointed out that the upward target and trend of crude oil have been reached. The main theme of crude oil in the future will still be a bullish correction.
💰 Strategy Package
Long Position: 62.50-63.00


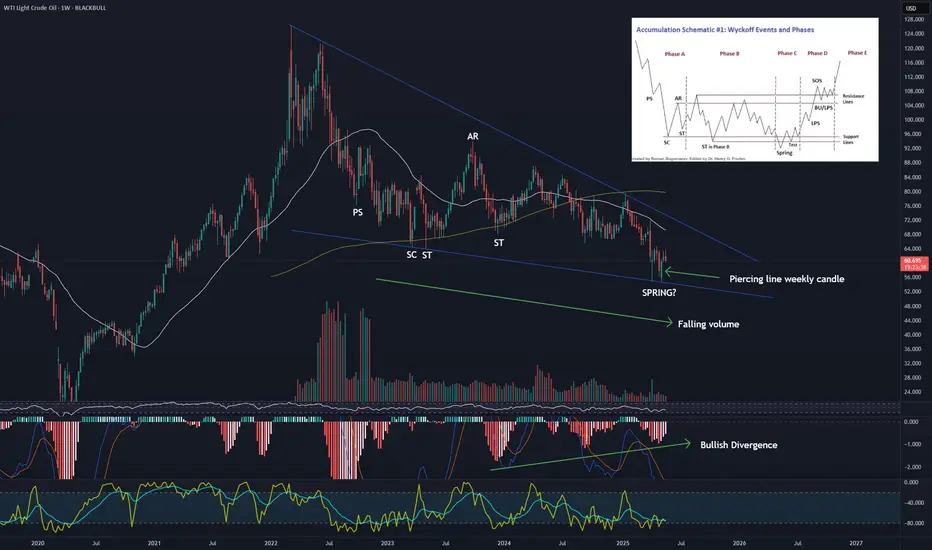
Textbook Falling Wedge & Wyckoff Accumulation Brewing?Analysis:
Looking at the daily chart for Crude Oil, we appear to be seeing a very compelling confluence of bullish technical signals that suggest a potential significant reversal to the upside.
Textbook Falling Wedge Formation:
Price action is clearly consolidating within a well-defined falling wedge pattern.
We have observed multiple clear touches (3+ on the upper, 4+ on the lower trendline), indicating these boundaries are highly respected by the market.
Crucially, volume has been declining as price consolidates within the wedge, a classic characteristic signifying diminishing selling pressure.
The angles of convergence also appear ideal, with the upper trendline being steeper than the lower.
Wyckoff Accumulation Schematic #1 in Play?
Diving deeper, the internal structure of this falling wedge strongly resembles Wyckoff's Accumulation Schematic #1.
We can identify potential phases:
PS (Preliminary Support): Early signs of buying.
SC (Selling Climax): A sharp sell-off often with high volume, marking potential capitulation.
AR (Automatic Rally): The first significant bounce after the SC.
ST (Secondary Test): Retesting the lows of the SC.
Spring: A key event where price dips below the established trading range support (or the wedge's lower trendline) only to quickly reverse back above it, effectively trapping sellers and confirming a shakeout of weak hands.
This internal Wyckoff structure within the falling wedge significantly strengthens the case for institutional accumulation taking place.
Bullish Candlestick & Oscillator Confluence:
At the recent lows, we observed a potential Piercing Line bullish reversal candlestick pattern forming right at the lower trendline of the wedge. This indicates aggressive buying stepping in.
The MACD indicator has confirmed this bullish shift, showing a recent bullish crossover (MACD line above Signal line) and a flip of the histogram from red to green.
Furthermore, there appears to be a bullish divergence on the MACD – as price made lower lows within the wedge, the MACD indicator made higher lows (or showed increasing bullish momentum), suggesting underlying bearish momentum is weakening significantly.
Market Sentiment & Potential Implications:
It's noteworthy that this bullish technical setup is occurring amidst increased bearish media and Twitter sentiment surrounding oil. From a contrarian perspective, extreme bearish sentiment often coincides with market bottoms, as "smart money" accumulates positions while the crowd is most pessimistic. This situation could set the stage for a strong reversal, potentially fueled by short covering.
Conclusion:
All signs from price action, volume, candlestick patterns, and oscillators point towards a high probability of a bullish reversal and an upside breakout from this well-formed falling wedge. The potential Wyckoff accumulation pattern adds significant weight to the idea that sophisticated players are positioning for a significant move higher.
What to Watch For:
The next critical step is a decisive breakout above the upper trendline of the falling wedge, ideally accompanied by a significant surge in buying volume. This would confirm the pattern's completion and signal the potential start of a new uptrend. A more aggressive approach is entering now and capturing more upside if it is to occur.
This is for educational purposes only and not financial advice. Always conduct your own research and manage your risk.
USOIL SELL SIGNAL Entry Point: 62.60USOIL SELL SIGNAL
Entry Point: 62.60
🎯 Target 1: 62.00
🎯 Target 2: 61.00
🎯 Final Target: 60.00
⚠️ Risk Management Matters!
– Always set a stop-loss
– Never risk more than 1–2% per trade
– Stick to your strategy, not emotions
📊 Technical Outlook:
– Resistance zone near 62.60
– Bearish pressure increasing
– Potential trend reversal forming
✅ Lock profits step by step
✅ Use trailing stops when in profit
✅ Avoid overtrading or revenge trading
📌 Stay consistent and patient
📌 The goal is longevity, not luck
📌 Trust your analysis – not the noise
📢 For educational purposes only – trade responsibly!


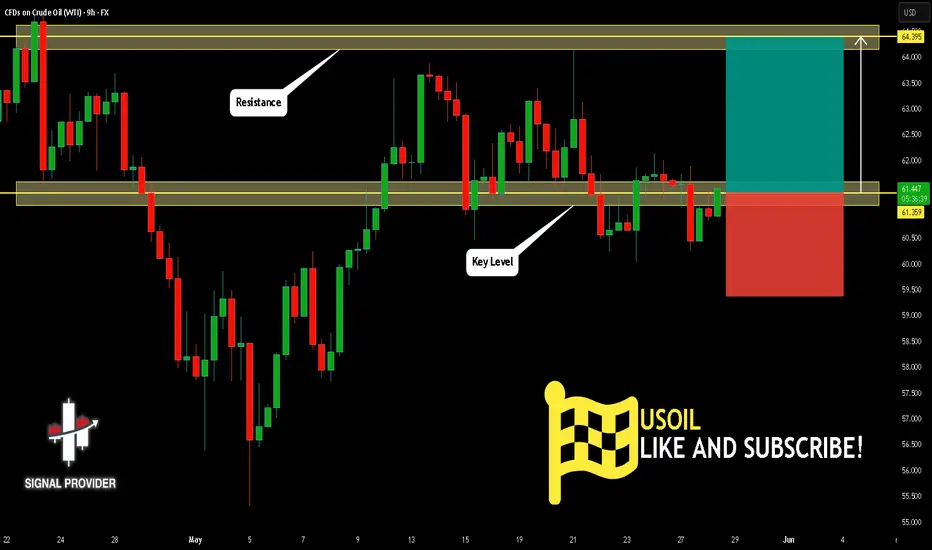
USOIL Will Go Up! Long!
Here is our detailed technical review for USOIL.
Time Frame: 9h
Current Trend: Bullish
Sentiment: Oversold (based on 7-period RSI)
Forecast: Bullish
The market is approaching a significant support area 61.359.
The underlined horizontal cluster clearly indicates a highly probable bullish movement with target 64.395 level.
P.S
We determine oversold/overbought condition with RSI indicator.
When it drops below 30 - the market is considered to be oversold.
When it bounces above 70 - the market is considered to be overbought.
Disclosure: I am part of Trade Nation's Influencer program and receive a monthly fee for using their TradingView charts in my analysis.
Like and subscribe and comment my ideas if you enjoy them!
USOIL Will Go Higher From Support! Buy!
Take a look at our analysis for USOIL.
Time Frame: 9h
Current Trend: Bullish
Sentiment: Oversold (based on 7-period RSI)
Forecast: Bullish
The market is testing a major horizontal structure 60.773.
Taking into consideration the structure & trend analysis, I believe that the market will reach 64.119 level soon.
P.S
Overbought describes a period of time where there has been a significant and consistent upward move in price over a period of time without much pullback.
Disclosure: I am part of Trade Nation's Influencer program and receive a monthly fee for using their TradingView charts in my analysis.
Like and subscribe and comment my ideas if you enjoy them!


USOIL:Go long
Crude oil prices rose due to ongoing tariff uncertainty as well as ongoing geopolitical tensions in the Middle East.
From the chart, the K line has repeatedly appeared long lower shadow small solid positive line, indicating that the lower buying long support is strong. Expected intraday crude oil short - term trend still exists a wave of upward space.
Trading Strategy:
BUY@62.5-62.6
TP: 63.5-64
↓↓↓ More detailed strategies and trading will be notified here ↗↗↗
↓↓↓ Keep updated, come to "get" ↗↗↗

The bears continue to dominate!Oil prices fluctuated lower this week, primarily pressured by the repeated U.S. tariff policies and expectations of OPEC+ production increases. During Friday's Asian session, Brent crude oil futures fell 0.41% to $63.89 per barrel, while U.S. WTI crude oil futures declined 0.44% to $60.67. The Brent July futures contract is set to expire on Friday. The tariffs imposed by U.S. President Trump were originally suspended, but the U.S. Federal Appellate Court temporarily reinstated them on Thursday, overturning the trade court's suspension ruling made on Wednesday. This legal volatility caused oil prices to plummet by more than 1% on Thursday.
The crude oil market this week has shown high sensitivity, influenced not only by legal rulings but also by dual pressures from geopolitical tensions and internal coordination imbalances within the organization. Under the intertwined effects of tariffs and production expectations, oil prices have struggled to achieve directional breakthroughs. If OPEC+ fails to reach an agreement on production control and demand from Asian countries and other major consumers has not recovered, oil prices are likely to maintain a weak oscillating pattern in the coming weeks. The MACD indicator is opening downward below the zero axis, with strong bearish momentum, suggesting a risk of further downside for crude oil during the day.
Overall, for next week's crude oil trading strategy, He Bosheng recommends focusing on bearish trades on rebounds, complemented by bullish trades on pullbacks.
Humans need to breathe, and perfect trading is like breathing—maintaining flexibility without needing to trade every market swing. The secret to profitable trading lies in implementing simple rules: repeating simple tasks consistently and enforcing them strictly over the long term.
Trading Strategy:
sell@61.5-62,0
TP:59.5-60.0

USOIL next week trend analysis, hope it helps youOPEC+ confirmed at its meeting on May 31 that eight oil-producing countries under its mechanism will continue to increase production by 411,000 barrels per day (bpd) in July, maintaining the same pace as in May and June. Although the market had partially priced in this expectation, the continuation of the production increase plan has strengthened the long-term logic of loose supply. It is worth noting that this production increase is not a unified action by the entire alliance but rather the result of core members such as Saudi Arabia and Russia voluntarily exiting production cuts, reflecting cautious attitudes within OPEC+ toward demand prospects. With oil prices currently breaking below the key psychological threshold of $60 per barrel, if the production increase plan continues into the second half of the year, it may further suppress the upside room for oil price rebounds.
USOIL next week trend analysis, hope it helps you
USOIL SELL@61~60.5
SL:62
TP:60~59.5


USOIL SELLERS WILL DOMINATE THE MARKET|SHORT
USOIL SIGNAL
Trade Direction: short
Entry Level: 61.25
Target Level: 56.17
Stop Loss: 64.55
RISK PROFILE
Risk level: medium
Suggested risk: 1%
Timeframe: 1D
Disclosure: I am part of Trade Nation's Influencer program and receive a monthly fee for using their TradingView charts in my analysis.
✅LIKE AND COMMENT MY IDEAS✅
