USOIL:The short-term trend direction resumes an upward trend.The short-term trend of USOIL has started to rise again and is currently fluctuating around $63. The moving average system is in a bullish arrangement, and the objective short-term trend direction has resumed an upward trend. The oil price in the early trading session has declined within a narrow range, forming a secondary rhythm. According to the law of primary and secondary alternation, it is expected that the intraday trend of crude oil will continue to rise slightly.
USOIL
buy@62-62.5
tp:64-64.5
I am committed to sharing trading signals every day. Among them, real-time signals will be flexibly pushed according to market dynamics. All the signals sent out last week accurately matched the market trends, helping numerous traders achieve substantial profits. Regardless of your previous investment performance, I believe that with the support of my professional strategies and timely signals, I will surely be able to assist you in breaking through investment bottlenecks and achieving new breakthroughs in the trading field.
USOUSD trade ideas

USOIL:Sharing of the Latest Trading StrategyAll the trading signals today have resulted in profits!!! Check it!!!👉👉👉
With the easing of geopolitical tensions and the bearish impact of the US EIA crude oil inventory data, the overall trend of crude oil remains bearish. Technically, focus on the resistance level of 64.5 - 64.0 on the upside and the support level of 60.5 - 60.0 on the downside. In terms of operation, wait for a rebound to go short.
Trading Strategy:
sell@63.5-63
TP:62-61
The signals in the Signature have brought about continuous profits, and accurate signals are shared every day. Hurry up and click to get them!
👇 👇 👇 Obtain signals👉👉👉


USOIL:Sharing of the Latest Trading StrategyAll the trading signals today have resulted in profits!!! Check it!!!👉👉👉
The increase in crude oil production has, in the context of an uncertain demand outlook, sparked concerns about a rise in global supply. After breaking below the 60 mark last week, crude oil continued its downward trend and reached as low as around 55.3. Currently, there is a slight rebound. One can simply find an appropriate position to go short again. Go short on crude oil when it rebounds to around 59.8, and target the price levels of 58 to 57.
Trading Strategy:
sell@59.8-58.5
TP:58-57
The signals in the Signature have brought about continuous profits, and accurate signals are shared every day. Hurry up and click to get them!
👇 👇 👇 Obtain signals👉👉👉

Crude Oil Dipped: Downtrend Could ResumeFenzoFx—Crude oil has begun consolidating around $63.5, a resistance level aligned with the 78.6% Fibonacci retracement. Selling pressure has resulted in a long-wicked bearish candlestick pattern at this level.
The primary support level stands at $61.45. A break below this threshold could trigger a new bearish wave, potentially driving the price toward the $60.20 support, reinforced by the 50-period simple moving average.
However, the primary trend remains bullish as long as the price holds above the $60.20 support.

USOILCurrent USOIL Price Drop (May 2025)
WTI crude oil (USOIL) has declined sharply in early May 2025, Key drivers include:
OPEC+ Surprise Supply Increase: OPEC+ announced plans to raise output in June, reversing earlier production cuts and flooding the market with additional barrels.
Tariff-Driven Demand Fears: U.S.-China trade tensions and retaliatory tariffs threaten global economic growth, reducing oil demand forecasts.
Dollar Strength: The U.S. dollar (DXY) has rebounded due to delayed Fed rate cuts and safe-haven demand, pressuring dollar-denominated oil prices.
EIA/Goldman Sachs Forecasts: The U.S. Energy Information Administration (EIA) and Goldman Sachs revised 2025–2026 oil price forecasts downward, citing oversupply risks and weaker demand.
Shifting Dollar-Oil Correlation
Historically, oil and the dollar were inversely correlated (strong dollar = lower oil prices). However, this relationship is weakening due to:
U.S. as a Net Oil Exporter: The U.S. is now the world’s largest crude producer. Higher oil prices improve the U.S. trade balance (vs. worsening it when the U.S. was a net importer).
Petrodollar Dynamics: As the U.S. exports more oil, revenue from oil sales strengthens the dollar, creating a positive correlation in certain scenarios.
Geopolitical and Policy Shocks: Tariffs, OPEC+ decisions, and Fed policy now dominate price action, overshadowing traditional correlations.
Future Directional Bias
Bearish Factors
OPEC+ Supply Surge: Increased production (post-June 2025) could push prices toward $50–$55/barrel (Goldman Sachs base case).
Recession Risks: Weak demand from China/Europe and U.S. tariff impacts may trigger a global slowdown, further depressing oil prices.
Dollar Strength: Fed rate cuts delayed until July 2025 or later could sustain dollar strength, capping oil’s upside.
Bullish Catalysts
Supply Disruptions: Escalating Middle East tensions or OPEC+ policy reversals could tighten supply.
Weaker Dollar: If the Fed signals rate cuts or tariffs ease, dollar weakness could lift oil prices.
Outlook:
USOIL faces downside risks in the near term due to oversupply and demand concern
Exogenous Shocks: Exogenous shocks to the U.S. real interest rate can cause a modest and short-lived decline in the real price of oil. Although there is a higher opportunity cost of holding inventories, oil inventories may increase, reflecting the decline in global real activity associated with higher U.S. real interest rate


WTI Crude Slips as Inventory Build Fuels Bearish MomentumWest Texas Intermediate (WTI) crude edged lower overnight, extending its recent pullback following the latest U.S. Energy Information Administration (EIA) weekly report for the week ending May 9. The data revealed an unexpected build of 3.45 million barrels in U.S. crude inventories, contrasting sharply with the prior week's 2.03 million-barrel draw and defying market expectations of a 1 million-barrel decline.
This surprise uptick in stockpiles signaled softening demand, compounding existing bearish sentiment and sparking a fresh wave of selling. WTI has since declined approximately 2% from the May 13 high of $63.68, suggesting growing downside pressure.
Technically, the price action appears poised to retest the key intermediate support at $60.00, a psychologically significant level. A decisive break below this area could expose the next major support at $55.12, a pivotal zone that aligns with the prevailing 7th March 2022 long-term downtrend. A breach of this support zone would likely confirm a broader bearish reversal, marking a critical milestone for oil markets.
On the contrary, oil prices may consolidate around the $60.00–$61.50 range before moving higher. If buying interest increases, prices could rise toward the key $63.71–$65.70 cluster zone. A decisive break above $66.00 could further interest near-term gains and short to medium term uptrend.
Traders will be closely watching upcoming macroeconomic indicators and geopolitical developments for further cues, with sentiment likely to remain fragile in the near term.


USCRUDEOIL - Potential SellHi Traders,
Here is my view on CMCMARKETS:USCRUDEOIL
BIAS: SELL
Logical Analysis:
From April 2020 to March 2022, oil experienced strong buyer demand, pushing price aggressively from the $7 level up to around $120.
At that point, sellers stepped in, and a temporary agreement between buyers and sellers was established around the $120 zone — a fair value at the time.
Since March 2022, price has been declining — entering a discount phase.
However, the move has not been sharp or aggressive, suggesting sellers are not in a rush.
Importantly, no significant buyer interest has been observed during this entire discounted phase.
🛒 Interpretation:
The “store” (market) offered oil at a huge premium until buyers stopped stepping in at high prices. Since then, the price has been marked down gradually, waiting for a new batch of interested buyers — who haven’t shown up yet but be aware.
Technical Analysis: see chart
Good Luck


WTI CRUDE OIL: Short term rebound on RSI Bullish DivergenceWTI Crude Oil is bearish on its 1D technical outlook (RSI = 38.958, MACD = -2.110, ADX = 28.985) as it remains on a multi-month Low. The 1D RSI however displays a HL Bullish Divergence and this can cause a short term price rebound. The Resistance is the Pivot Zone and short term the LH trendline is what maintains the downtrend. Consequently, we are now bullish, TP = 64.90.
## If you like our free content follow our profile to get more daily ideas. ##
## Comments and likes are greatly appreciated. ##

Today's Layout Strategy for Crude OilOn Tuesday, due to the increase in demand from Asia and Europe, the decline in U.S. production, and the further escalation of the situation in Israel, international oil prices soared. After today's opening, oil prices have remained volatile at a high level, demonstrating strong resilience. The key dividing line between bulls and bears is at the crucial price level of $58.4. As long as this price level is not effectively broken, it will be difficult for the bullish trend of oil prices to change. Currently, oil prices are still within the bullish channel.
In terms of today's trading strategy, it is recommended to mainly place long orders on pullbacks, supplemented by a small number of short positions. Pay close attention to the resistance range of $60.8 - $61.6 above, and closely monitor the support area of $58.9 - $58.0 below.
USOIL
buy@58.80-59.30
tp:60.00-61.00
Investment itself is not risky; it is only when investment is out of control that risks occur. When trading, always remember not to act on impulse. I will share trading signals every day. All the signals have been accurate without any mistakes for a whole month. No matter what gains or losses you've had in the past, with my help, you have the hope of achieving a breakthrough in your investment.

Bullish breakout?WTI Oil (XTI/USD) is reacting off the pivot which is a pullback resistance and could potentially rise to the 1st resistance.
Pivot: 59.28
1st Support: 57.84
1st Resistance: 61.83
Risk Warning:
Trading Forex and CFDs carries a high level of risk to your capital and you should only trade with money you can afford to lose. Trading Forex and CFDs may not be suitable for all investors, so please ensure that you fully understand the risks involved and seek independent advice if necessary.
Disclaimer:
The above opinions given constitute general market commentary, and do not constitute the opinion or advice of IC Markets or any form of personal or investment advice.
Any opinions, news, research, analyses, prices, other information, or links to third-party sites contained on this website are provided on an "as-is" basis, are intended only to be informative, is not an advice nor a recommendation, nor research, or a record of our trading prices, or an offer of, or solicitation for a transaction in any financial instrument and thus should not be treated as such. The information provided does not involve any specific investment objectives, financial situation and needs of any specific person who may receive it. Please be aware, that past performance is not a reliable indicator of future performance and/or results. Past Performance or Forward-looking scenarios based upon the reasonable beliefs of the third-party provider are not a guarantee of future performance. Actual results may differ materially from those anticipated in forward-looking or past performance statements. IC Markets makes no representation or warranty and assumes no liability as to the accuracy or completeness of the information provided, nor any loss arising from any investment based on a recommendation, forecast or any information supplied by any third-party.

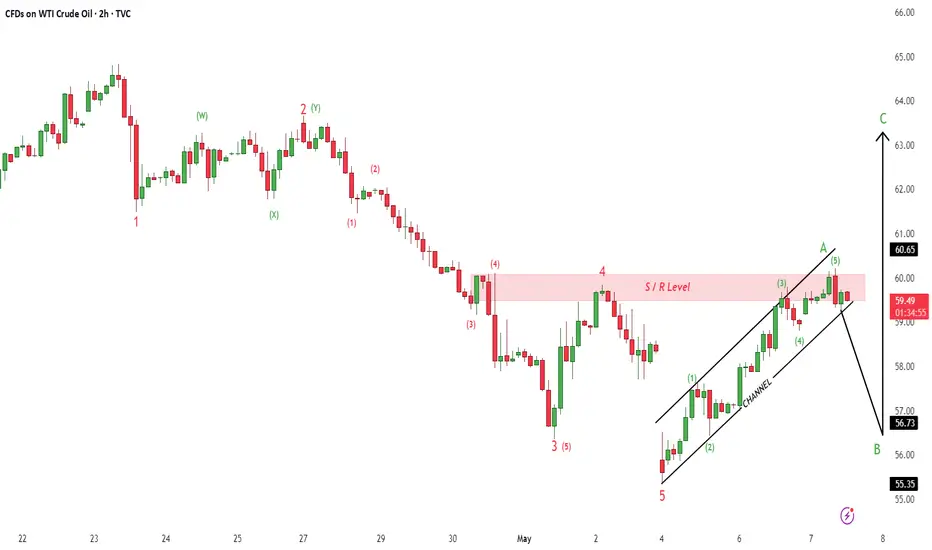
Hellena | Oil (4H): SHORT to support area of 55.204.Colleagues, I believe that the price will continue its downward movement. At the moment we are observing a combined correction. I expect the completion of wave “Y”. Even if it is already completed, the price is still waiting for a downward correction to the support area of 55.204. Therefore, I think that 55.204 is the 1st minimum target.
There are two possible ways to enter the position:
1) Market entry
2) Pending Limit orders.
Manage your capital correctly and competently! Only enter trades based on reliable patterns!

Oil to soon hit below $50.0Please ignore that Asia BOX. Besides that oil is coming further down. but trying to fine tune my entry and exit setup. For me this would be a nice good grade setup cuz of L mapping. I think its got more downside to fall. Hope its not too greedy to set that huge of TP but you never know with commodities and expectations run outside of the reality as bigger the TF more inaccurate you shall be.


Oil Drop Short Position
Greetings Traders this is my idea on Oil and it is a Long shot for a Short.
This is my explanation:
On the 4H chart of WTI crude oil, we can observe a well-defined downtrend that began near the $72.50 level. After a sharp sell-off, price entered a brief accumulation phase and has now pulled back into a previous support zone — now acting as resistance — offering a prime opportunity for trend continuation.
🔑 Key Technical Zones:
🟥 Beginning of a Downtrend: Around $72.50 – local top and start of bearish momentum.
🟧 Breakdown Zone: Around $59.00 – key support turned resistance after a strong breakdown.
🟦 Accumulation Zone: Around $62.00–64.00 – consolidation phase before continuing lower.
✅ Retracement Area (Green Box): Around $60.00–60.25 – previous support now acting as resistance; ideal zone to re-enter short.
🔵 Target Zone: $53.30 – projected next support level and target for the short position.
🎯 Active Short Position:
Entry: $60.00
Stop Loss: $61.20 (above retracement zone)
Take Profit: $53.30
Risk/Reward Ratio: ~1:4.5
After a confirmed bearish structure, price pulled back into the retracement area, which previously acted as support. This area is now likely to serve as resistance, and price rejection here aligns with a high-probability trend continuation trade.
The target for the short is set at $53.30, which corresponds with the previous swing low, while the stop loss is positioned safely above the rejection zone to avoid false breakouts.
📈 Conclusion:
This setup reflects a textbook lower high formation within a strong downtrend, offering a clean structure and favorable risk-to-reward ratio. Watching closely for bearish confirmations within the retracement zone to validate momentum continuation.
Dear Traders like,comment let me know what do you think?

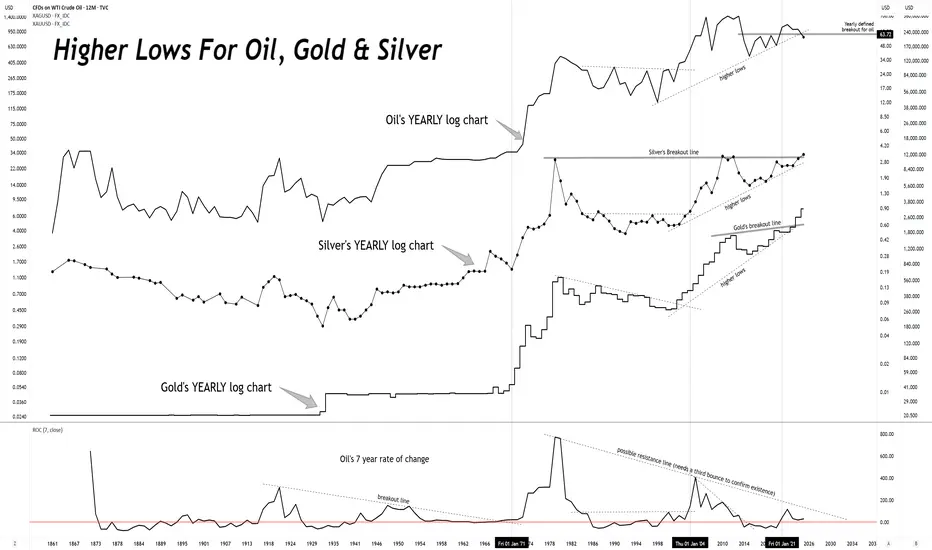
What do silver and oil have in common? Price.Since 1861, silver and crude oil charts have trended together rather well.
So, if you think there is a "cartel" which manipulates the silver, there must also be manipulating crude oil.
Or, the more logical explanation is that capital flows are carving out these price charts.


Bearish reversal off pullback resistance?USO/USD is reacting off the resistance level which is a pullback resistance that is slightly below the 50% Fibonacci retracement and could drop from this level to our take profit.
Entry: 60.04
Why we like it:
There is a pullback resistance level that is slightly below the 50% Fibonacci retracement.
Stop loss: 62.00
Why we like it:
There is a pullback resistance level that is slightly below the 71% Fibonacci retracement.
Take profit: 56.89
Why we like it:
There is a pullback support level.
Enjoying your TradingView experience? Review us!
Please be advised that the information presented on TradingView is provided to Vantage (‘Vantage Global Limited’, ‘we’) by a third-party provider (‘Everest Fortune Group’). Please be reminded that you are solely responsible for the trading decisions on your account. There is a very high degree of risk involved in trading. Any information and/or content is intended entirely for research, educational and informational purposes only and does not constitute investment or consultation advice or investment strategy. The information is not tailored to the investment needs of any specific person and therefore does not involve a consideration of any of the investment objectives, financial situation or needs of any viewer that may receive it. Kindly also note that past performance is not a reliable indicator of future results. Actual results may differ materially from those anticipated in forward-looking or past performance statements. We assume no liability as to the accuracy or completeness of any of the information and/or content provided herein and the Company cannot be held responsible for any omission, mistake nor for any loss or damage including without limitation to any loss of profit which may arise from reliance on any information supplied by Everest Fortune Group.

