USOIL Will Go Higher From Support! Buy!
Take a look at our analysis for USOIL.
Time Frame: 2h
Current Trend: Bullish
Sentiment: Oversold (based on 7-period RSI)
Forecast: Bullish
The market is testing a major horizontal structure 67.337.
Taking into consideration the structure & trend analysis, I believe that the market will reach 69.433 level soon.
P.S
The term oversold refers to a condition where an asset has traded lower in price and has the potential for a price bounce.
Overbought refers to market scenarios where the instrument is traded considerably higher than its fair value. Overvaluation is caused by market sentiments when there is positive news.
Disclosure: I am part of Trade Nation's Influencer program and receive a monthly fee for using their TradingView charts in my analysis.
Like and subscribe and comment my ideas if you enjoy them!
USOUSD trade ideas


US OIL Bullish Move is coming?Hi Traders.
MTF Correctional Structure but it seems that this is
not a correction to go further down instead a correction to reverse.
We see a clear Inverse HnS Pattern
Breakout and correction is forming
Wait for the current correction to finish to confirm
this bullish setup

The rollover of crude oil contracts leads to price differences.Crude oil is currently in the contract rollover phase, and prices may vary between different brokers. For specific trading strategies, you can contact me directly, and I will provide you with accurate trading strategies accordingly.
I am committed to sharing trading signals every day. Among them, real-time signals will be flexibly pushed according to market dynamics. All the signals sent out last week accurately matched the market trends, helping numerous traders achieve substantial profits. Regardless of your previous investment performance, I believe that with the support of my professional strategies and timely signals, I will surely be able to assist you in breaking through investment bottlenecks and achieving new breakthroughs in the trading field.

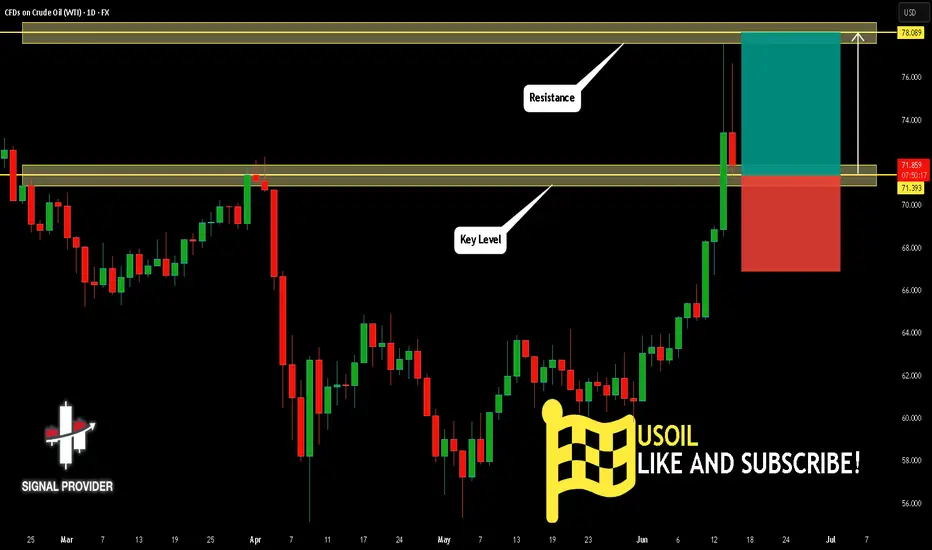
USOIL Will Move Higher! Buy!
Please, check our technical outlook for USOIL.
Time Frame: 1D
Current Trend: Bullish
Sentiment: Oversold (based on 7-period RSI)
Forecast: Bullish
The price is testing a key support 71.393.
Current market trend & oversold RSI makes me think that buyers will push the price. I will anticipate a bullish movement at least to 78.089 level.
P.S
Overbought describes a period of time where there has been a significant and consistent upward move in price over a period of time without much pullback.
Disclosure: I am part of Trade Nation's Influencer program and receive a monthly fee for using their TradingView charts in my analysis.
Like and subscribe and comment my ideas if you enjoy them!
CRUDE OIL Swing Short! Sell!
Hello,Traders!
USOIL keeps growing
And Oil is locally overbought
So after the price hit a very
Strong resistance level
Around 65.00$ we will be
Expecting a pullback and
A local bearish correction
Sell!
Comment and subscribe to help us grow!
Check out other forecasts below too!
Disclosure: I am part of Trade Nation's Influencer program and receive a monthly fee for using their TradingView charts in my analysis.


USOUL:Go long near 65.5
USOIL:Crude oil broke through the watershed 64.85 after the emergence of strong unilateral bulls, daily cycle relying on short-term average to go even Yang form, rising space has opened, pay attention to the strong will continue at least a few trading days, short-term relying on 65 defense needs to be more, pay attention to 65.5 near the long, see 66.7-67
Trading Strategy:
BUY@65.5
TP: 66.7-67
↓↓↓ More detailed strategies and trading will be notified here ↗↗↗
↓↓↓ Keep updated, come to "get" ↗↗↗

Crude Oil Surges on Summer Demand and Trade OptimismOn the weekly chart, crude oil trades above the mid-range of a descending channel that has been in place since the 2022 highs. The RSI remains just below the neutral zone, suggesting a cautiously bullish-to-neutral outlook while prices hover near the $65 resistance level.
From a daily perspective, oil prices are breaking out above the $65 resistance, and a firm hold could pave the way toward $66 and potentially retest the $71 and $73 levels.
On the downside, the psychological support at $60 remains critical. A break below $60—and more critically, below the $58 moving average—could reintroduce long term bullish positioning from $55 and $49.
- Razan Hilal, CMT

WTI OIL Might be close to the end of correction or finished it.there are definetly more than 1 posibilities in this one, 1 more down wave can occur and that is why i have a invalidation level. long term definetly buy but short and mid term is just not very clear, i am thinking it s time to buy. what i am going to do is keep track of it a bit more in short term and if it gives me good buying opportunity near the below i will enter the trade with a stop loss. and if it upbrakes possible impulse wave will occur and i will buy again to mid term target. so for now keep an eye on it and buy if the opportunity arise.

Oil (WTI) – Geo-Political Concerns Drive SentimentA quickly escalating conflict in the Middle East between Israel and Iran has seen Oil (WTI) volatility increase dramatically as the focus for traders has shifted overnight from worries about an on-going lack of demand due to a slowing global economy over to major supply concerns moving forward from this oil rich region.
This shift has seen Oil trade from lows of 60.17 on May 30th, to an early Monday high of 76.31, as weekend attacks by Israel on Iran's energy infrastructure introduced more uncertainty at the start of this new trading week regarding Israel's future strategy in this conflict. Prices have since settled down and moved back towards 72.80 (0830 BST) at time of writing but looking forward traders may need to balance the potential for further escalation/duration of this conflict against extra Oil production/supply from OPEC+ and the US.
Also important for Oil prices across the week could be the outcome of the Federal Reserve (Fed) Interest Rate Decision (Wed 1900 BST) and Press Conference (Wed 1930 BST). No change to interest rates is expected, but the updates from Fed policymakers to their inflation and interest rate expectations for the rest of 2025 could have a major impact on risk sentiment, the dollar and anticipated Oil demand.
Technical Update: Utilising Bollinger Bands
A rise in tensions in the Middle East last week prompted a sharp acceleration higher in the price of Oil. This saw price volatility increase, reflected by the widening upper and lower Bollinger bands and prices trading to levels last seen in late January 2025, as the chart below shows.
Traders will now likely be wondering if this type of price strength can continue, or if prices can enter a correction phase, even possibly a more extended period of price weakness.
Much will clearly depend on future market sentiment and price trends, and on any easing or escalation in geo-political tensions. However, with this in mind let's consider what may be the relevant support and resistance levels .
Potential Resistance Levels:
As the chart shows below, interestingly, last weeks price strength stalled against 75.99, which is equal to the February 3rd session high and with a setback in price developing from it so far today, this might be viewed by some as a potential first resistance.
As such, while not a guarantee of further price strength, closing breaks above 75.99 may be a sign of continued upside momentum towards 81.01, which is the January 15th price high and a potential next resistance focus for traders.
Potential Support Levels:
After such a strong advance in price, it might be harder to establish support levels, although, Fibonacci retracement levels on the recent May 30th to June 16th upside move in price, might prove useful. These retracement levels are highlighted on the chart below.
The 38.2% Fibonacci retracement of the price strength stands at 70.12 and this might prove to be a possible first support focus, if price weakness is seen over coming days. Closing breaks below 70.12, if seen, may then lead to declines towards 66.32, the deeper 61.8% Fibonacci retracement level.
The material provided here has not been prepared
accordance with legal requirements designed to promote the independence of investment research and as such is considered to be a marketing communication. Whilst it is not subject to any prohibition on dealing ahead of the dissemination of investment research, we will not seek to take any advantage before providing it to our clients.
Pepperstone doesn’t represent that the material provided here is accurate, current or complete, and therefore shouldn’t be relied upon as such. The information, whether from a third party or not, isn’t to be considered as a recommendation; or an offer to buy or sell; or the solicitation of an offer to buy or sell any security, financial product or instrument; or to participate in any particular trading strategy. It does not take into account readers’ financial situation or investment objectives. We advise any readers of this content to seek their own advice. Without the approval of Pepperstone, reproduction or redistribution of this information isn’t permitted.

Crude oil continues to decline - latest market trend analysisThe international oil market is currently experiencing a classic upward cycle of "geopolitical risk premium". In the short term, oil prices will be highly sensitive to any news regarding the security of the Strait of Hormuz. Crude oil has continued its volatile upward trend in the short term, surging to test the price near $74. The moving average system is bullishly aligned with oil prices, and the objective short-term trend direction remains upward.
In early trading, oil prices hit a new high near $75.30, but then surged and fell, closing with a bearish real body K-line. The short-term momentum still favors the bulls, and it is expected that the intraday trend of crude oil will continue to maintain a high-level volatile upward rhythm.
you are currently struggling with losses,or are unsure which of the numerous trading strategies to follow,You have the option to join our VIP program. I will assist you and provide you with accurate trading signals, enabling you to navigate the financial markets with greater confidence and potentially achieve optimal trading results.
Trading Strategy:
buy@68.5.0-69.5
TP:73.0-74.0
Crude Oil Challenges 2-Year ChannelAmid rising summer demand, an inverted head and shoulders breakout from oversold 2020 levels, and the recent outbreak of war between Israel and Iran, crude oil has tested the upper boundary of the declining channel originating from the 2022 highs. This test comes as supply risks for the coming month intensify.
This upper boundary aligns with the $77 resistance level. A confirmed breakout and sustained hold above this level could shift momentum more decisively to the bullish side, potentially paving the way for a retest of the $80 and $83.50 levels.
On the downside, if oil fails to maintain its gains and resumes a pullback, key support zones are located around $69, $66, and $64, reestablishing bearish dominance within the channel.
— Razan Hilal, CMT

Crude oil is gaining volatilityCrude oil accelerates the momentum as the geopolitical situation escalates. Volatility is high, so trading might be dangerous both for longs and shorts, especially for day or short-term traders.
So, it would make sense to wait for a while until the “smoke goes down” and the price would establish a temporary trading range, which would later be broken to any direction.
The price currently is above the 20-day moving average for $12 in terms of asset price, which is more than 5 times greater than the average daily volatility. It either points to the “overheated” situation or potentially a momentum situation, which means the rapid continuation to the upside after a short phase of consolidation (usually 2-3 days).
Don't forget - this is just the idea, always do your own research and never forget to manage your risk!

Crude oil breaks through strongly.On the daily chart of crude oil, the upper Bollinger Band is opening upward, and the 64.85 level is basically unable to hold. Once this level is broken, it will open up upward space, and the rally will just be beginning. After the breakout, the market will shift from the previous sustained oscillation to a strong unilateral trend, and the rally will at least continue with a wave of strength. Focus on going long at 63.50/64, or if there is a strong rally in the European session, pullbacks in the US session are also buying opportunities. Now it is about whether there will be a strong breakout.
Humans need to breathe, and perfect trading is like breathing—maintaining flexibility without needing to trade every market swing. The secret to profitable trading lies in implementing simple rules: repeating simple tasks consistently and enforcing them strictly over the long term.
Trading Strategy:
buy@63.5-64.0
TP:65.5-66.0

USOIL🛢️ USOIL (WTI Crude Oil) – Technical Outlook & Forecast
Current Price: $64.55
Bias: Bullish Only
Forecast Levels: $82.00 → $85.00 → $90.00+
🔍 Market Overview:
Crude oil (USOIL) is currently trading around $64.55, showing early signs of a potential bullish reversal from multi-month lows. Despite recent volatility and macroeconomic uncertainties, the technical structure indicates the formation of a solid accumulation base, potentially preparing for a significant upward move.
📈 Technical Perspective:
Price Action: Oil is attempting to reclaim key support zones that have held historically during large-scale recoveries.
Momentum: Oscillators (like RSI/MACD) may be turning up from oversold territory (subject to chart confirmation), further supporting the bullish scenario.
Volume Profile: Accumulation at lower levels hints at smart money interest around the $60–$65 zone.
🎯 Bullish Targets:
$82.00 – Psychological and technical resistance
$85.00 – Previous swing high / Fib extension zone
$90.00+ – Medium-term projection if momentum sustains
🧭 Conclusion:
The bias for USOIL remains bullish only while the $60–$62 zone holds firm as support. Breakout above near-term resistances could open the way for a strong move toward $82, $85, and even $90+. Keep an eye on macro events and inventory data for short-term volatility.
🟢 Trade Setup Idea (For Reference Only):
Long bias above $64–$65 support zone, targeting $82–$90 over the coming weeks/months. Use proper risk management.

TRADE ALERT: USOIL SELL SETUP ENTRY: 64.50 (Sell)TRADE ALERT: USOIL SELL SETUP
ENTRY: 64.50 (Sell)
🎯 Target 1: 64.00
🎯 Target 2: 63.00
🎯 Target 3: 62.00
🎯 Final Target: 60.00
🛑 STOP LOSS: Always use proper risk management!
⚠️ Risk no more than 1–2% of your capital per trade.
🔍 Setup based on technical analysis and price action.
💡 Breakdown:
• Strong resistance near 64.50
• Bearish momentum building
• Downtrend continuation likely
📊 Monitor volume and market sentiment
🧠 Stay disciplined, don’t chase entries
⏰ Timing is key — watch for confirmation
📅 Short to mid-term outlook
📌 This is not financial advice, just my trading plan.
✅ Stick to your rules
🔁 Trade the plan, not emotions
#USOIL #CrudeOil #TradingSignals #SellSetup #Forex #Commodities #RiskManagement #TradeSmart #TechnicalAnalysis #PriceAction


USOIL:Sharing of the Trading Strategy for Next WeekAll the trading signals this week have resulted in profits!!! Check it!!!👉👉👉
Fundamental Analysis:
OPEC+ plans to increase production by 411K bpd in July, with major producers like Saudi Arabia and the UAE holding ample idle capacity. This expansion could exacerbate global crude oil oversupply, pressuring prices. Concurrently, the U.S. steel import tariff hikes may trigger trade frictions, dampening global economic recovery and curbing industrial crude demand.
Technical Analysis:
The MACD indicator shows expanding green bars (bearish momentum), with short-term moving averages trending toward a bearish crossover of long-term averages. However, recent price retracement from relative highs suggests potential rebound. Key resistance lies at the $66–67/barrel zone, while critical support holds at $61.5–62/barrel.
Trading Recommendation:
Aggressive traders may initiate light short positions near 66 on a confirmed resistance rejection.
Trading Strategy:
Sell@66-65.5
TP:63-62
Share accurate trading signals daily—transform your life starting now!
👇 👇 👇 Obtain signals👉👉👉

WTI CRUDE OIL: Going for a LH rejection. Sell signal.WTI Crude Oil is practically neutral on its 1D technical outlook (RSI = 55.991, MACD = 0.160, ADX = 24.748) as it's on the 3rd straight day of flat consolidation on the 1D MA50. The last time it did this was on April 2nd, which resulted in a LH rejection to the S1 level. As the presence of the R1 level (64.90) is just above, we expect the market to get rejected and aim for the S1 again (TP = 56.00).
## If you like our free content follow our profile to get more daily ideas. ##
## Comments and likes are greatly appreciated. ##

USOIL SHORT FROM RESISTANCE
USOIL SIGNAL
Trade Direction: short
Entry Level: 64.71
Target Level: 56.98
Stop Loss: 69.85
RISK PROFILE
Risk level: medium
Suggested risk: 1%
Timeframe: 1D
Disclosure: I am part of Trade Nation's Influencer program and receive a monthly fee for using their TradingView charts in my analysis.
✅LIKE AND COMMENT MY IDEAS✅

Crude oil pullback bullish trend
💡Message Strategy
Saudi price cuts and OPEC+ supply adjustments affect market sentiment
Crude oil came under pressure in the middle of the week after Saudi Arabia cut its July sales price to Asia to the lowest level in nearly two months. This follows OPEC+'s decision to increase production by 411,000 barrels per day in July, indicating that major oil producers are still prioritizing market share even amid volatile demand signals. This coordinated move by Saudi Arabia and Russia is seen as an attempt to constrain overproducers and strengthen control over global supply dynamics.
Refineries drive crude stock draw, but fuel demand lacks
Weekly data from the U.S. Energy Information Administration (EIA) delivered mixed messages. U.S. crude stockpiles fell by 4.3 million barrels to 436.1 million barrels, driven by a sharp increase in refinery runs, exceeding expectations. Utilization rose to 93.4%, indicating that refineries are preparing for a seasonal peak in demand. Adding to the bullish signal from the crude stock draw.
📊Technical aspects
On the technical side, the daily chart of WTI crude oil shows that oil prices have been under pressure for three consecutive trading days and are currently trading above the 20-day and 50-day moving averages, reflecting the dominance of short-term bullish sentiment. The MACD indicator shows a dead cross and the momentum column is enlarged, indicating that the upward trend is still continuing.
In the previous post, we have pointed out that the upward target and trend of crude oil have been reached. The main theme of crude oil in the future will still be a bullish correction.
💰 Strategy Package
Long Position: 62.50-63.00

Could the price bounce from here?WTI Oil (WTI/USD) is falling towards the pivot, which has been identified as an overlap support and could bounce to the 1st resistance, which is a pullback resistance.
Pivot: 62.36
1st Support: 61.81
1st Resistance: 63.24
Risk Warning:
Trading Forex and CFDs carries a high level of risk to your capital and you should only trade with money you can afford to lose. Trading Forex and CFDs may not be suitable for all investors, so please ensure that you fully understand the risks involved and seek independent advice if necessary.
Disclaimer:
The above opinions given constitute general market commentary, and do not constitute the opinion or advice of IC Markets or any form of personal or investment advice.
Any opinions, news, research, analyses, prices, other information, or links to third-party sites contained on this website are provided on an "as-is" basis, are intended only to be informative, is not an advice nor a recommendation, nor research, or a record of our trading prices, or an offer of, or solicitation for a transaction in any financial instrument and thus should not be treated as such. The information provided does not involve any specific investment objectives, financial situation and needs of any specific person who may receive it. Please be aware, that past performance is not a reliable indicator of future performance and/or results. Past Performance or Forward-looking scenarios based upon the reasonable beliefs of the third-party provider are not a guarantee of future performance. Actual results may differ materially from those anticipated in forward-looking or past performance statements. IC Markets makes no representation or warranty and assumes no liability as to the accuracy or completeness of the information provided, nor any loss arising from any investment based on a recommendation, forecast or any information supplied by any third-party.

