WTI Oil D1 | Approaching a swing-high resistanceWTI oil (USOIL) could rise towards a swing-high resistance and potentially reverse off this level to drop lower.
Sell entry is at 62.71 which is a swing-high resistance.
Stop loss is at 66.00 which is a level that sits above the 61.8% Fibonacci retracement and a pullback resistance.
Take profit is at 58.18 which is a swing-low support.
High Risk Investment Warning
Trading Forex/CFDs on margin carries a high level of risk and may not be suitable for all investors. Leverage can work against you.
Stratos Markets Limited (tradu.com):
CFDs are complex instruments and come with a high risk of losing money rapidly due to leverage. 63% of retail investor accounts lose money when trading CFDs with this provider. You should consider whether you understand how CFDs work and whether you can afford to take the high risk of losing your money.
Stratos Europe Ltd (tradu.com):
CFDs are complex instruments and come with a high risk of losing money rapidly due to leverage. 63% of retail investor accounts lose money when trading CFDs with this provider. You should consider whether you understand how CFDs work and whether you can afford to take the high risk of losing your money.
Stratos Global LLC (tradu.com):
Losses can exceed deposits.
Please be advised that the information presented on TradingView is provided to Tradu (‘Company’, ‘we’) by a third-party provider (‘TFA Global Pte Ltd’). Please be reminded that you are solely responsible for the trading decisions on your account. There is a very high degree of risk involved in trading. Any information and/or content is intended entirely for research, educational and informational purposes only and does not constitute investment or consultation advice or investment strategy. The information is not tailored to the investment needs of any specific person and therefore does not involve a consideration of any of the investment objectives, financial situation or needs of any viewer that may receive it. Kindly also note that past performance is not a reliable indicator of future results. Actual results may differ materially from those anticipated in forward-looking or past performance statements. We assume no liability as to the accuracy or completeness of any of the information and/or content provided herein and the Company cannot be held responsible for any omission, mistake nor for any loss or damage including without limitation to any loss of profit which may arise from reliance on any information supplied by TFA Global Pte Ltd.
The speaker(s) is neither an employee, agent nor representative of Tradu and is therefore acting independently. The opinions given are their own, constitute general market commentary, and do not constitute the opinion or advice of Tradu or any form of personal or investment advice. Tradu neither endorses nor guarantees offerings of third-party speakers, nor is Tradu responsible for the content, veracity or opinions of third-party speakers, presenters or participants.
USOUSD trade ideas

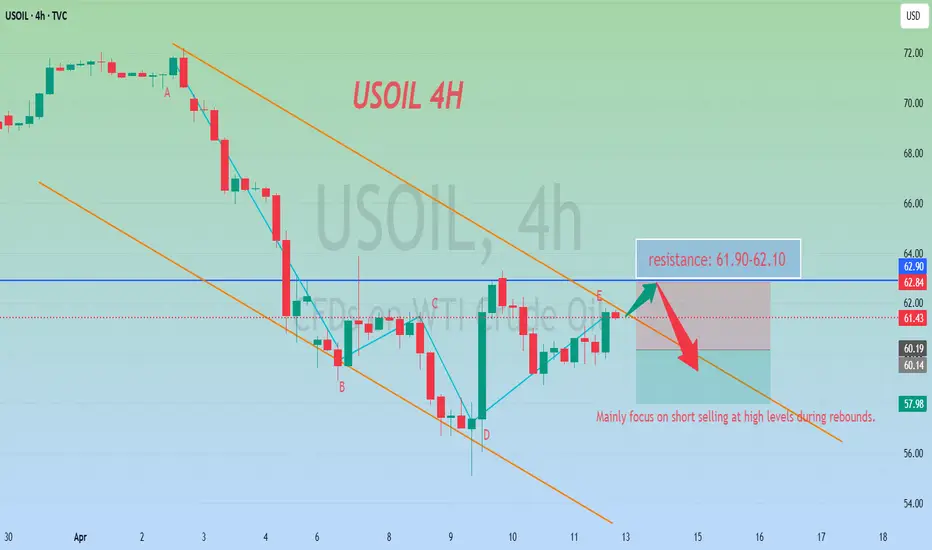
Strategic Analysis of Crude Oil for Next WeekBehind the current fluctuations in international oil prices lies the market's deep anxiety over the extreme uncertainty of global trade policies. Trump's "suspension + escalation" approach has, in the short term, stabilized relations with non - Chinese economies, but it has also dealt a blow to the global supply chain and energy consumption confidence.
In terms of the trading ideas for crude oil next week, it is recommended to mainly go short at high levels during rebounds and go long at low levels during pullbacks as a supplement. In the short term, pay attention to the resistance level in the range of 62.8 - 63.2. In the short term, focus on the support level in the range of 60.5 - 59.5.
Oil trading strategy:
sell @ 61.90-62.10
sl 62.80
tp 61.70-61.40
If you approve of my analysis, you can give it a thumbs-up as support. If you have different opinions, you can leave your thoughts in the comments.Thank you!
USOIL BULLISH BIAS RIGHT NOW| LONG
USOIL SIGNAL
Trade Direction: long
Entry Level: 61.45
Target Level: 73.89
Stop Loss: 53.11
RISK PROFILE
Risk level: medium
Suggested risk: 1%
Timeframe: 1D
Disclosure: I am part of Trade Nation's Influencer program and receive a monthly fee for using their TradingView charts in my analysis.
✅LIKE AND COMMENT MY IDEAS✅


USOIL: Local Bearish Bias! Short!
My dear friends,
Today we will analyse USOIL together☺️
The in-trend continuation seems likely as the current long-term trend appears to be strong, and price is holding below a key level of 61.501 So a bearish continuation seems plausible, targeting the next low. We should enter on confirmation, and place a stop-loss beyond the recent swing level.
❤️Sending you lots of Love and Hugs❤️

Crude oil is under pressure, as recession fears reviveCrude oil had initiated a classical short coverage rally: despite a big bullish day, around 2% (42699 contracts on Nymex) of total open interest for Crude oil futures was liquidated, which means that a massive pullback was not associated with the new business coming in, but rather an old business getting out.
Despite the local optimism, market fear still dominates with VIX getting back to 46: a quite notable level. With that we can expect USOIL to continue sliding down in the near future and reaching the area below $57, at least temporarily. The fair price according to expected supply and demand had shifted to $60 (previously $75), as published in the short-term energy outlook from eia.gov
Don't forget - this is just the idea, always do your own research and never forget to manage your risk!

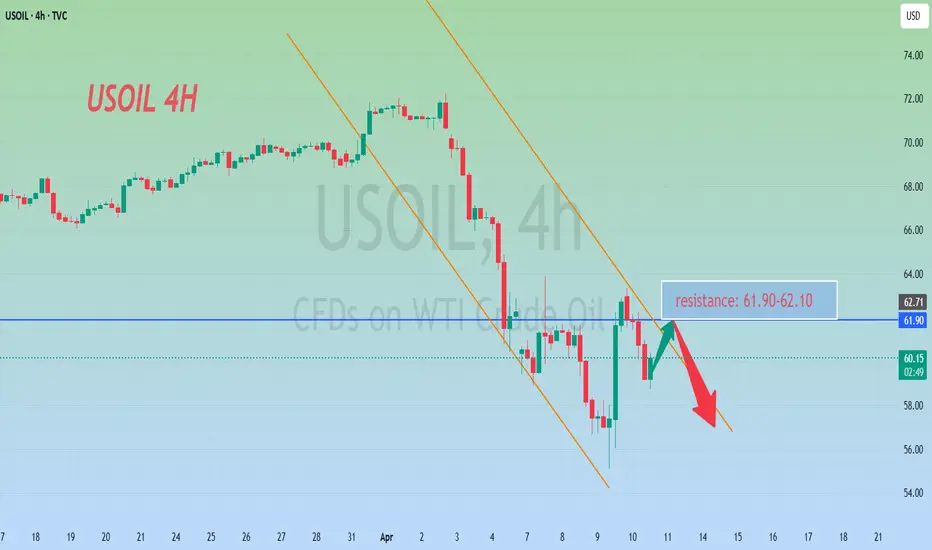
Analysis of Crude Oil StrategiesCrude oil bottomed out and rebounded sharply on Wednesday. This was also due to the impact of the tariff war, which is currently dominating the trend of the financial market. However, on Thursday, it didn't continue to rise. Instead, it fell successively and retraced. Pay attention to going long at the support level of 58.20 below, and consider going short at the resistance level of 61.90 above.
Oil trading strategy:
sell @ 61.90-62.10
sl 62.80
tp 60.95-61.10
If you approve of my analysis, you can give it a thumbs-up as support. If you have different opinions, you can leave your thoughts in the comments.Thank you!
Oil Bounces from Demand LONG📈 WTI Crude Oil – 15M Long Setup | Demand Zone + Macro Confluence
This long setup on WTI was taken after price tapped into a key 15-minute demand zone, following a sharp NY session selloff. The entry aligns with both technical and macroeconomic confluences, suggesting a potential intraday reversal.
⸻
🔍 Macro Context
• Recent volatility triggered by geopolitical tensions in the Middle East and a larger-than-expected U.S. crude inventory build.
• Early DXY strength pressured oil prices, but a pullback around the New York Open created ideal conditions for a bounce.
• Market participants are repositioning ahead of U.S. CPI data and Fed speakers, creating liquidity sweeps and short-term inefficiencies.
• OPEC+ supply discipline and long-term underinvestment in energy infrastructure continue to support a bullish medium-term narrative.
⸻
📊 Technical Setup
• Entry: Rejection from 15M demand zone after liquidity sweep
• Stop Loss: Below demand zone and intraday low
• Take Profit: Imbalance fill near NYO and previous intraday structure (Target 60.55)
• R:R: 5.25
• Session: New York – increased volume and volatility
This setup is a great example of combining Smart Money Concepts (SMC) with macro catalysts, aiming to capture a high-probability reaction from an institutional zone during peak liquidity hours.

"WTI Crude Oil – Bullish Bounce from Demand Zone? "🔵 . Demand Zone:
⬇️ 60.53 – 59.71
This is the buy zone where bulls are likely to step in!
Price is currently testing this area. Watch closely!
🛑 . Stop Loss (Risk Zone):
📉 Below 59.66
If price falls below here, exit the trade – demand has failed.
🎯 . Target Point:
🚀 63.85
This is the take profit zone. A successful bounce could reach this level!
🟠 . EMA (9-period DEMA):
📉 Currently around 60.86
Price is slightly below EMA, showing short-term bearish pressure.
🟢 . Trade Idea Summary:
• Enter near the blue demand zone
• SL below 🔴 59.66
• TP at 🎯 63.85
• R:R ratio looks favorable (low risk, high reward)
Outlook:
As long as price holds above the demand zone, this setup remains bullish 📈
Let’s see if the bulls can push it to that 63.85 target! 🚀💰


bearsTechnically going to check the London sessions bottom.Commercial crude oil stocks excluding the Strategic Petroleum Reserve rose by 2.6 million barrels to 442.3 million barrels in the week ended April 4, and were about 5% below the five-year average for the time of year, the EIA said. Analysts surveyed by The Wall Street Journal had predicted crude stockpiles would rise by 2.1 million barrels.

WTI Crude Oil selling pressure continuationWTI Crude Oil is showing bearish sentiment, in line with the current downtrend. Recent price action confirms a break below a key consolidation zone, adding pressure to the downside.
Key Levels:
Resistance: 6065 (former support, now resistance), 6307, 6400
Support: 5480, 5336, 5200
Bearish Outlook:
Price has broken below 6065, which was a key intraday consolidation level. If WTI sees a short-term bounce but fails to break above 6065, it could resume its downward move toward 5480, then 5336, and possibly 5200 over time.
Bullish Scenario:
If WTI breaks above 6065 and closes above it on the daily chart, the bearish setup would be invalidated. This could open the door for a rally toward 6307, then 6400.
Conclusion:
The trend remains bearish below 6065. A rejection at this level would reinforce the downside bias. However, a confirmed break and daily close above 6065 would shift the outlook to bullish in the short term.
This communication is for informational purposes only and should not be viewed as any form of recommendation as to a particular course of action or as investment advice. It is not intended as an offer or solicitation for the purchase or sale of any financial instrument or as an official confirmation of any transaction. Opinions, estimates and assumptions expressed herein are made as of the date of this communication and are subject to change without notice. This communication has been prepared based upon information, including market prices, data and other information, believed to be reliable; however, Trade Nation does not warrant its completeness or accuracy. All market prices and market data contained in or attached to this communication are indicative and subject to change without notice.

WTI Oil H4 | Heading into a pullback resistanceWTI oil (USOIL) is rising towards a pullback resistance and could potentially reverse off this level to drop lower.
Sell entry is at 59.51 which is a pullback resistance that aligns with the 38.2% Fibonacci retracement.
Stop loss is at 61.95 which is a level that sits above the 61.8% Fibonacci retracement and an overlap resistance.
Take profit is at 53.41 which is a support level that aligns with the 78.6% Fibonacci projection.
High Risk Investment Warning
Trading Forex/CFDs on margin carries a high level of risk and may not be suitable for all investors. Leverage can work against you.
Stratos Markets Limited (tradu.com):
CFDs are complex instruments and come with a high risk of losing money rapidly due to leverage. 63% of retail investor accounts lose money when trading CFDs with this provider. You should consider whether you understand how CFDs work and whether you can afford to take the high risk of losing your money.
Stratos Europe Ltd (tradu.com):
CFDs are complex instruments and come with a high risk of losing money rapidly due to leverage. 63% of retail investor accounts lose money when trading CFDs with this provider. You should consider whether you understand how CFDs work and whether you can afford to take the high risk of losing your money.
Stratos Global LLC (tradu.com):
Losses can exceed deposits.
Please be advised that the information presented on TradingView is provided to Tradu (‘Company’, ‘we’) by a third-party provider (‘TFA Global Pte Ltd’). Please be reminded that you are solely responsible for the trading decisions on your account. There is a very high degree of risk involved in trading. Any information and/or content is intended entirely for research, educational and informational purposes only and does not constitute investment or consultation advice or investment strategy. The information is not tailored to the investment needs of any specific person and therefore does not involve a consideration of any of the investment objectives, financial situation or needs of any viewer that may receive it. Kindly also note that past performance is not a reliable indicator of future results. Actual results may differ materially from those anticipated in forward-looking or past performance statements. We assume no liability as to the accuracy or completeness of any of the information and/or content provided herein and the Company cannot be held responsible for any omission, mistake nor for any loss or damage including without limitation to any loss of profit which may arise from reliance on any information supplied by TFA Global Pte Ltd.
The speaker(s) is neither an employee, agent nor representative of Tradu and is therefore acting independently. The opinions given are their own, constitute general market commentary, and do not constitute the opinion or advice of Tradu or any form of personal or investment advice. Tradu neither endorses nor guarantees offerings of third-party speakers, nor is Tradu responsible for the content, veracity or opinions of third-party speakers, presenters or participants.


Trump vs. ChinaDonald Trump’s recent actions show strong similarities to key moments in history. His push for high tariffs on imports reminds us of the 1930 Smoot-Hawley Tariff Act, which aimed to protect American jobs but ended up hurting the economy when other countries struck back with their own tariffs. Today, we’re seeing the same pattern, Trump’s tariffs on China, the EU, and others have already led to retaliation, and experts warn this could lead to inflation or even a recession. His tough stance on immigration also echoes early 20th century laws like the Immigration Act of 1924, which restricted immigrants to preserve a so called “American identity.” Even his populist, anti elite tone reminds many of President Andrew Jackson, who presented himself as a voice for the common man while shaking up the political system.
On the home front and globally, Trump’s moves also reflect a shift toward isolation similar to what the U.S. tried after World War I. Back then, the U.S. pulled away from global cooperation, and it didn’t work out well. Now, Trump is cutting foreign aid and pulling out of major global agreements like the Paris Climate Accord and the WHO, which could weaken America’s role on the world stage. Domestically, his push to revive coal and cut diversity programs feels like turning back the clock on social and environmental progress. History has shown us that these kinds of decisions often have long term consequences. As the saying goes, history tends to repeat itself and if we don’t learn from it, we may find ourselves repeating the same costly mistakes.


WTI Breaks Flat Support – Eyes on $58.45WTI has completed a textbook flat continuation pattern with a bearish engulfing candle slicing below $65.40 support.
Price is now hovering near $60, with downside momentum targeting $58.45 and $56.50 next.
RSI remains deeply oversold near 26, hinting at potential for a relief bounce. However, as long as price stays below the 50 EMA ($69.05), bearish bias remains intact.


WTI Crude Oil AnalysisHello traders,
After analyzing the current price action, I believe WTI remains bearish in the mid-to-long term. However, in the short term (next few sessions), we might see a temporary bullish correction, as the RSI is signaling oversold conditions.
Since late September 2023, WTI has been in a steady downtrend—clearly visible through the purple trendline—and recently hit its lowest level since early 2023. I'm watching the $66–$67 zone closely: if price reaches but fails to break above it, the downtrend is likely to resume. However, a clean breakout above that range could indicate a potential bullish reversal heading into next week.
This view is based on RSI and key support/resistance zones.
📉 Bearish bias mid/long term
📈 Short-term bounce likely
📍 Key zone to watch: $66–$67
Let me know your thoughts in the comments — are you bullish or bearish on WTI?
Not financial advice — just sharing my personal analysis.

WTI Breakout LowerWTI shed nearly 10% last week and tested levels not seen since early 2021. As a result, the downside move punctured the lower boundary of a descending triangle formation on the weekly chart, extended from a high of US$95.01 and a low of US$64.34. Technically, this opens the door to possible bearish scenarios in the weeks to come toward a decision point zone at US$51.38-US$53.92. With that in mind, if you drill down to the H1 timeframe, you will note a bearish decision point zone formed at the lower boundary of the weekly chart’s descending triangle at US$64.90-US$64.24. This could be a location that traders look to fade from in the event of a pullback-retest play unfolding this week.
Written by FP Markets Chief Market Analyst Aaron Hill
