How long can the decline in US crude oil prices last?
💡Message Strategy
On Monday (August 4) during the Asia-Europe session, WTI fell for three consecutive days, with a drop of 1.16% today, trading around 66.55. OPEC+'s decision to increase production, coupled with geopolitical and economic policies, has jointly formed the expectation that oil prices will be "weak and volatile, dominated by downward pressure."
Short-Term: Increased Supply Drives Price Decline
OPEC+'s decision to increase production directly led to further declines in oil prices on Monday (Brent crude fell 0.28% to $69.23/barrel, and WTI fell 0.46% to $67.01/barrel), extending Friday's decline. Market expectations of oversupply reinforced bearish sentiment, particularly as the UAE's additional production increase (accounting for 2.4% of global demand) further amplified the signal of easing supply. However, India's announcement to continue purchasing Russian crude oil partially offset the impact, limiting the price decline and failing to shift the short-term downward trend.
Medium-Term: Supply-Demand and Policy Risks Intertwine
On the Supply Side: OPEC+'s production increase plan may be paused after September, as Goldman Sachs anticipates accelerated OECD inventory accumulation and fading seasonal demand support. However, if US shale oil production is forced to cut production at break-even points due to low oil prices, OPEC+ may adjust its strategy and even consider further releasing the remaining 1.66 million barrels/day of production capacity, which would continue to suppress oil prices.
Long-Term: Market Share Competition and Structural Overcapacity
OPEC+'s production increase strategy aims to reshape the global oil landscape by squeezing out high-cost producers, such as US shale oil, through low prices. Due to rising equipment costs driven by tariffs and low oil prices, US shale oil companies have cut capital expenditures, resulting in a decline in the number of active drilling rigs and a slowdown in production growth. This strategic game is likely to keep oil prices in a low range for a long time, with significant long-term downward pressure. Unity within OPEC+ and coordination between Saudi Arabia and the UAE will be key to policy implementation.
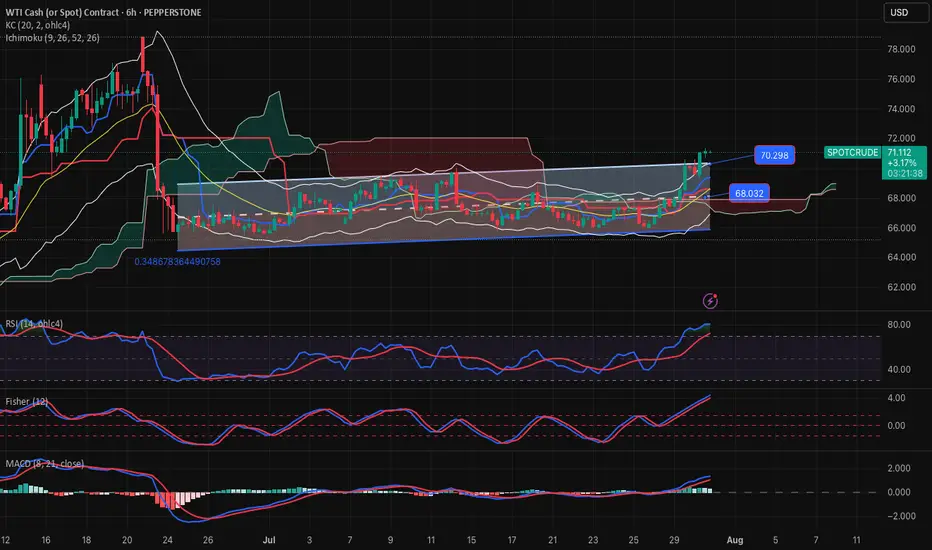
📊Technical aspects
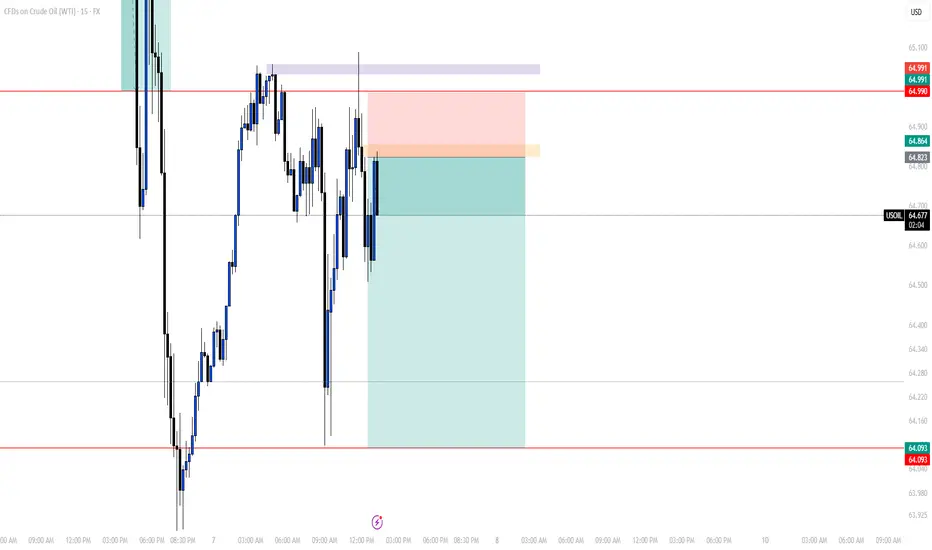
Crude oil's short-term (1H) trend has reversed downward from its highs. The moving averages are diverging and aligning downward, indicating a downward trend in the short term.
The K-line chart has continued to close with small real bodies, and the MACD indicator is about to form a golden cross near the zero axis, signaling weakening downward momentum and a bullish bias on pullbacks. Crude oil is expected to remain weak and downward today, with a potential correction near $65.00.
WTICOUSD trade ideas
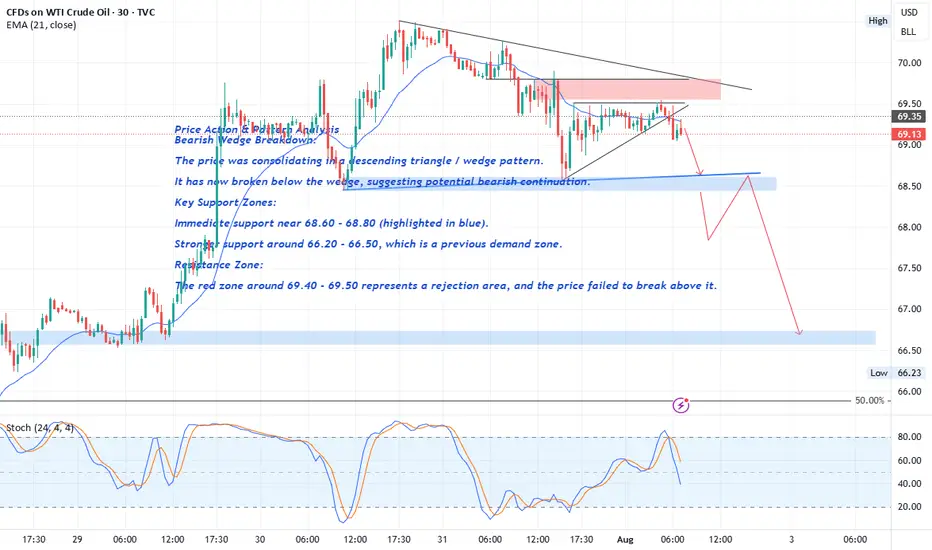
Crude Oil Price Action & Pattern Analysis
Bearish Wedge Breakdown:
The price was consolidating in a descending triangle / wedge pattern.
It has now broken below the wedge, suggesting potential bearish continuation.
Key Support Zones:
Immediate support near 68.60 - 68.80 (highlighted in blue).
FOREXCOM:USOIL
The break of the 68.60 level with a strong bearish candle would serve as confirmation of a Head and Shoulders (H&S) pattern , with solid bearish implications.
Stronger support around 66.20 - 66.50 , which is a previous demand zone.
Resistance Zone:
The red zone around 69.40 - 69.50 represents a rejection area , and the price failed to break above it.
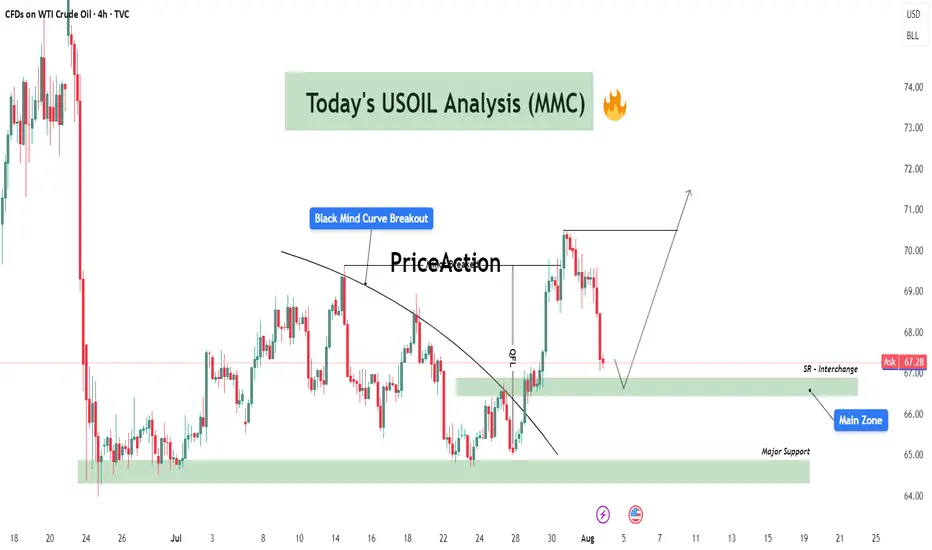
USOIL Technical Analysis – Black Mind Curve Breakout & Reversal🔍 Overall Market Context:
The current USOIL structure is a great example of market shift from compression to expansion, characterized by a breakout of the Black Mind Curve followed by a measured impulse move. This chart is not just reacting technically, but it reflects how institutional smart money manipulates curves, breaks minor structures, and then retests zones to refill orders before continuing directionally.
Let’s break the market psychology and price action phase by phase:
🔄 Phase 1: Black Mind Curve Breakout ✅
The Black Mind Curve represents long-standing supply pressure that had been capping price.
Its breakout marks a shift in market intention, often signaling the end of a distribution phase and beginning of a possible accumulation or re-accumulation.
Price broke above this curve cleanly with strong bullish candles, which also broke minor structure levels, confirming short-term bullish sentiment.
The breakout was also backed by momentum and volume as the market pushed 130+ pips upward—an aggressive impulse that trapped late sellers below.
📉 Phase 2: Retracement to Interchange Zones
Now, we’re in the retracement phase, where price is pulling back toward:
🔹 SR Interchange Zone ($66.80 - $67.30)
This zone was previous resistance, now flipping to support.
In MMC terms, this area is expected to serve as a refill zone where smart money will look to accumulate again after the breakout.
We are watching for confirmation candles or MMC-style reversal patterns here (e.g., inside bar breakouts, demand imbalances).
🔹 Main Zone ($65.80 - $66.50)
If the first zone fails, this is the next key demand base.
It holds historical value from previous accumulation phases (see July 10–25) and aligns with the origin of the last impulse.
Expect a sharper wick or deeper liquidity grab if price moves into this area.
📉 Phase 3: Final Defensive Zone – Major Support ($63.70 - $65.20)
This zone marks the last line of bullish defense.
A move here would mean the bullish structure is being reevaluated or absorbed by sellers.
However, if price hits this level, it could also attract significant institutional demand, setting up for a more powerful long-term leg up.
Reactions here are typically large and volatile, with a risk of fakeouts and fast reversals.
📈 Possible Scenarios (MMC Based Forecasting):
✅ Scenario 1 – Bullish Continuation (Primary Path)
Price finds support inside SR Interchange Zone.
Forms a base (MMC reversal structure) and pushes back to recent highs near $71.
Breakout above $71 opens room for next supply zones between $72.50 - $74.00.
⚠️ Scenario 2 – Deeper Liquidity Grab
Price breaks below SR Interchange and tests Main Zone for a deeper accumulation.
A wick or shakeout may happen before bullish continuation.
This trap zone could give the best R:R entry.
❌ Scenario 3 – Breakdown to Major Support
If both zones fail and bearish pressure sustains, price may revisit Major Support.
That would reset the bullish structure and require fresh MMC assessment.
🧠 MMC Logic at Work:
The curve break symbolizes the shift from supply dominance to a possible demand-led phase.
Minor structure breaks add fuel to trend shift and indicate participation from larger players.
Retracements are not weaknesses—they are refills for those who missed the move.
Smart money uses these zones and flips (SR interchanges) to hide in plain sight.
🎯 Key Takeaway for Traders:
This is a textbook MMC setup that combines:
Curve Breakout + Impulse
Zone Retest + Interchange Logic
Liquidity Engineering before Continuation
Traders should remain patient and observe reactions at each zone. Don’t chase—wait for the market to reveal its hand via MMC entry signals (break-of-structure, bullish engulfings, imbalance fills, etc.)
UPDATE ON THIS MORNING'S TRADEEarly in the morning, I posted a trade (Sell USOIL) in which we trargeted the LQ level which the market came closer to and didn't touch, which isn't a big deal.
As you can see on the chart, as I told my students during the LIVE TRADING SESSION they assisted, it's all about trade management.
On the screenshot on the left, we added another order at 50% lvl of the FVG, xhich the market respected at that moment before giving us a double bottom which is a sign to the change of the movement of the market.
For a safe closure of the trade, as you can see in the picture on the left, we waited for the market to break through the 5min LQ we have to close, and that's what exactly happened.
We'll wait for another trade to take later in the US session.
Follow for more!

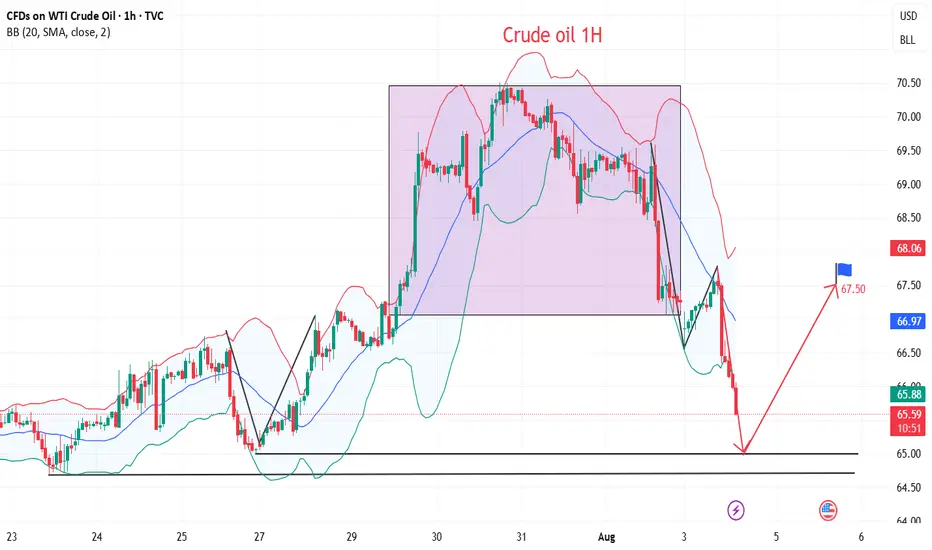
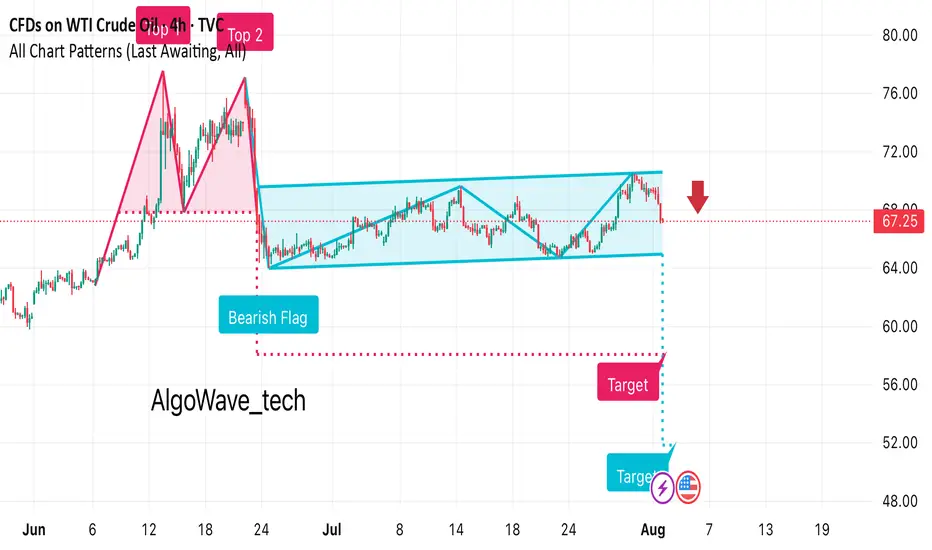
It looks like this chart for WTI Crude Oil is showing a bearish • Previous Move: There’s a strong downward leg before the flag formation, indicating bearish momentum.
• Flag Pattern: Price consolidates in an upward-sloping channel after the drop.
• Breakout: The chart suggests a bearish breakout below the channel, marked with a red arrow at around $67.25.
• Target Projection: The measured move target appears to be around the $53–54 range, based on the flagpole height.
USOIL REACHED THE 6,900.00 SUPPORT LEVEL. WHAT'S NEXT?USOIL REACHED THE 6,900.00 SUPPORT LEVEL. WHAT'S NEXT?
As we told July 31, the price got reversed towards first support level of 6,900.00. Market participants are waiting for the OPEC+ meeting this week, expecting a significant output hike. Currently, the price sits slightly above the support level. Although, the asset trades above this level, considering the current weakness of the asset, further decline is expected. The 6,800.00 support level is the next target here.

USOIL WTIWest Texas Intermediate (WTI) oil is a major benchmark for crude oil pricing, known for its high quality—being both light and sweet due to its low sulfur content and low density. WTI is sourced primarily from inland Texas and is the underlying commodity for oil futures traded on the New York Mercantile Exchange (NYMEX). The main physical delivery point is Cushing, Oklahoma, a critical U.S. oil storage and trading hub.
Current Price (as of August 1, 2025)
WTI crude oil is trading around $69.15–$69.36 per barrel.
Recently, WTI prices have seen volatility due to global economic factors, including U.S. tariffs, OPEC+ production, and shifts in oil demand. Despite a small decline on the day, oil prices have posted their strongest weekly performance since June, rising over 6% for the week.
Market and Outlook
Recent price movement reflects concerns about global trade tensions, new tariffs, and their impact on economic growth and energy demand. At the same time, supply risks remain due to geopolitical factors such as potential sanctions on Russian oil and U.S.-China trade developments.
Analyst forecasts for the remainder of 2025 suggest continued volatility, with WTI potentially ranging between $56 and $73 per barrel, influenced by demand, OPEC+ decisions, and geopolitical events.
Quick Facts Table
Feature Detail
Type Light, sweet crude
Benchmark NYMEX (U.S.), major global reference
Main Delivery Point Cushing, Oklahoma
Latest Price (Aug 1, 2025) $69.15–$69.36 per barrel
Typical Drivers U.S. tariffs, OPEC+ decisions, trade policy, supply risks, global demand
WTI oil plays a central role in global energy markets, serving as a benchmark for North American and international oil pricing. Its price reflects both supply fundamentals and broader macroeconomic and geopolitical developments.
#OIL #WTI

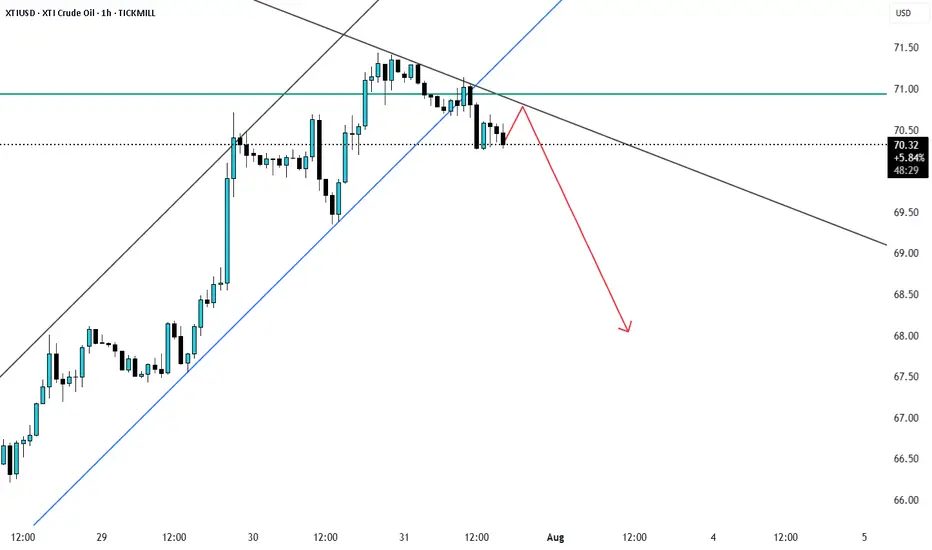
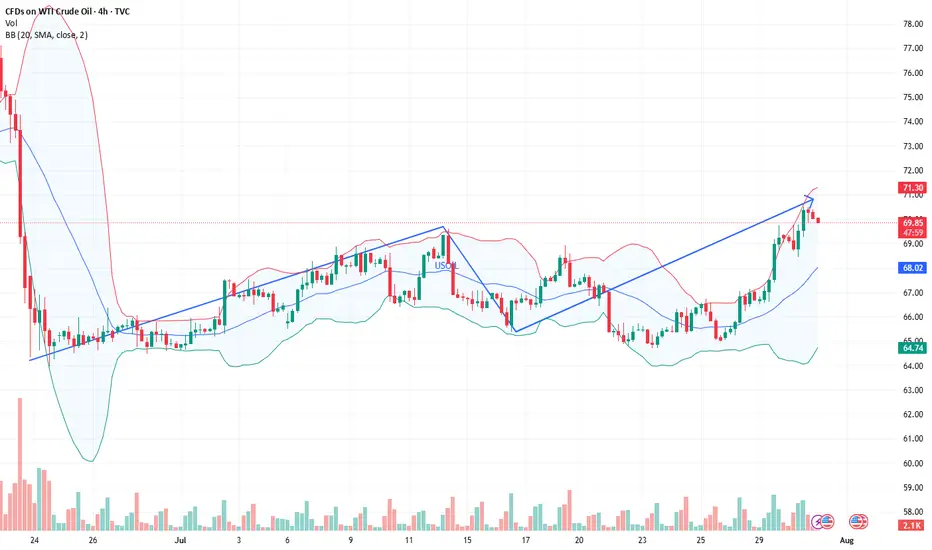
Is the surge in crude oil bulls here a comeback?The news-driven support for crude oil's recent rally is almost exhausted, so we'll continue to adopt a buy-low-sell-high strategy today, using a small stop-loss to maximize profits.
Short at $71.20, with a stop-loss at $71.70 and a take-profit at $69.20. (For aggressive shorting, try shorting at $70.95).
The above strategy is Charlie's personal opinion and is for reference only. If you follow suit, please be cautious and use a stop-loss to protect your position. TVC:USOIL FOREXCOM:USOIL TRADU:USOIL TRADU:USOIL
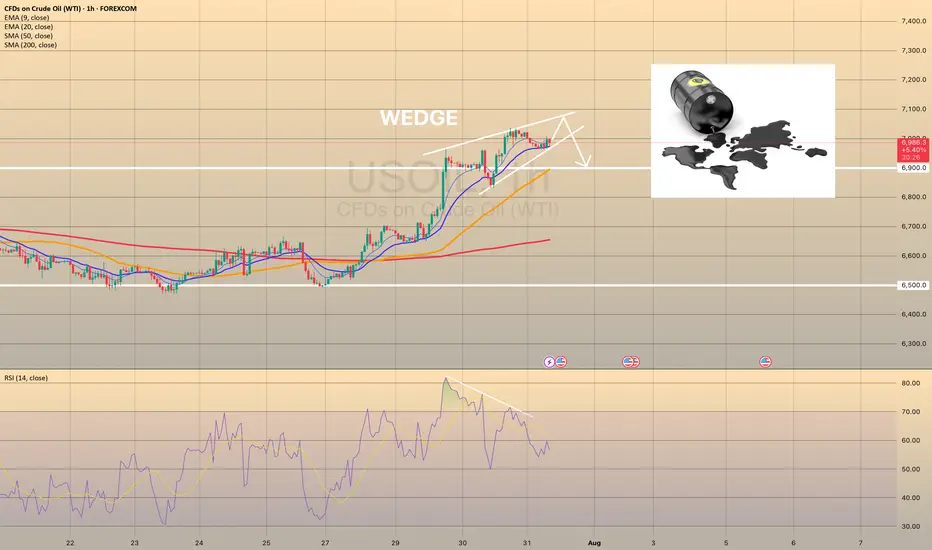
USOIL IS GOING BULLISH. FOR HOW LONG?USOIL IS GOING BULLISH. FOR HOW LONG?
Brent has started this week with a strong bullish momentum and holds near 6-week high on supply fears. President Trump announced plans to impose tariffs on Indian exports and penalize its Russian oil imports. In a parallel move, the US introduced its most extensive sanctions on Iran in seven years. The United States has even offered its oil to the world in exchange for Iranian and Russian oil, but there is evidence that the US production capacity is now at historic highs and is unlikely to grow in the near future.
However, technically oil shows us bearish divergence on RSI and bearish wedge here. The price may reverse towards 6,900.00 as a first target. EIA data showed US crude inventories jumped by 7.7 million barrels last week—the largest increase in six months and defying forecasts for a decline. Market participants are waiting for the OPEC+ meeting this week, expecting a significant output hike.
Crude Oil’s $70 Surge Still Faces 3-Year Channel ResistanceAlthough news points to a crude oil price surge, technical analysis indicates price cap risks remain within the borders of a 3-year descending channel.
Should a clear hold emerge above the $70 barrier, the bullish rebound in price action from the $64.40 zone, in line with the weekly RSI’s rebound off the neutral 50 zone, may extend toward the channel’s upper boundary at $72.40, $74.40, and $77 in more extreme scenarios.
A confirmed hold above the $77–78 zone may shift the primary trend away from bearish dominance and pave the way for longer-term bullish forecasts.
On the downside, if a price drop results in a clean break below the $64 barrier, downside risks may extend toward the mid-zone of the long-standing channel, with potential support levels at $63.20, $61.80, and $59.70, respectively.
Written by Razan Hilal, CMT


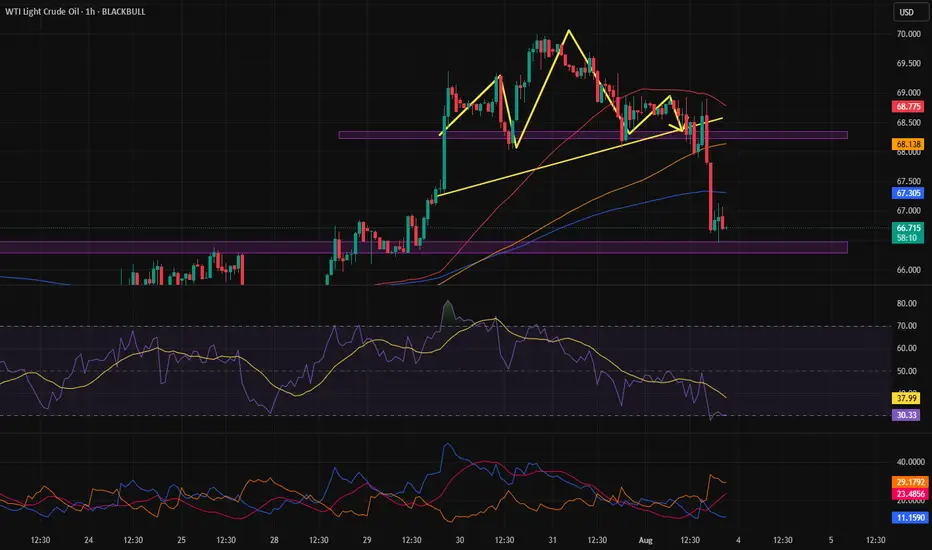
WTI Crude downtrend capped at 6600The WTI Crude Oil is currently trading with a bearish bias, aligned with the broader downward trend. Recent price action shows a retest of the resistance, suggesting a further selling pressure within the downtrend.
Key resistance is located at 6600, a prior consolidation zone. This level will be critical in determining the next directional move.
A bearish rejection from 6600 could confirm the resumption of the downtrend, targeting the next support levels at 6200, followed by 6100 and 6000 over a longer timeframe.
Conversely, a decisive breakout and daily close above 6600 would invalidate the current bearish setup, shifting sentiment to bullish and potentially triggering a move towards 6710, then 6800.
Conclusion:
The short-term outlook remains bearish unless the pair breaks and holds above 6600. Traders should watch for price action signals around this key level to confirm direction. A rejection favours fresh downside continuation, while a breakout signals a potential trend reversal or deeper correction.
This communication is for informational purposes only and should not be viewed as any form of recommendation as to a particular course of action or as investment advice. It is not intended as an offer or solicitation for the purchase or sale of any financial instrument or as an official confirmation of any transaction. Opinions, estimates and assumptions expressed herein are made as of the date of this communication and are subject to change without notice. This communication has been prepared based upon information, including market prices, data and other information, believed to be reliable; however, Trade Nation does not warrant its completeness or accuracy. All market prices and market data contained in or attached to this communication are indicative and subject to change without notice.

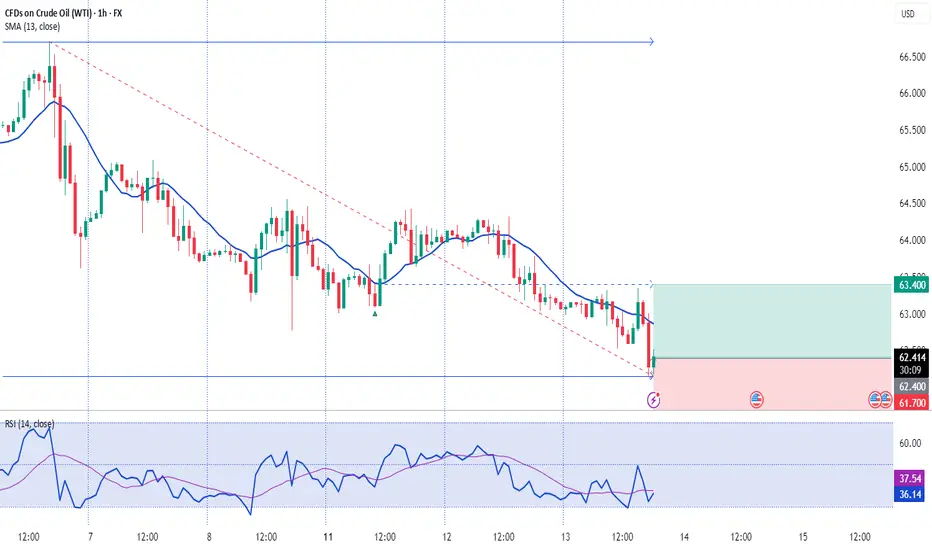
WTI Crude Oil (USOIL) Analysis:The price of crude oil is currently trading near a nearby resistance area at $64.23, with the overall trend remaining bearish.
🔹 Bearish Scenario:
If the price breaks below $63.00 and holds under this level, we may see a target around $62.00.
🔹 Bullish Scenario:
If the price manages to break back above $64.58 and sustain above it, a retest of the $65.00 area is possible, and with continued buying momentum, the price could reach $66.30.
⚠️ Disclaimer:
This analysis is not financial advice. Please monitor the markets and carefully analyze the data before making any investment decisions.

Crude Oil Weekly Outlook: Tariffs, Ceasefire, OPEC & CPI RisksKey Events This Week
• WTI drops to 62.60 ahead of major geopolitical and economic catalysts: Ukraine ceasefire, U.S.–China tariffs, OPEC report, and U.S. CPI
• Global tariff developments continue to shape sentiment and crude demand valuations, especially in relation to OPEC’s evolving supply strategy
WTI’s latest drop is currently holding at the 0.618 Fibonacci retracement of the May–June uptrend, and precisely at the neckline of the inverted head and shoulders pattern around the 62.60 level. The Fibonacci retracement was applied from the $55 low to the $77.80 close, filtering out breakout noise from the Iran–Israel escalation outside the borders of the 3-year down trending channel.
• If 62.60 breaks, downside risks may accelerate toward the mid-zone of the channel, with key levels in sight at 61.40, 59.40, and 55.20, respectively.
• If 62.60 holds, and WTI reclaims ground above 65, we could see a recovery toward the upper edge with next resistance levels at 68.00, 70.00, 71.40, and 72.70.
Written by Razan Hilal, CMT

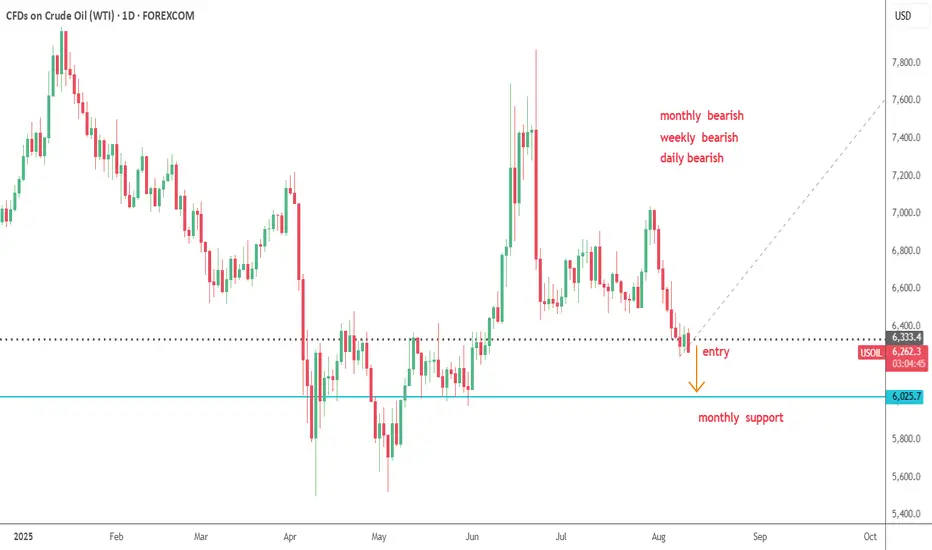
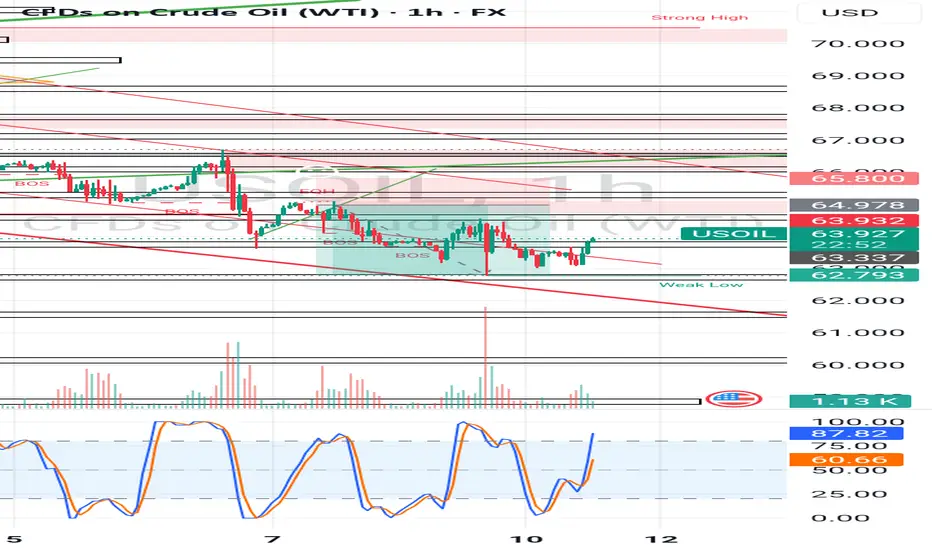
CRUDE OIL Strong Downtrend! Sell!
Hello,Traders!
CRUDE OIL is trading in a
Downtrend and the price
Made a bearish breakout
Of the key horizontal level
Of 63.96$ and the breakout
Is confirmed so we will be
Expecting a further bearish
Move down on Monday!
Sell!
Comment and subscribe to help us grow!
Check out other forecasts below too!
Disclosure: I am part of Trade Nation's Influencer program and receive a monthly fee for using their TradingView charts in my analysis.