Still at the same level and the same analysis wti.The same previous analysis holds for oil and we must wait for fundamental news for now.
WTICOUSD trade ideas


Spot WTI Crude oilas per neo C wave going on, 1st leg completed or wave C completed that time will tell. If wave 2 its irregular correction(possibly), need confirmation, also bearish gartley and other harmonic pattern developed But jackson hole news may impact direction and levels . Let see. Ia m not sebi registered analyst and this is not buy, sell and hold recommendation.


Hellena | Oil (4H): SHORT to support area of 60 (Wave "3").Wave “C” continues to develop in a five-wave movement. Right now, I think wave “1” has just ended and we will see a small correction to the 66,280 area (wave ‘2’), after which I expect wave “3” to develop, which should go further than the 60 support level, but this is a fairly strong psychological level at which it would be good to take profits.
Manage your capital correctly and competently! Only enter trades based on reliable patterns!

USOILUnemployment Claims: 235,000 (previous 226,000 and 224,000), indicating a slight rise in weekly jobless claims, which may suggest some softening in the labor market.
Philly Fed Manufacturing Index: -0.3 (previous readings 6.8 and 15.9), signaling contraction in manufacturing activity in the Philadelphia region, a notable decline from recent positive readings.
Flash Manufacturing PMI: 53.3 (previous 49.7 and 49.8), indicating expansion in the manufacturing sector nationwide with improvement from contraction in prior months.
Flash Services PMI: 55.4 (previous 54.2 and 55.7), showing continued growth in the services sector, with a slight increase compared to the previous month.
These mixed signals suggest some regional manufacturing weakness but overall continued expansion in US manufacturing and services, while the recent rise in unemployment claims is worth monitoring for any emerging labor market softness.
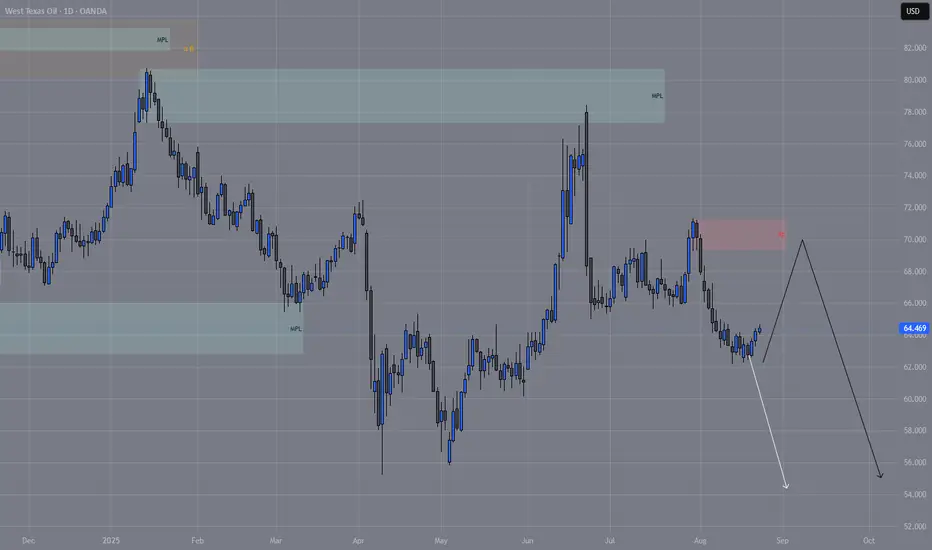
USOIL WILL CONTINUE TO DROP ,AFTER BREAK OF DEMANDFLOOR ON WEEKLY.
#USOIL

THE BEAST! Back in town to say helloSo it has been a while since the last idea on the Beast that is USOIL(WTI)
In that time there has been a lot of ups and downs. More downs than ups I may add.
Simply put, anyone with the patience to wait for the low 60’s and subsequently the high to mid 50’s had a very good time buying as price is only just coming back there.
There is some sentiment towards price going back to the 50’s again but an up move is very likely between now and October.
If price behaves anything like 4 years ago,
This most recent dip could be the last time we see the sixties for the next 6-8 weeks.
I personally have targets as high as 70, 74, 77 and even 82-84.
This is not financial advice and should be taken with a pinch of salt.
Good luck 🤞

WTI Crude Oil — Price Corrects Toward Long-Term UptrendCurrent Setup
WTI crude is trading near 64.00, supported by a sharp drop in U.S. inventories (–6.01M vs. –0.80M expected) and lower gasoline stockpiles (–2.70M). Demand recovery during the summer season underpins the market, while geopolitical risks and ongoing sanctions on Russian oil add further support.
CFTC data shows net long positions declining from 141.8K → 116.7K, reflecting reduced speculative activity. Despite short-term pressure, the long-term trend remains bullish, with potential upside toward 71.00 and 76.30 if buyers regain momentum above 65.50.
Key Levels
• Resistance: 69.85 / 76.30 / 80.50
• Support: 64.50 / 60.25
Trading Scenarios
Primary Scenario
• Recommendation: BUY STOP
• Entry: 65.55
• Take Profit: 71.00
• Stop Loss: 63.50
• Timeframe: 9–12 days
Alternative Scenario
• Recommendation: SELL STOP
• Entry: 61.90
• Take Profit: 60.24
• Stop Loss: 62.78
• Timeframe: 9–12 days

USCrudeOil| Inventory Draw Lifts Prices Fed Geopolitics in Focus🛢️ USCRUDE OIL – Overview
Oil edges higher amid U.S. stock draw
WTI crude oil futures rose to $63.45 per barrel on Thursday, extending gains from the previous session after U.S. crude inventories posted a bigger-than-expected draw.
📊 EIA data showed stockpiles fell by 6 million barrels to 420.7 million, compared to expectations for a 1.3 million-barrel draw, providing short-term support for prices.
At the same time, markets are watching closely for progress in the Russia-Ukraine peace talks, brokered by U.S. President Donald Trump. Any breakthrough that results in easing sanctions on Russian crude exports could shift global supply dynamics.
Despite the latest rebound, crude prices remain down over 10% year-to-date, pressured by expectations of oversupply as OPEC+ restores output and tariff concerns weigh on demand outlook.
🔎 Technical Outlook
Bearish Scenario:
As long as price trades below the pivot line at 63.47, downside targets are seen at 61.83, and a break lower could extend losses toward 60.16.
Bullish Scenario:
A 4H candle close above 63.47 would open the way toward 64.72, with further upside potential toward 65.80 – 67.20.
📍 Key Levels
Pivot: 63.47
Support: 62.25 – 61.85 – 60.20
Resistance: 64.70 – 65.80 – 67.20
⚠️ Crude remains highly sensitive to geopolitical headlines and inventory data — expect volatility around key supply developments.
Previous idea:


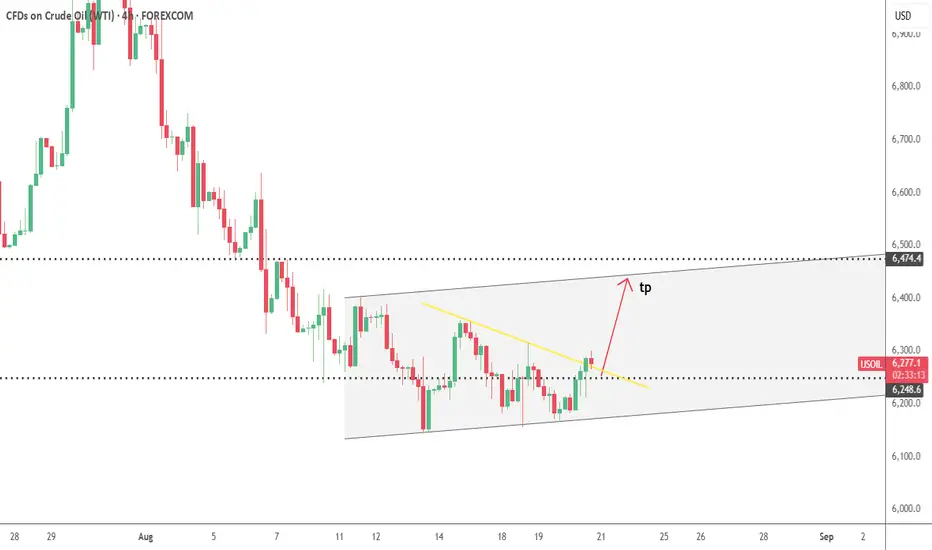
Bearish reversal off pullback resistance?WTI Oil (XTI/USD) is rising towards the pivot, which has been identified as a pullback resistance that lines up with the 38.2% Fibonacci retracement and could reverse to the 1st support.
Pivot: 65.56
1st Support: 62.67
1st Resistance: 67.44
Risk Warning:
Trading Forex and CFDs carries a high level of risk to your capital and you should only trade with money you can afford to lose. Trading Forex and CFDs may not be suitable for all investors, so please ensure that you fully understand the risks involved and seek independent advice if necessary.
Disclaimer:
The above opinions given constitute general market commentary, and do not constitute the opinion or advice of IC Markets or any form of personal or investment advice.
Any opinions, news, research, analyses, prices, other information, or links to third-party sites contained on this website are provided on an "as-is" basis, are intended only to be informative, is not an advice nor a recommendation, nor research, or a record of our trading prices, or an offer of, or solicitation for a transaction in any financial instrument and thus should not be treated as such. The information provided does not involve any specific investment objectives, financial situation and needs of any specific person who may receive it. Please be aware, that past performance is not a reliable indicator of future performance and/or results. Past Performance or Forward-looking scenarios based upon the reasonable beliefs of the third-party provider are not a guarantee of future performance. Actual results may differ materially from those anticipated in forward-looking or past performance statements. IC Markets makes no representation or warranty and assumes no liability as to the accuracy or completeness of the information provided, nor any loss arising from any investment based on a recommendation, forecast or any information supplied by any third-party.

Crude oil's downward trend remains unchangedCrude oil rebounded briefly and is currently trading around 63.
Data from the U.S. Energy Information Administration (EIA) showed that U.S. crude oil inventories fell by 6 million barrels to 420.7 million barrels last week, compared to market expectations of only 1.8 million barrels. Meanwhile, gasoline inventories fell by 2.7 million barrels, far exceeding expectations of a 915,000-barrel drop, indicating strong summer travel demand.
The latest inventory data suggests a recovery in U.S. demand, particularly the rebound in aviation fuel demand, is providing new growth momentum for global energy consumption. The latest U.S. inventory data, which far exceeded market expectations, has instilled confidence in the market.
Despite the increase in demand, some caution remains in the market.
This caution is primarily due to geopolitical uncertainty. Due to slow progress in negotiations, sanctions against Russia continue, and the possibility of further restrictions in the future are also weighing on the market.
Furthermore, the United States announced that it will impose a 25% tariff on some Indian goods, effective August 27, in response to continued imports of Russian crude oil. Meanwhile, Europe has also imposed restrictions on some Indian refineries. Therefore, there is considerable uncertainty surrounding the current crude oil price.
Technically, the daily crude oil chart shows that prices have found support above $60 and have repeatedly stabilized near the 100-day moving average, forming a moderate upward trend in the short term. Currently, prices are trading above the 20-day and 50-day moving averages, indicating increased bullish momentum.
However, there is strong resistance above $65. The 4-hour candlestick chart shows that the price is still in a downtrend. Further upside is possible only if resistance near $65 is broken.
A decline below $62 could lead to a retest of the $60 support level.
Crude oil short-term strategy: Enter a short position near $63.5 and wait for a decline, targeting $62 and $61.8.

USOIL - 1HMarket hovering around ~63 which validates my earlier post.
Now considering if bulls can keep the momentum going, next target is ~64-64.2 right into resistance.
Earlier price rejected at 62.6-7 area few times only to fill the FVG below and break above 62.7 shows bulls weren't playing around.
Now I am skeptical since we have our friend Jerry speaking tomorrow to ruin our lives, I am betting bulls will keep the momentum going till Jerry speaks.
If he's dovish we make a break above 64, if he's hawkish we will see bearish momentum continuing till 60 IMO.
NFA

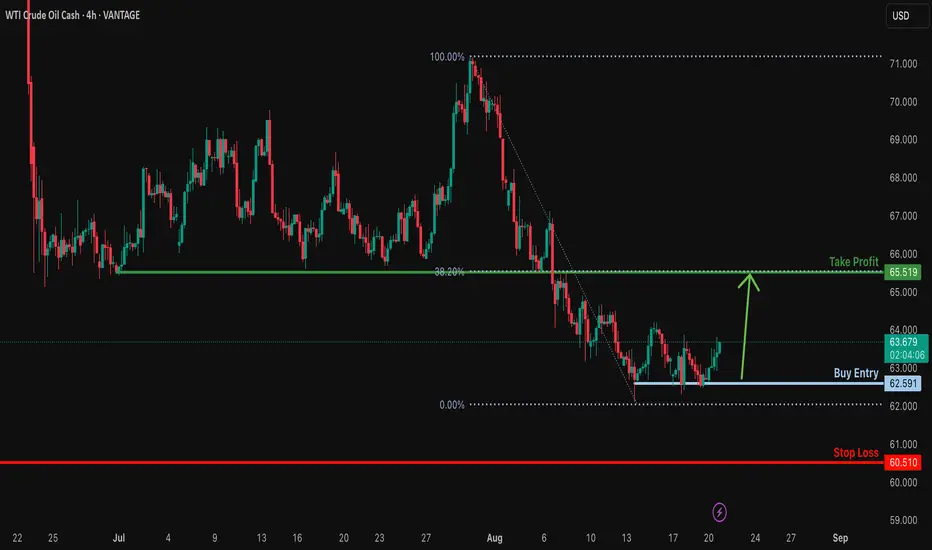
Bullish reversal off pullback support?USO/USD has bounced off the support level, which is a pullback support, and could potentially rise from this level to our take profit.
Entry: 62.59
Why we like it:
There is a pullback support level.
Stop loss: 60.51
Why we lik eit:
There is a multi swing low support.
Take profit: 65.51
Why we like it:
There is a pullback resistance level that lines up witht he 38.2% Fibonacci retracement.
Enjoying your TradingView experience? Review us!
Please be advised that the information presented on TradingView is provided to Vantage (‘Vantage Global Limited’, ‘we’) by a third-party provider (‘Everest Fortune Group’). Please be reminded that you are solely responsible for the trading decisions on your account. There is a very high degree of risk involved in trading. Any information and/or content is intended entirely for research, educational and informational purposes only and does not constitute investment or consultation advice or investment strategy. The information is not tailored to the investment needs of any specific person and therefore does not involve a consideration of any of the investment objectives, financial situation or needs of any viewer that may receive it. Kindly also note that past performance is not a reliable indicator of future results. Actual results may differ materially from those anticipated in forward-looking or past performance statements. We assume no liability as to the accuracy or completeness of any of the information and/or content provided herein and the Company cannot be held responsible for any omission, mistake nor for any loss or damage including without limitation to any loss of profit which may arise from reliance on any information supplied by Everest Fortune Group.
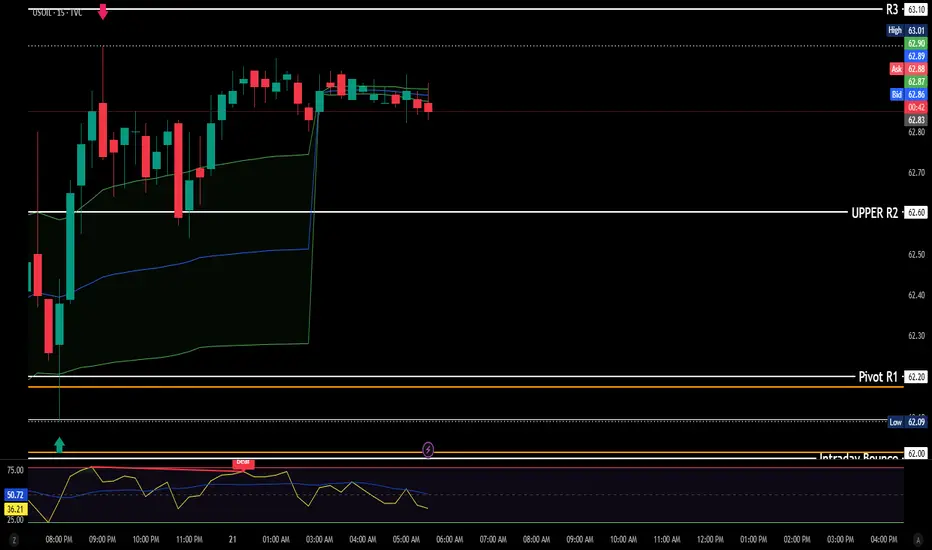
USOIL - lookoutMultiple rejections at R2 on 1H as marked, however price bounced back from the R1 pivot.
It seems traders are trying to hold price in anticipation of the EIA data tomorrow.
Personally I feel R3 will be hit, but I would trade cautiously, if you're like me and missed the move. Wait for confirmations, don't just jump in.
NFA

Buy WTI crude - Very good entry point and High margin of safety The current buy zone for US crude oil (WTI) is approximately between $61.50 and $63.00 per barrel. Key support levels are identified around $62.03 and $61.30, with a stop loss recommended below $59.20. Technical indicators such as moving averages and the Parabolic SAR suggest a bullish trend as the price is trading above the 50-day SMA and 200-day EMA. Analysts expect moderate volatility but overall a favorable setup for buying in this price range, targeting higher levels around $70 and above

WTI OIL Buy signal if the 4H MA50 breaks.WTI Oil (USOIL) appears to have found short-term Support since the August 13 Low, turning sideways, with its 4H RSI however on Higher Lows, thus displaying a Bullish Divergence.
This is similar to the June 24 - July 02 Bullish Divergence, which once it broke above the 4H MA50 (blue trend-line), it topped a little over the 0.382 Fibonacci retracement level.
As a result, we will be waiting for the 4H MA50 bullish break-out signal to target $65.60 (Fib 0.382).
-------------------------------------------------------------------------------
** Please LIKE 👍, FOLLOW ✅, SHARE 🙌 and COMMENT ✍ if you enjoy this idea! Also share your ideas and charts in the comments section below! This is best way to keep it relevant, support us, keep the content here free and allow the idea to reach as many people as possible. **
-------------------------------------------------------------------------------
Disclosure: I am part of Trade Nation's Influencer program and receive a monthly fee for using their TradingView charts in my analysis.
💸💸💸💸💸💸
👇 👇 👇 👇 👇 👇

WTI Crude sideways consolidation capped at 6600The WTI Crude Oil is currently trading with a bearish bias, aligned with the broader downward trend. Recent price action shows a retest of the resistance, suggesting a further selling pressure within the downtrend.
Key resistance is located at 6600, a prior consolidation zone. This level will be critical in determining the next directional move.
A bearish rejection from 6600 could confirm the resumption of the downtrend, targeting the next support levels at 6200, followed by 6100 and 6000 over a longer timeframe.
Conversely, a decisive breakout and daily close above 6600 would invalidate the current bearish setup, shifting sentiment to bullish and potentially triggering a move towards 6710, then 6800.
Conclusion:
The short-term outlook remains bearish unless the pair breaks and holds above 6600. Traders should watch for price action signals around this key level to confirm direction. A rejection favours fresh downside continuation, while a breakout signals a potential trend reversal or deeper correction.
This communication is for informational purposes only and should not be viewed as any form of recommendation as to a particular course of action or as investment advice. It is not intended as an offer or solicitation for the purchase or sale of any financial instrument or as an official confirmation of any transaction. Opinions, estimates and assumptions expressed herein are made as of the date of this communication and are subject to change without notice. This communication has been prepared based upon information, including market prices, data and other information, believed to be reliable; however, Trade Nation does not warrant its completeness or accuracy. All market prices and market data contained in or attached to this communication are indicative and subject to change without notice.


