My view on oil is not positive for the next 3 years.In my observation, the last 2 months of the 2nd quarter of the year according to the cycle is the breakout level to determine the trend. Oh, and one more thing, it needs a monthly candle to sink down in the next 2 months to be more consolidated and can be considered a sufficient condition to legitimize this investment idea.
WTICOUSD trade ideas

WTI OIL US OIL Bureau of Labor Statistics today published CORE PPI DATA REPORT,
the core ppi Measures the Change in the price of finished goods and services sold by producers, excluding food and energy;'Actual' greater than 'Forecast' is good for currency;
Frequency Released monthly, about 13 days after the month ends and the Next Release will be Sep 10, 2025
the Producer Price Index (PPI) data for July 2025 came in much stronger than expected:
The headline PPI increased by 0.9% month-over-month, compared to the forecast of just 0.2% and a flat 0.0% reading in June. This is the largest monthly gain since June 2022.
Core PPI, which excludes food and energy prices, also surged by 0.9% month-over-month, well above the forecast of 0.2% and no change the prior month.
On a year-over-year basis, the headline PPI rose 3.3%, up from 2.4% in June, while core PPI climbed to 3.7%, the highest core producer inflation level since March 2025.
The price increases were broad-based, with significant rises in goods prices (especially food, steel, aluminum) and service prices (such as machinery wholesaling, hotels, freight).
This sharp rise in producer inflation is partly attributed to the delayed effects of import tariffs, which producers have largely absorbed so far but are starting to pass through into prices.
The strong PPI figures have raised concerns about increasing inflationary pressures, making near-term Federal Reserve interest rate cuts less likely. Markets have adjusted expectations, with the probability of a September rate cut slightly declining.
Labor market data showed initial unemployment claims slightly better than expected at 224,000, indicating continuing labor market strength alongside rising inflation.
In summary, this unexpected surge in wholesale inflation signals growing inflation pressures that could complicate the Federal Reserve's policy decisions moving forward. It suggests inflation at the producer level is escalating after a period of moderation, challenging hopes for near-term rate relief.
At 3:10pm, St. Louis Federal Reserve President and FOMC member Alberto Musalem spoke about U.S. economic conditions and monetary policy. Key points from his statements include:
Tariffs are feeding through into inflation, which is running close to 3%.
Most of the tariff impact on inflation is expected to fade within 6 to 9 months, but there is a chance the impact could be more persistent.
The U.S. economy is around full employment, though there are some early signs of weakening in the labor market.
Musalem favors a meeting-by-meeting approach for monetary policy decisions, emphasizing the need for an open mind as new data arrive.
He revised his view slightly with labor market risks seen as somewhat higher and inflation risks somewhat lower.
Economic growth is slightly below 1%, creating downside risks for the job market.
So far, businesses are not indicating imminent layoffs.
Musalem stressed the Fed's role to listen to businesses and main street rather than political views on monetary policy.
He suggested a patient approach is best, with further rate adjustments dependent on inflation and labor market developments, keeping an eye on whether inflation becomes more persistent or the labor market weakens.
U.S. natural gas storage reported 56 billion cubic feet available, higher than the previous 53 billion, indicating ample supply.
U.S. mortgage delinquencies improved slightly to 3.93% from 4.04%, showing some easing in mortgage stress.
#OIL

Crude oil needs to open a short positionWe remain bearish on crude oil today. With the start of new contract delivery, crude oil is still weak. We would consider continuing to short it on a rebound. There are no bullish signals for crude oil, with no fundamental or technical support. If it breaks below 60.00, it will plummet again. Consider shorting it on a rebound near 63.00 today.

WTI Holds 62 Support Ahead of Washington TalksFriday’s meeting in Alaska set the stage for a potential shift in U.S.–Russia relations. Putin’s terms, discussed privately, are expected to be presented today in Washington during talks between Trump, Zelensky, and EU allies toward a possible ceasefire.
WTI’s latest drop is currently holding at the 0.618 Fibonacci retracement of the May–June uptrend, and precisely at the neckline of the inverted head and shoulders pattern around the $62 level. The Fibonacci retracement was applied from the $55 low to the $77.80 close, filtering out breakout noise beyond the upper border of the 3-year down trending channel.
• If 62 breaks, downside risks may accelerate toward the mid-zone of the channel, with key levels in sight at 61.40, 59.40, and 55.20, respectively.
• If 62.60 holds, and WTI reclaims ground above 65, we could see a recovery toward the upper edge with next resistance levels at 68.00, 70.00, 71.40, and 72.70.
Written by Razan Hilal, CMT

Crude Oil under pressure, bulls watch $60Oil prices edged higher as markets focused on Trump’s meeting with Zelenskiy, where the U.S. president is pressuring Ukraine to strike a peace deal with Russia that could involve ceding territory. European leaders are joining the talks, but U.S. officials stressed a settlement is still far off despite some progress. Trump has hinted at security guarantees and threatened new measures against Russia and its oil buyers if no ceasefire is reached, though he is delaying further tariffs on China. India has already been hit with penalties for purchasing Russian crude. Overall, the uncertainty around peace negotiations, trade tensions, and OPEC+ supply increases has kept oil trading range-bound, with futures still down over 10% this year.
On the technical side, the price of crude oil is currently testing the low of early June. The Stochastic oscillator has been in extreme oversold levels for almost two consecutive weeks and could possibly hint at a bullish correction in the upcoming sessions. Despite the medium-term bearish image on the daily chart, the moving averages are still validating an overall bullish trend in the market. If the current bearish momentum projects further, then the first area of major technical support could be found around the $60, which is made up of the psychological support of the round number, the 78.6% of the weekly Fibonacci retracement level, and the lower band of the Bollinger Bands.
Disclaimer: The opinions in this article are personal to the writer and do not reflect those of Exness


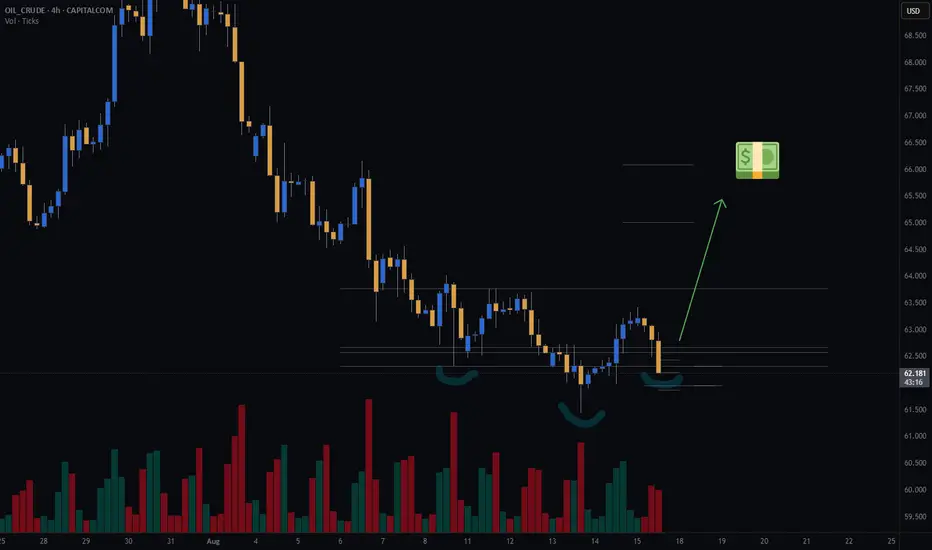
Oil - Potential long with inverse and shouldersWatching Oil for a potential long entry. There appears to be an inverse head and shoulders forming on the 4-hour chart.
If the 4-hour candle closes within the expected range and 3 of my other variables are met, I’ll consider entering a long position.
Trade Details:
📊 Risk/Reward: 3.8
🎯 Entry: 62.658
🛑 Stop Loss: 61.941
💰 Take Profit 1 (50%): 65
💰 Take Profit 2 (50%): 66.08
#GTradingMethod Tip: Predefine and accept your risk before entering a trade.
Thanks for checking out my post! Make sure to follow me to catch the next update. If you found this helpful, give it a like 👍 and share your thoughts 💬 — I’d love to hear what you think!
Please note: This is not financial advice. This content is to track my trading journey and for educational purposes only.


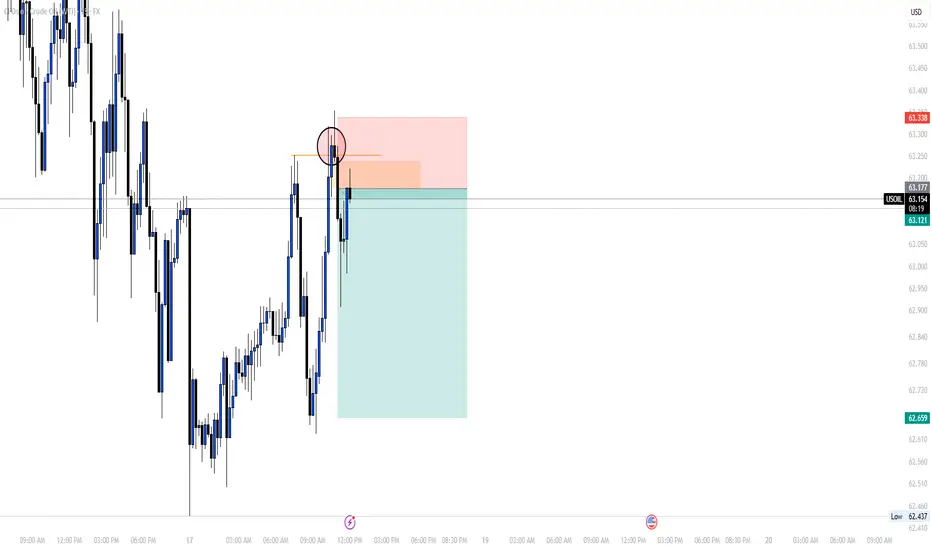
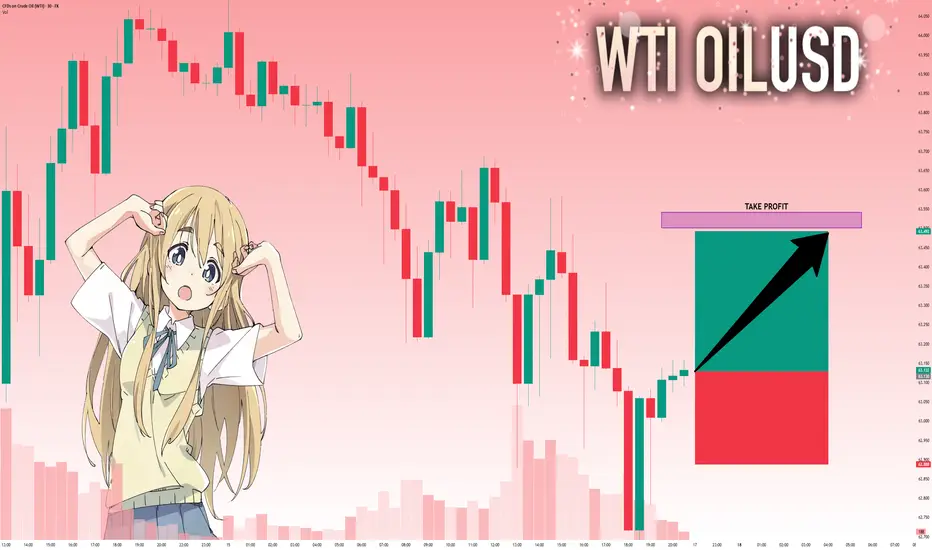
USOIL: Long Signal Explained
USOIL
- Classic bullish formation
- Our team expects growth
SUGGESTED TRADE:
Swing Trade
Buy USOIL
Entry Level - 63.13
Sl - 62.89
Tp - 63.56
Our Risk - 1%
Start protection of your profits from lower levels
Disclosure: I am part of Trade Nation's Influencer program and receive a monthly fee for using their TradingView charts in my analysis.
❤️ Please, support our work with like & comment! ❤️
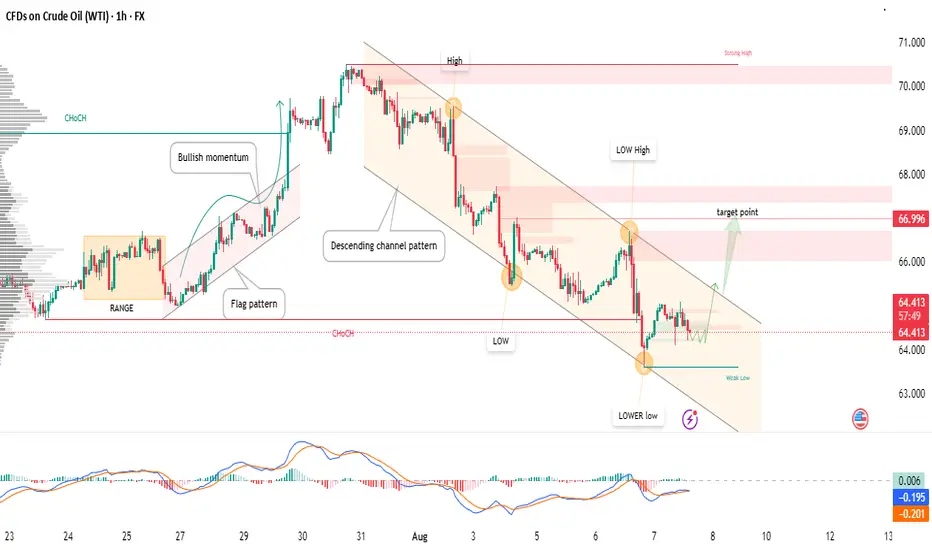
USOIL - Potential Bullish Reversal Inside Descending Channel!📉 After a significant bearish move from the recent high, USOIL is trading within a well-defined descending channel pattern.
🔍 Key observations:
Price has printed a lower low into a weak low area, showing signs of seller exhaustion.
A potential reversal pattern is forming at channel support.
MACD shows bullish momentum divergence, hinting at a short-term reversal.
Targeting the supply zone near 66.99, aligning with the previous low high and key structure zone.
🟢 Trade Idea:
Looking for bullish confirmation to trigger a long setup.
Target: 66.99 (near upper channel boundary and previous structure)
Manage risk carefully with a stop below the recent low.
⚠️ Disclaimer: This is a technical analysis-based idea, not financial advice. Always do your own research and manage risk accordingly.
USOIL: Move Up Expected! Long!
My dear friends,
Today we will analyse USOIL together☺️
The market is at an inflection zone and price has now reached an area around 63.130 where previous reversals or breakouts have occurred.And a price reaction that we are seeing on multiple timeframes here could signal the next move up so we can enter on confirmation, and target the next key level of 63.501.Stop-loss is recommended beyond the inflection zone.
❤️Sending you lots of Love and Hugs❤️

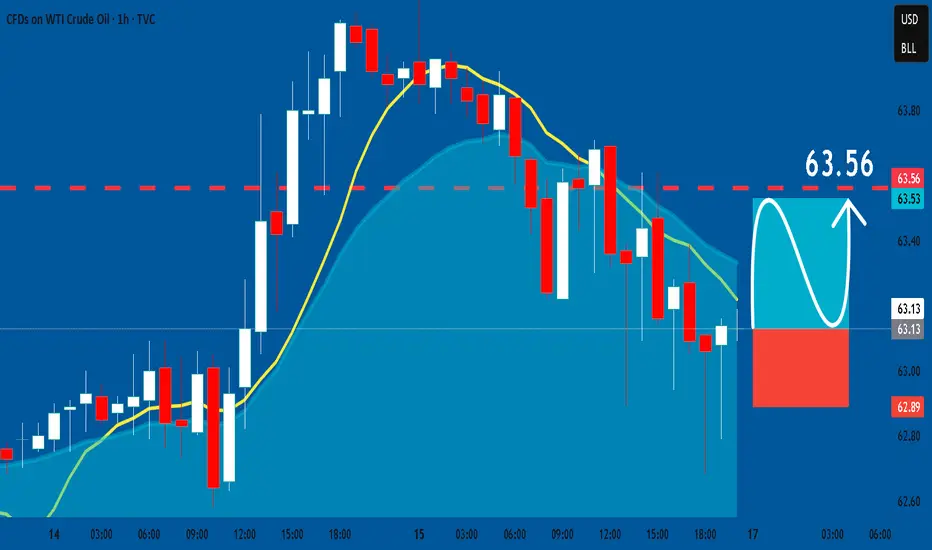
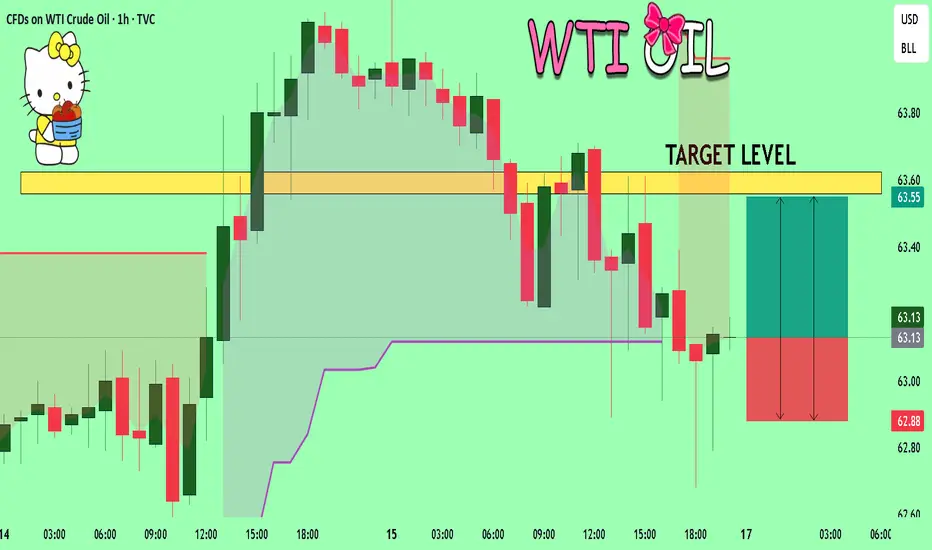
USOIL Will Explode! BUY!
My dear friends,
USOIL looks like it will make a good move, and here are the details:
The market is trading on 63.13 pivot level.
Bias - Bullish
Technical Indicators: Supper Trend generates a clear long signal while Pivot Point HL is currently determining the overall Bullish trend of the market.
Goal - 63.56
Recommended Stop Loss - 62.88
About Used Indicators:
Pivot points are a great way to identify areas of support and resistance, but they work best when combined with other kinds of technical analysis
Disclosure: I am part of Trade Nation's Influencer program and receive a monthly fee for using their TradingView charts in my analysis.
———————————
WISH YOU ALL LUCK
US OIL SELL...Hello friends🙌
🔊As you can see, this chart works well in forming a channel, and now that
we have witnessed a price drop, the price has reached the bottom of the channel, and given the previous heavy drop, the channel shows that the power is currently in the hands of sellers and it is likely that the specified targets will move.
🔥Follow us for more signals🔥
Trade safely with us
USOIL BULLISH BIAS RIGHT NOW| LONG
USOIL SIGNAL
Trade Direction: long
Entry Level: 63.09
Target Level: 68.58
Stop Loss: 59.42
RISK PROFILE
Risk level: medium
Suggested risk: 1%
Timeframe: 1D
Disclosure: I am part of Trade Nation's Influencer program and receive a monthly fee for using their TradingView charts in my analysis.
✅LIKE AND COMMENT MY IDEAS✅

Gold and crude oil are about to fall below supportToday is Friday, and this week's market is drawing to a close. Gold plunged sharply on Monday, and then fluctuated and corrected from Tuesday to Thursday. Short-term bears are essentially dominating the market. Gold has repeatedly hit new highs before falling, suggesting bulls are digging a hole to bury their enemies. Our current strategy remains bearish, and we should continue to prioritize short positions. The reason is simple: the daily candlestick closed in a bearish pattern. A tombstone candlestick pattern is a bearish signal. Furthermore, all moving averages have been broken, clearly indicating bearish momentum. The only caveat is that 3330 hasn't been broken yet. A break of this level, the bottom of this week, would open up new downside potential.
Support lies at 3330 and 3320, resistance at 3349 and 3360, strong resistance at 3375, and the dividing line between strength and weakness at 3349.
Crude Oil Market Analysis
It's correct to maintain a bearish outlook on crude oil recently. Both the daily and 4H charts are bearish. Yesterday's rebound was a normal technical rebound, providing another opportunity for short positions. Today, we should continue to focus on the 64.50 level. The daily moving average has begun to decline and has already broken through. Barring any unexpected events, we'll soon see the 60.00 level.
Fundamental Analysis
Keep an eye on the US national debt. The current debt has reached a historical high and is expected to have a market impact in the coming weeks.
Gold: Buy short positions around 3348, target 3330-3320
Crude Oil: Buy short positions around 64.00, target 62.00-60.00


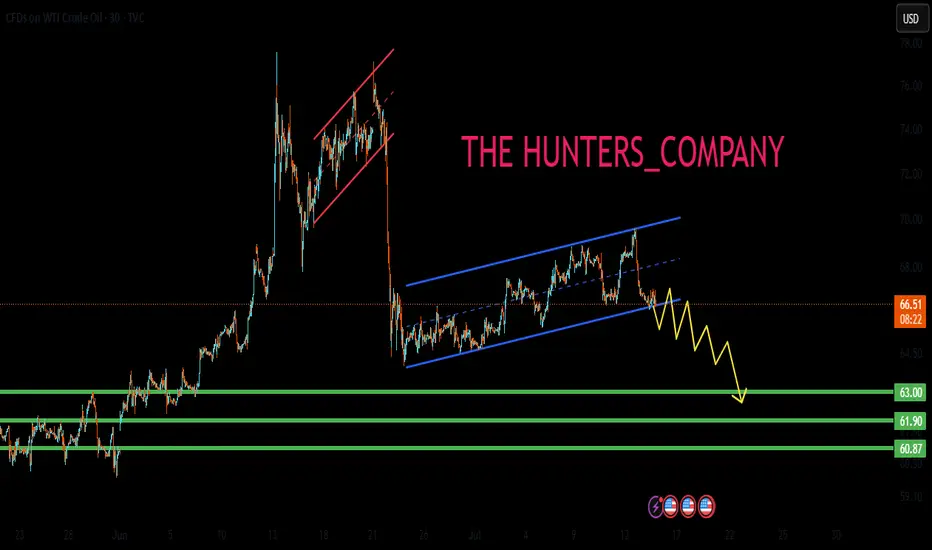
Crude Oil Technical Outlook – Bearish Momentum Intensifies
---
📉
When zooming out on the chart, it’s clear that crude oil remains in a long-term downtrend. However, zooming in reveals a more nuanced picture: after a steep decline, oil entered a corrective phase, forming a minor ascending channel. This channel has now been broken to the downside—confirming the continuation of bearish momentum.
🔍 Based on this breakdown, we anticipate further declines toward the following key support levels:
• $60.428
• $58.140
• $56.000
🚫 Stop-loss: Above $65.000, to protect against false breakouts or unexpected reversals.
This analysis aligns with our previous successful forecast from last week, which you can find in the comments section. The technical structure remains consistent, and the bearish signals are growing stronger.
Stay sharp—this setup could offer significant downside potential for those watching closely.
---

USOIL H4 | Bearish reversal off pullback resistanceBased on the H4 chart analysis, we could see the price rise to the sell entry, which is pullback resistance that is slightly above the 23.6% Fibonacci retracement and could drop from this level to the take profit.
Sell entry is at 63.82, which is a pullback resistance that is slightly above the 23.6% Fibonacci retracement.
Stop loss is at 66.33, which is a pullback resistance that is slightly below the 61.8% Fibonacci retracement.
Take profit is at 60.05, which is a multi swing low support.
High Risk Investment Warning
Trading Forex/CFDs on margin carries a high level of risk and may not be suitable for all investors. Leverage can work against you.
Stratos Markets Limited (tradu.com ):
CFDs are complex instruments and come with a high risk of losing money rapidly due to leverage. 65% of retail investor accounts lose money when trading CFDs with this provider. You should consider whether you understand how CFDs work and whether you can afford to take the high risk of losing your money.
Stratos Europe Ltd (tradu.com ):
CFDs are complex instruments and come with a high risk of losing money rapidly due to leverage. 66% of retail investor accounts lose money when trading CFDs with this provider. You should consider whether you understand how CFDs work and whether you can afford to take the high risk of losing your money.
Stratos Global LLC (tradu.com ):
Losses can exceed deposits.
Please be advised that the information presented on TradingView is provided to Tradu (‘Company’, ‘we’) by a third-party provider (‘TFA Global Pte Ltd’). Please be reminded that you are solely responsible for the trading decisions on your account. There is a very high degree of risk involved in trading. Any information and/or content is intended entirely for research, educational and informational purposes only and does not constitute investment or consultation advice or investment strategy. The information is not tailored to the investment needs of any specific person and therefore does not involve a consideration of any of the investment objectives, financial situation or needs of any viewer that may receive it. Kindly also note that past performance is not a reliable indicator of future results. Actual results may differ materially from those anticipated in forward-looking or past performance statements. We assume no liability as to the accuracy or completeness of any of the information and/or content provided herein and the Company cannot be held responsible for any omission, mistake nor for any loss or damage including without limitation to any loss of profit which may arise from reliance on any information supplied by TFA Global Pte Ltd.
The speaker(s) is neither an employee, agent nor representative of Tradu and is therefore acting independently. The opinions given are their own, constitute general market commentary, and do not constitute the opinion or advice of Tradu or any form of personal or investment advice. Tradu neither endorses nor guarantees offerings of third-party speakers, nor is Tradu responsible for the content, veracity or opinions of third-party speakers, presenters or participants.


CRUDE OIL Short From Resistance! Sell!
Hello,Traders!
CRUDE OIL is making a
Pullback and will soon hit
A horizontal resistance
Of 64.50$ and as we are
Bearish biased and we will
Be expecting a local
Bearish pullback
Sell!
Comment and subscribe to help us grow!
Check out other forecasts below too!
Disclosure: I am part of Trade Nation's Influencer program and receive a monthly fee for using their TradingView charts in my analysis.
