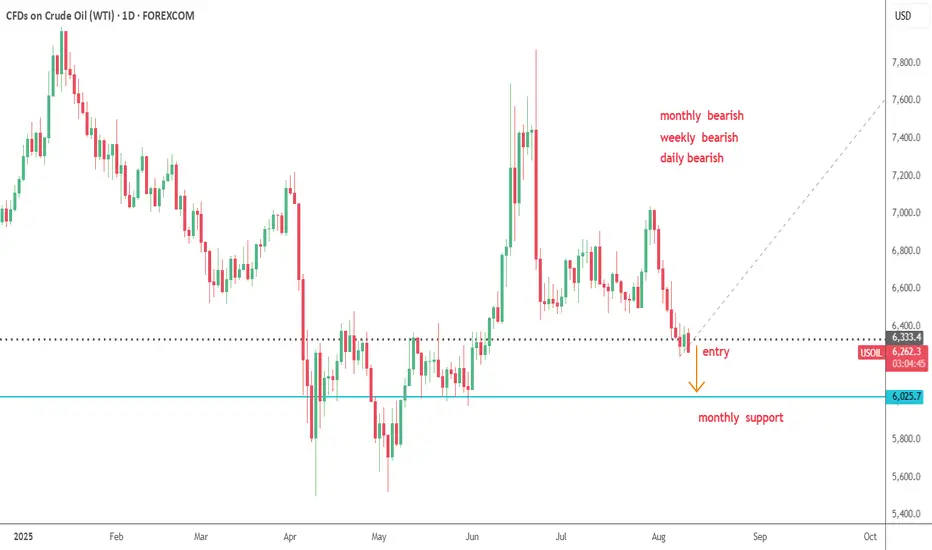
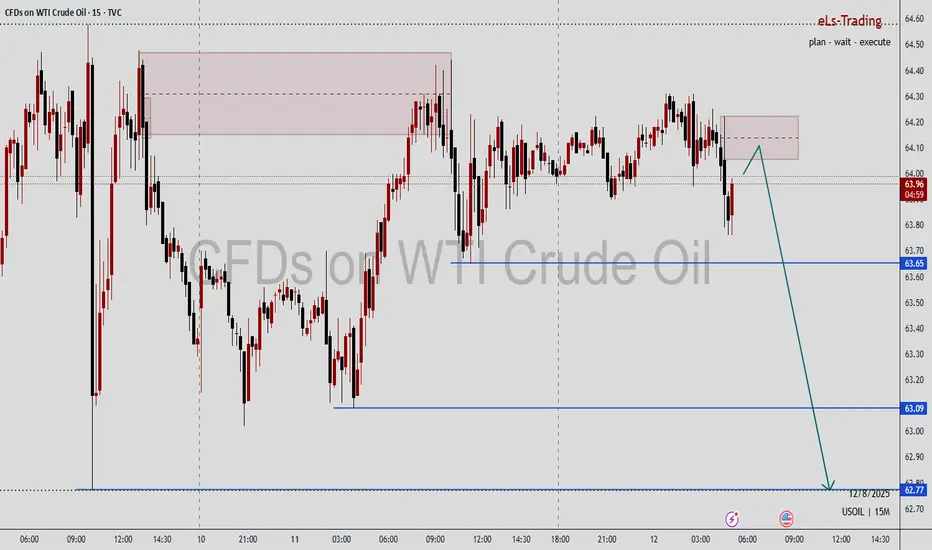
USOIL--SHORT--monthly,weekly, daily bearish
--expecting to fall towards blue monthly support
--entry and tp are as shown on chart
WTICOUSD trade ideas
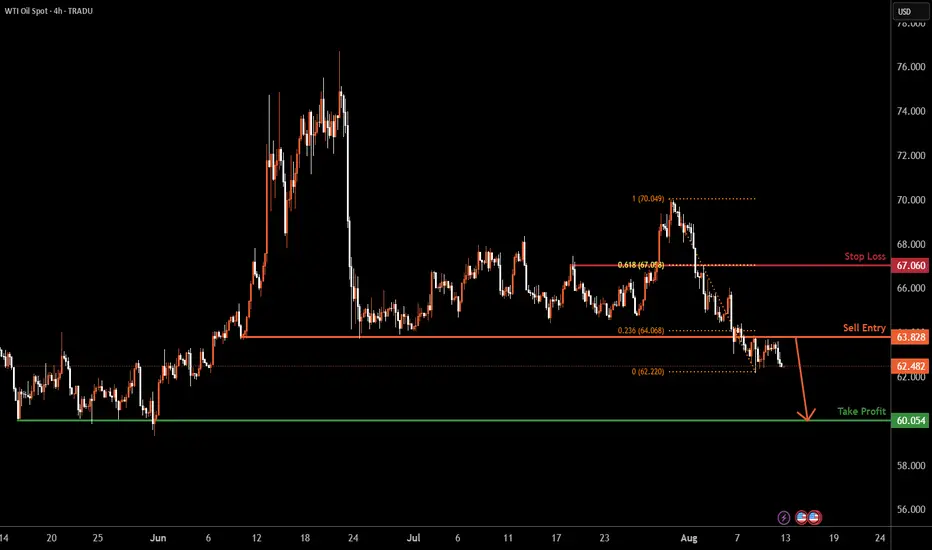
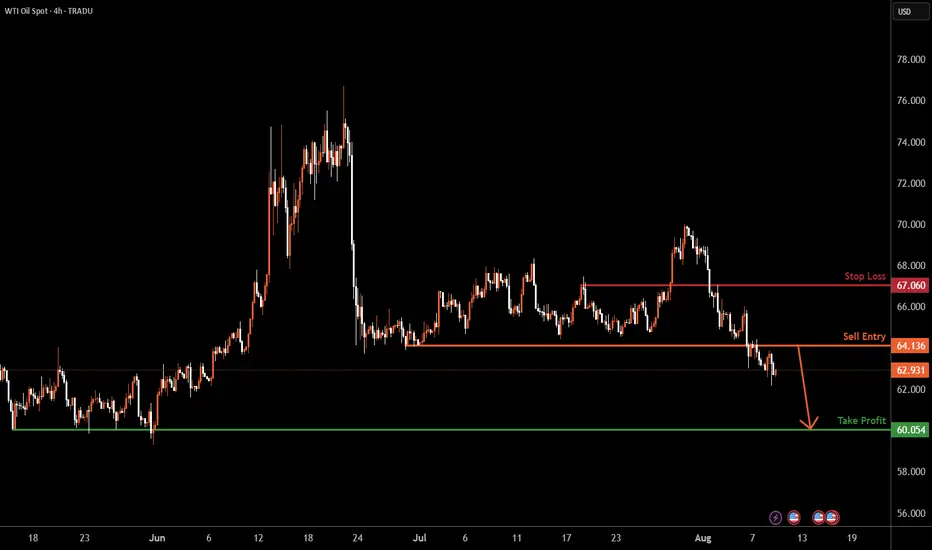
USOIL H4 | Potential bearish dropBased on the H4 chart analysis, we can see the price has rejected off the sell entry which acts as a pullback resistance that lines up with the 23.6% Fibonacci retracement and could drop to the downside.
Sell entry is at 64.13, which is a pullback resistance that lines up with the 23.6% Fibonacci retracement.
Stop loss is at 67.06, which is a pullback resistance that aligns with the 61.8% Fibonacci retracement.
Take profit is at 60.05, which is a multi-swing low support.
High Risk Investment Warning
Trading Forex/CFDs on margin carries a high level of risk and may not be suitable for all investors. Leverage can work against you.
Stratos Markets Limited (tradu.com ):
CFDs are complex instruments and come with a high risk of losing money rapidly due to leverage. 65% of retail investor accounts lose money when trading CFDs with this provider. You should consider whether you understand how CFDs work and whether you can afford to take the high risk of losing your money.
Stratos Europe Ltd (tradu.com ):
CFDs are complex instruments and come with a high risk of losing money rapidly due to leverage. 66% of retail investor accounts lose money when trading CFDs with this provider. You should consider whether you understand how CFDs work and whether you can afford to take the high risk of losing your money.
Stratos Global LLC (tradu.com ):
Losses can exceed deposits.
Please be advised that the information presented on TradingView is provided to Tradu (‘Company’, ‘we’) by a third-party provider (‘TFA Global Pte Ltd’). Please be reminded that you are solely responsible for the trading decisions on your account. There is a very high degree of risk involved in trading. Any information and/or content is intended entirely for research, educational and informational purposes only and does not constitute investment or consultation advice or investment strategy. The information is not tailored to the investment needs of any specific person and therefore does not involve a consideration of any of the investment objectives, financial situation or needs of any viewer that may receive it. Kindly also note that past performance is not a reliable indicator of future results. Actual results may differ materially from those anticipated in forward-looking or past performance statements. We assume no liability as to the accuracy or completeness of any of the information and/or content provided herein and the Company cannot be held responsible for any omission, mistake nor for any loss or damage including without limitation to any loss of profit which may arise from reliance on any information supplied by TFA Global Pte Ltd.
The speaker(s) is neither an employee, agent nor representative of Tradu and is therefore acting independently. The opinions given are their own, constitute general market commentary, and do not constitute the opinion or advice of Tradu or any form of personal or investment advice. Tradu neither endorses nor guarantees offerings of third-party speakers, nor is Tradu responsible for the content, veracity or opinions of third-party speakers, presenters or participants.
116 to be reached in november 2022Look how those fibonacci timezones (zone 2) are doing they're job
The next target is 98 hit march/22 (Topzone 3)
Followed by correction to 80 in may/22 (bottomzone 3)
and eventually we will make a new high aournd 116 in november 2022 (topzone 5)
Let's see if this works out guys, i'm curious
cheers

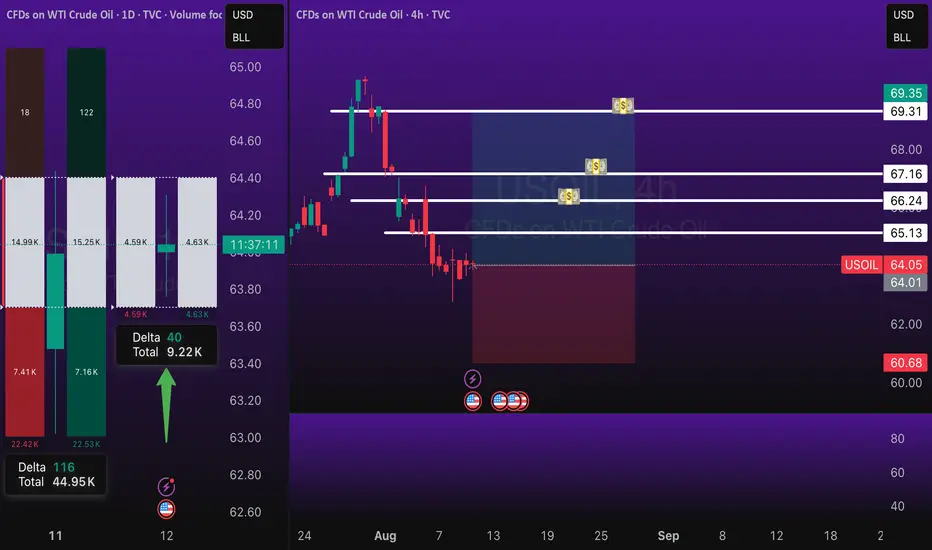
Crude Oil Analysis (WTI / USOIL)Crude oil is currently trading near a key resistance area around $64.00, with the overall trend still bearish.
🔹 Bearish Scenario:
If the price breaks below $63.60 and holds, it may target $62.80 followed by $62.00.
🔹 Bullish Scenario:
If the price manages to break above $64.58 and sustain the move, it could retest the $65.00 zone, and with continued bullish momentum, extend toward $66.30.

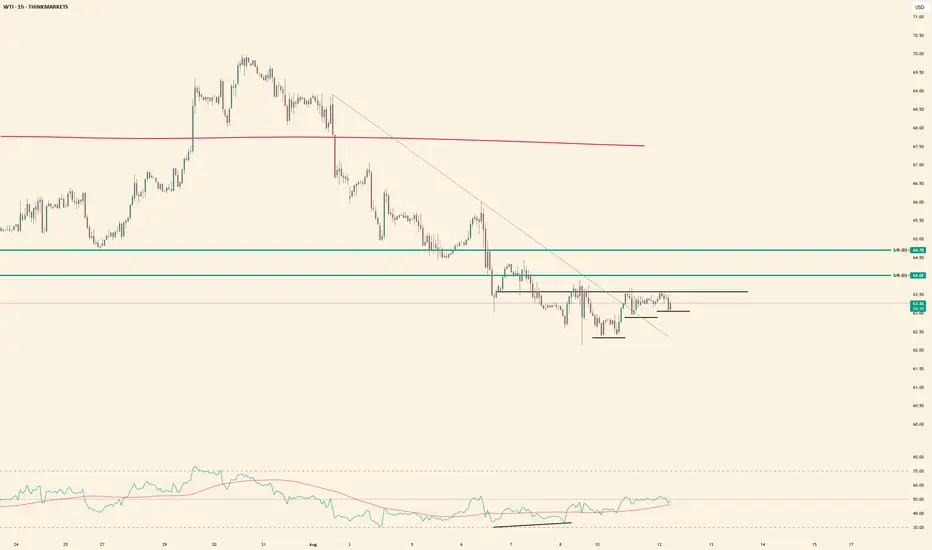
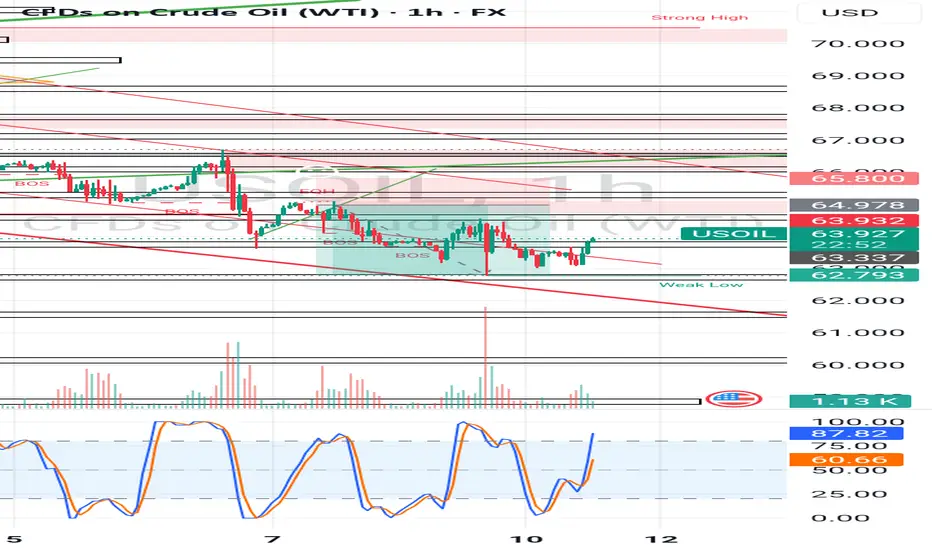
USOIL - Are we having a bullish preasure??Market has started to consolidate creating higher lows on the 1 hour. Is this a sign market might turn?
USOIL Long trade Risking 1% to make 1.6% ProfitTVC:USOIL Long trade, with my back testing of this strategy, USOIL is long.
This is good trade.
Don't overload your risk like Greedy gambler!!!
Be Disciplined Trader, what what you can afford.
Use proper risk management
Looks like good trade.
Lets monitor.
Use proper risk management.
Disclaimer: only idea, not advice
USoil ideaWe are waiting for our asset to reach our action zone, and based on the reaction, we’ll decide on our next moves.ALWAYS WAIT FOR A CONFIRMATION TO SEE IF THE PRICE VALIDATES THE ZONE.and you what is your vision of the EURUSD its interests me! i wait you in the commentar
USOIL rebounds from 6,300.0. Where next?USOIL rebounds from 6,300.0. Where next?
USOIL bounced back from the 6,300.0 mark on Tuesday, building on slight gains from the prior session, after President Donald Trump prolonged a tariff truce with China for an additional 90 days. The decision, made just before new tariffs were due, provided temporary relief from rising trade tensions that might hinder global growth and energy demand. The modest rise towards SMA50 and 6,500.0 level is expected. Market participants will also be waiting for OPEC’s monthly report, along with US EIA and IEA forecasts, for fresh supply–demand signals.

WTI , begging to see SKY WTI is now in weekly demand zone and brooked trend line,
shows that bad news is coming to the world !!!
Boring oil chartLately, the oil chart has been really ugly, and it seems like it doesn’t even know what it wants to do. The candles move like a turtle, mainly due to the strong fundamentals behind oil prices. Honestly, I’ve come to the conclusion that there probably needs to be a war in the Middle East or an oil pipeline leak for the price to finally move, otherwise this chart is just completely dead on its own.

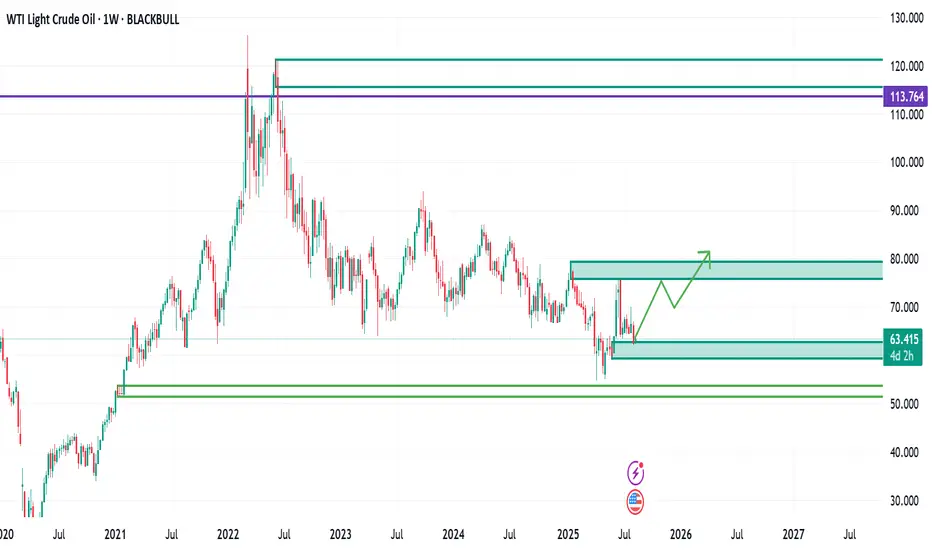
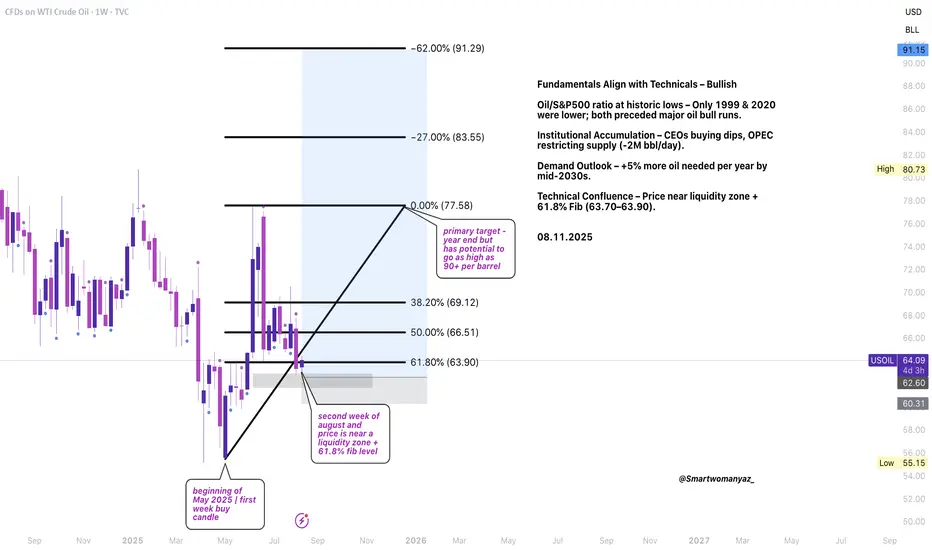
Fundamental + Technical Confirm Bullish TrendWhen news, insider positioning, and the weekly chart all align, I pay close attention and so should you.
Crude oil has built a strong bullish structure on the weekly timeframe, breaking above key resistance levels and holding higher lows. The recent OPEC+ decision to maintain a -2MM bbl/d production cut, combined with CEOs and major oil traders buying aggressively at every dip, provides strong fundamental confirmation of this trend.
In the U.S., gas prices are already trending upward which is another clear signal that the market is pricing in tighter supply and stronger demand.
From a technical perspective, price has cleared the 50% Fibonacci retracement and is now targeting the $77.50 zone in the short term. The medium-term projection sits near $90, with potential for higher if supply constraints persist. Pullbacks into support zones could present attractive re-entry opportunities for swing and position traders.
Bias: Bullish
Targets: $77.50 (short-term)
Chart: Weekly timeframe
If you agree with this outlook, drop your thoughts below or share this idea with others.
USOIL: Eyes on 64.10 as Geopolitics Take Center Stage!!In today’s session, we’re watching USOIL for a potential short setup around the 64.10 zone. Price action remains in a broader downtrend, with the current move looking like a corrective retracement into a key support turned resistance area.
From a fundamental perspective, all eyes are on the scheduled August 15 meeting between Donald Trump and Vladimir Putin. A ceasefire agreement could fuel bearish momentum, potentially accelerating the sell-off. On the other hand, if talks collapse, renewed geopolitical tension could keep oil prices bid in the short term.
Technically, 64.10 is the battleground a decisive rejection here could offer an attractive risk reward for sellers aligned with the dominant trend.


Oil | Bearish Bias Below 64.70as Markets Await U.S.–Russia TalksOil Little Changed, With Focus on U.S.–Russia Meeting
Oil prices were steady in afternoon trade as markets awaited Friday’s meeting between U.S. President Trump and Russian President Putin, which could potentially pave the way for a Ukraine peace deal.
Oil has fallen over 10% this year, pressured by OPEC+ restoring production faster than planned and by weakening global demand prospects.
Technical Outlook:
The price maintains a bearish bias while trading below 64.70, targeting 63.45 and 61.85, with further downside toward 60.20 if broken.
However, market direction could shift sharply depending on the outcome of Friday’s meeting.
A move above 64.75 would target 65.80, and a breakout beyond this could trigger bullish momentum toward 67.20 and 69.10.
Pivot: 64.70
Support: 63.45, 61.85, 60.20
Resistance: 65.80, 67.20, 69.10

WTI Crude Oil (USOIL) Analysis:The price of crude oil is currently trading near a nearby resistance area at $64.23, with the overall trend remaining bearish.
🔹 Bearish Scenario:
If the price breaks below $63.00 and holds under this level, we may see a target around $62.00.
🔹 Bullish Scenario:
If the price manages to break back above $64.58 and sustain above it, a retest of the $65.00 area is possible, and with continued buying momentum, the price could reach $66.30.
⚠️ Disclaimer:
This analysis is not financial advice. Please monitor the markets and carefully analyze the data before making any investment decisions.

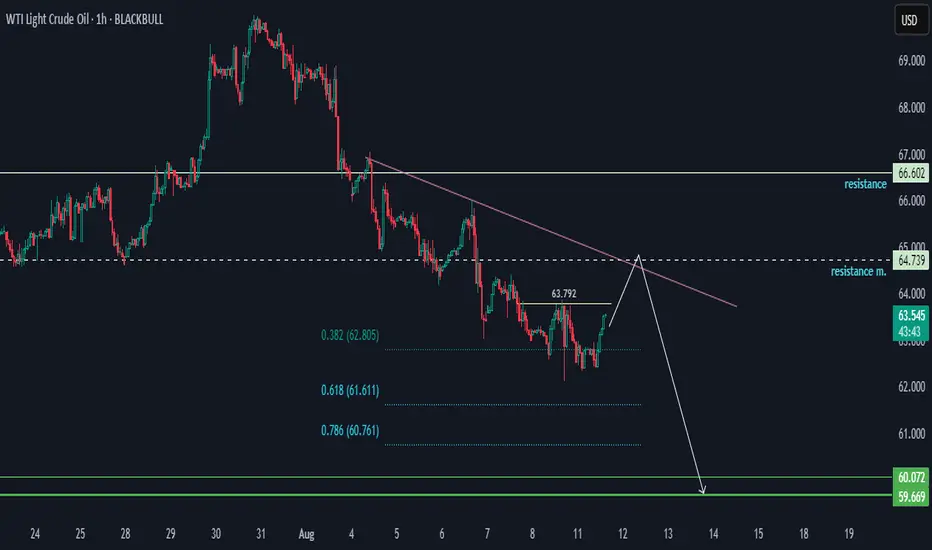
WTI In a Bearish Trend.WTI is in a bearish trend, but on the daily timeframe, buyers are attempting to push against the bearish pressure at 65 and are facing immediate resistance at 63.792. Overall, the price has the potential to pulse and pull back into the bearish momentum.
We have two target support areas for a bias of 60.072–59.669, with a minor support level worth noting at 62.805.
Happy Trading,
Khiwe.
Not trading advice
US OIL SHORT RESULT Oil price was both in a major and minor falling channel and still showing signs to the downside, and after it broke down the Trendline I took the short and it moved as predicted 🔥
So from here we'll see what happens next.
_THE_KLASSIC_TRADER_.💪
Crude oil 4-hour channel and Bullish Shark pattern on 4-hour 1: Bullish Shark pattern on the 4-hour timeframe
2: Crude oil 4-hour channel
3: RSI indicator is currently in a low divergence state in the 4-hour cycle.
Wait for the reversal signal confirmation at the 4-hour level
or At the same time, the confirmation after the price breaks through the descending channel
can try long orders

Crude Oil Weekly Outlook: Tariffs, Ceasefire, OPEC & CPI RisksKey Events This Week
• WTI drops to 62.60 ahead of major geopolitical and economic catalysts: Ukraine ceasefire, U.S.–China tariffs, OPEC report, and U.S. CPI
• Global tariff developments continue to shape sentiment and crude demand valuations, especially in relation to OPEC’s evolving supply strategy
WTI’s latest drop is currently holding at the 0.618 Fibonacci retracement of the May–June uptrend, and precisely at the neckline of the inverted head and shoulders pattern around the 62.60 level. The Fibonacci retracement was applied from the $55 low to the $77.80 close, filtering out breakout noise from the Iran–Israel escalation outside the borders of the 3-year down trending channel.
• If 62.60 breaks, downside risks may accelerate toward the mid-zone of the channel, with key levels in sight at 61.40, 59.40, and 55.20, respectively.
• If 62.60 holds, and WTI reclaims ground above 65, we could see a recovery toward the upper edge with next resistance levels at 68.00, 70.00, 71.40, and 72.70.
Written by Razan Hilal, CMT

6-month oil price analysisThe oil price is in its support range and, with buying pressure and inflow of liquidity, is likely to increase to the 3 specified targets.
Sasha Charkhchian

USOIL H4 | Potential bearish dropUSOIL has reacted off the sell entry which is a pullback resistance and could drop from this level to the take profit.
Sell entry is at 64.13, which is a pullback resistance.
Stop loss is at 67.06, which is a pullback resistance.
Take profit is at 60.05, which is a multi swing low support.
High Risk Investment Warning
Trading Forex/CFDs on margin carries a high level of risk and may not be suitable for all investors. Leverage can work against you.
Stratos Markets Limited (tradu.com ):
CFDs are complex instruments and come with a high risk of losing money rapidly due to leverage. 65% of retail investor accounts lose money when trading CFDs with this provider. You should consider whether you understand how CFDs work and whether you can afford to take the high risk of losing your money.
Stratos Europe Ltd (tradu.com ):
CFDs are complex instruments and come with a high risk of losing money rapidly due to leverage. 66% of retail investor accounts lose money when trading CFDs with this provider. You should consider whether you understand how CFDs work and whether you can afford to take the high risk of losing your money.
Stratos Global LLC (tradu.com ):
Losses can exceed deposits.
Please be advised that the information presented on TradingView is provided to Tradu (‘Company’, ‘we’) by a third-party provider (‘TFA Global Pte Ltd’). Please be reminded that you are solely responsible for the trading decisions on your account. There is a very high degree of risk involved in trading. Any information and/or content is intended entirely for research, educational and informational purposes only and does not constitute investment or consultation advice or investment strategy. The information is not tailored to the investment needs of any specific person and therefore does not involve a consideration of any of the investment objectives, financial situation or needs of any viewer that may receive it. Kindly also note that past performance is not a reliable indicator of future results. Actual results may differ materially from those anticipated in forward-looking or past performance statements. We assume no liability as to the accuracy or completeness of any of the information and/or content provided herein and the Company cannot be held responsible for any omission, mistake nor for any loss or damage including without limitation to any loss of profit which may arise from reliance on any information supplied by TFA Global Pte Ltd.
The speaker(s) is neither an employee, agent nor representative of Tradu and is therefore acting independently. The opinions given are their own, constitute general market commentary, and do not constitute the opinion or advice of Tradu or any form of personal or investment advice. Tradu neither endorses nor guarantees offerings of third-party speakers, nor is Tradu responsible for the content, veracity or opinions of third-party speakers, presenters or participants.
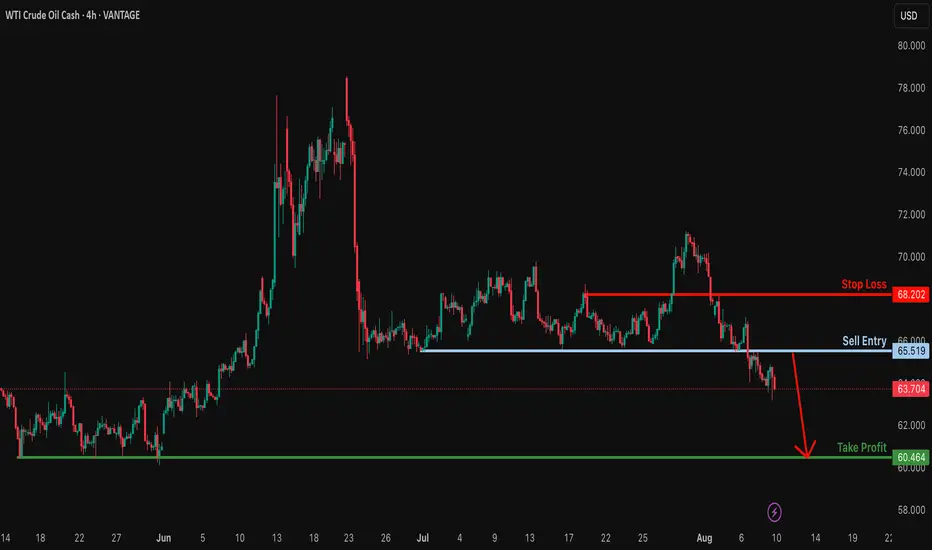
Bearish drop?USO/USD has reacted off the resistance level which is a pullback resistance and could potentially drop from this level to our take profit.
Entry: 65.51
Why we like it:
There is a pullback resistance.
Stop loss: 68.20
Why we like it:
There is a pullback resistance.
Take profit: 60.46
Why we like it:
There is a multi swing low support.
Enjoying your TradingView experience? Review us!
Please be advised that the information presented on TradingView is provided to Vantage (‘Vantage Global Limited’, ‘we’) by a third-party provider (‘Everest Fortune Group’). Please be reminded that you are solely responsible for the trading decisions on your account. There is a very high degree of risk involved in trading. Any information and/or content is intended entirely for research, educational and informational purposes only and does not constitute investment or consultation advice or investment strategy. The information is not tailored to the investment needs of any specific person and therefore does not involve a consideration of any of the investment objectives, financial situation or needs of any viewer that may receive it. Kindly also note that past performance is not a reliable indicator of future results. Actual results may differ materially from those anticipated in forward-looking or past performance statements. We assume no liability as to the accuracy or completeness of any of the information and/or content provided herein and the Company cannot be held responsible for any omission, mistake nor for any loss or damage including without limitation to any loss of profit which may arise from reliance on any information supplied by Everest Fortune Group.
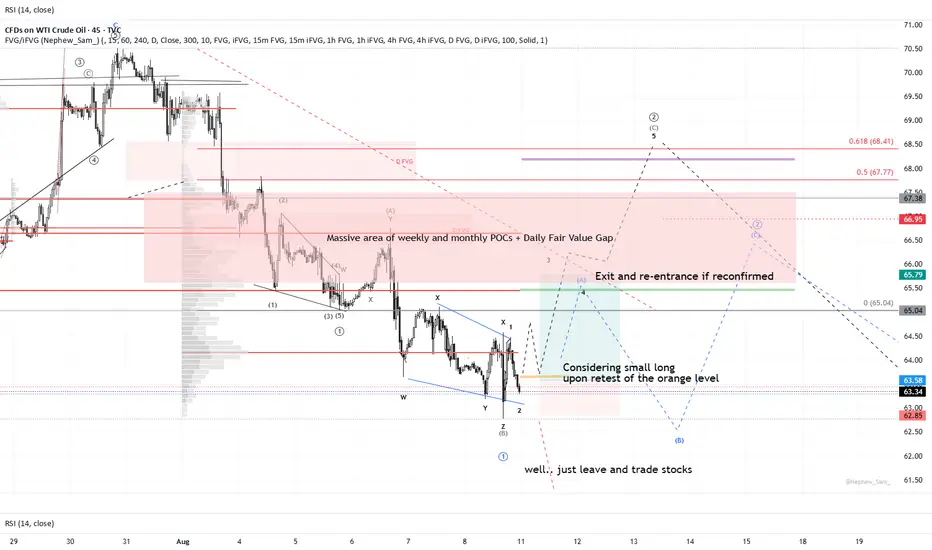
OIL:Trading Against the Trend: Waiting for a Correction to ShortI'm still battling the market here, waiting for a pullback that would:
Reject price from resistance
Print a clean corrective wav
e for a short entry
Counter-trend trading usually ends as well as holding over weekends—poorly.
That said, levels keep the roadmap clear. Pullbacks can play out a dozen ways.
A bounce into these zones would also sweep last week's FVG liquidity.