CryptoFortune
What if Bitcoin is destined to follow a consolidation price in pink? What if that's the answer we are looking for? The hype of 2017 has to be excluded from this... but what if we make it where BTC went to 10K and then back down. Would ABCDE match? So far it has. The real question is... is this triangle here the one we would be working with had Bitcoin not gone to...
Just for research purposes. This is not 100% what will happen but what COULD HAPPEN. If E WAVE breaks, SELL IT!
BITCOIN $5000 Possible Track. Without panic, we will not have a big drop... we should pivot to the right and if we hit the mega resistance at 9500USD it will reject harder and into the 5K Zones should panic start. This chart is for publishing purposes only.
Price action goes up from the left and down into this wedge and normal TA expects it to flow north from this wedge. I have the main dip here as the actual main dip but after that phase, we have the price staying in this wedge the entire time. Will be interesting to see as we are at this time in an inclined symmetrical triangle.
Bitcoin is here right now... it can move sideways into the heavy resistance this month and give us glory... or it will move down out of this pennant and go into the bad zones. Regardless. This is reality of BTC.
FINALLY. I am actually beginning to see what $LTC is up to. I believe this sharp drop is the first leg down on a giant Triangle. Similar to $ETH path of 2017 in style but double in price. RT/SHARE/LIKE! This is what I believe is the most probable Litecoin path. 600-650/LTC Summer 2018
Hello, I am not wanting to scare anyone here but these are common in the market. It is called Parabolic curves. This is a Parabolic curve over the course of a year and some odd months with BTC. You can see that 2017 is needing a correction into 2018. The flags are about ready to stand 90 degrees and that is calculated on the next ATH. If history repeats itself and...
Formed a VERY noticeable BULL FLAG. You can see target is 0.03BTC. Last tmie Bitcoin was just under 10K LTC had a ratio of around 0.005. Right now LTC/BTC is 0.019. That is over THREE TIMES STRONGER than last year. Bitcoin is being trailed by LTC. Lets see how this will go.
Giving these paths but either way, Litecoin will recover.
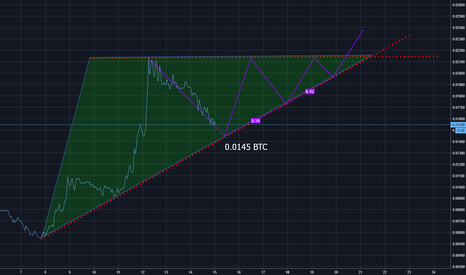
We now have a confirmed locked in ascending triangle lasting nearly 10 days. This has held up all month long and should this break, we will be headed to 0.03 BTC. Math Breakdown on BTC prices and LTC BTC/ 20,000 = 600 LTC BTC/22,000 = 660 LTC BTC/25,000 = 750 LTC Now we wait and see how this plays out. Lets do it!
Litecoin will take either of these paths. There is no real way to know what it will take but 66% of this pattern is a bear pattern while 33% breaks to the upper side... the odds are showing 2/3 this will drop to the green mega support. Just press play hourly to see how this plays out for you. Happy Trading.
This looks like the most probable target. XRP had a great run but things need to correct more. We'll see how this plays out.
It is what it is. Hype is over, and we saw what can happen on a super rally. Anything else is just moot at the moment. Correction in play. May bounce, may not. If it goes under the red arrow where the pink line is... sell it all.
Long LTC/BTC 0.145 via this chart. USD would be 205 LTC lowest. Nice entry also 220 LTC
As the chart shows, if you're looking for a long. I believe around 3USD is a good bet.
Chart says this, so i'd say Wave C around 55 cents is likely for your next LONG.
IOTA is still moving along and is just about to get to $5. If this happens, the end December target will be in the yellow and green zones. I even see a possible PINK ZONE (Hyper parabolic IOTA) The green zone is the absolute highest support IOTA must take for a nice $7.5 IOTA end of month show. Yellow = $10 Pink = 15
IOTA seems to be in a Massive Triangle and the market is still holding this beast together. Should it breakout I expect $8 USD on the horizon. See chart.


