ProTradeProfessor
Market formed divergence and after that it broke the HL and changed the trend to bearish. market is currently in control of bears and bearish triangle pattern is being formed. we take instant entry and place our SL above the LH and place our TPs as projected.
Market has formed head and shoulder pattern followed by Bearish Divergence. we take entry on break of neckline and place stoploss above right shoulder. TPs as projected with R:R of 1:1 and 1:2
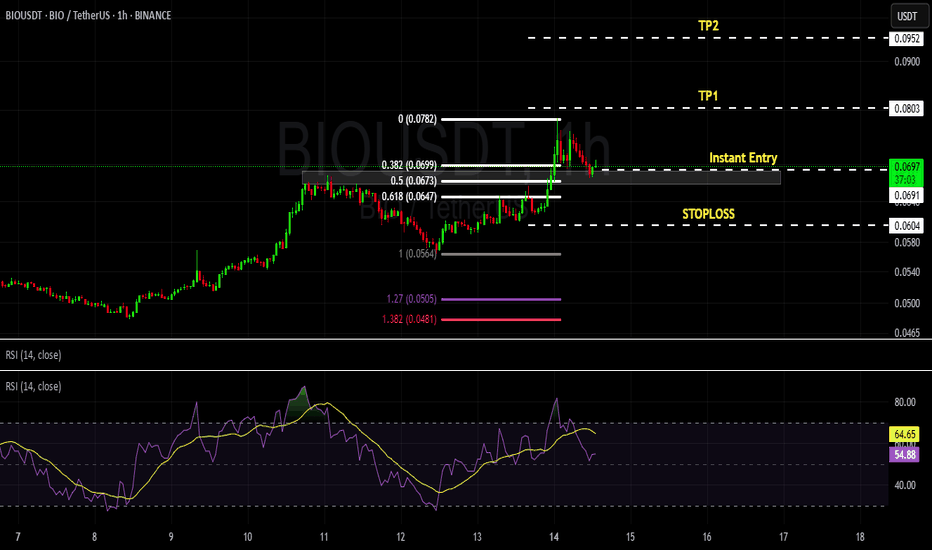
BIOUSDT is making HH and HL. It is taking correction till fib level of 0.382 and took a rejection from support level. we take instant entry & place stop loss below the last HL defined. we anticipate our target as Tp1 and Tp2 with R:R of 1:1 and 1:2. Happy Trading and enjoy profits.
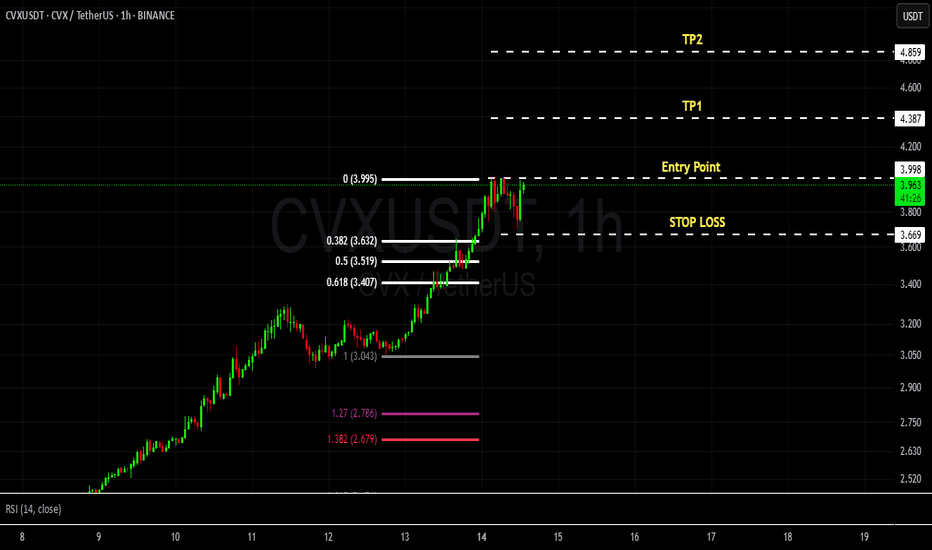
market is making series of HH and HL. market has taken corrective move uptil 0.382 of Fib Level, we shall take entry on break of HH and SL will be placed beneath the HL after being formed. R:R of 1:1 and 1:2
AUDNZD is trending in bullish trend with HH and HL. Market has took correction from fib level of 0.382-0.5 which is a good support level. Futher, market has shown channel which is a continuation pattern. we can instant enter in the market with our SL below last HL. Targets are TP1 and TP2 with a R:R of 1:1 and 1:2.
NZDUSD is making series of LH and LLs. there is no divergence therofore bears will remain in control of the market. market has retraced to the the fib level of 0.382 and took rejection from the resistance level marked. futher market is moving in channel which is a continuation pattern. we are all set to take sell entry instantly with our SL defined above last...
market is in bull trend and have formed first HH and HL. bullish divergence and double bottom adds weight to the bull we anticipate market to remain bullish, and entry is taken instantly and sl below the LH. take profits are with R:R of 1:1 and 1:2. we can also trade on the break of neck line of flag cont. pattern.
Story: Market is in bullish trend with series of HH and HLs. There is no divergence on the chart therefore we expect market to continue bullish trend. as the market is continuing bullish, we look for any continuation pattern. Yes, we have found one, which is bullish flag pattern. there is no reversal or harmonic pattern. Anticipate : it is anticipated that market...
Market is making series of LH and LL, it has no divergence and we anticipate the market to reach TP1 and TP2 in continuation of Bear Trend. Market has broken the resistance level of 0.81613 with momentum candle which is a good indication of bearish trend.
Market formed a BUllihs divergence on 1H time frame followed by the inverse H&S pattern. Market broke the last LH, and then formed the 1st HH and HL and 2nd HL is being formed. which is clear sign of bullish trend. we take instant entry and place our SL below the right Shoulder of pattern. we anticipate the market to remain bullish and put TPs 1 and 2...
Story: Strong Bullish rally from previous - Market make a corrective move till 0.382 level of FIB and followed by Bullish Flag pattern. Anticipate : we anticipate market to continue the bullish trend and we plan our entry on the breakout of flag neck line. PLAN : entry point is break of neckline level, TPs will be as projected through Pole of FLAG.
market previously made a bearish divergence followed by wedge pattern and then making First HH and we wait for the 1st HL. we anticipate market to restest fib level of 0.38 where from we will take entry buylimit and TPs as planned
Market took a bull run and then consolidated and then bulls again took of control.
Market is in bearish trend, however there is a bullish divergence on 1H time- which means market may take a deep correction. Futher harmonic pattern Bullish crab is also in formation. Take the entry above the break of LH and stoploss below the D point / LL. and TPs with R:R ratio of 1:1 and 1:2 Thanks.
Story: Market is in bullish trend with series of HH and HLs. There is no divergence on the chart therefore we expect market to continue bullish trend. as the market is continuing bullish, we look for any continuation pattern. Yes, we have found one, which is bullish flag pattern. there is no reversal or harmonic pattern. Anticipate : it is anticipated that...
Story : Market was making series of HH and HL, and then market consolidated. However, bullish rectangular pattern can be formed which indicates market will most likely continue bullish pattern with an upside breakout. we anticipate market to give breakout on either side, with most chances of breakout on upside as the trend previously remained bullish. We plan...
Story : Market has broken the consolidation zone (previous Support) and then moved with strong bear rally. market took a corrective move uptil a FIB level of 0.382 and then retraced back for the bearish rally again. Futher market has also formed Bearish Continuation pattern which is a good confluence for bears to hold. Anticipate : we anticipate market to...
story : Market is making series of HH and HL. However the market has formed minor divergence which made the market to take corrective move uptil 0.382 level of FIb. further market is overall in bull trend with the formation of Bullish continuation pattern. anticipate: Bulls will take control of market and we anticipate that it will rise further after breaking...


